Onyxcoin has had one of the most uneven price paths in the market recently. Over the past three months, the XCN price has been down about 22%, even though it has remained up roughly 45% over the past month. Most of that upside came in a short burst between December 30 and January 6, when the price surged rapidly before momentum faded.
Since peaking near $0.013, Onyxcoin has corrected nearly 48%. At face value, this looks like a classic boom-and-bust move driven by profit-taking. But under the surface, the correction is doing something more important. A large portion of speculative supply has already exited, selling pressure is thinning, and momentum is starting to stabilize near heavy historical support.
A Familiar Structure Is Forming as Price Tests Heavy Cost Basis Support
Momentum is beginning to diverge from price. On the daily chart, Onyxcoin is forming the early structure of a bullish divergence on the Relative Strength Index. RSI measures the balance between recent gains and losses and often turns higher before the price does when selling pressure is fading.
This setup has mattered for XCN before. Between October 10 and December 30, the price made a lower low while the RSI formed a higher low. That divergence marked seller exhaustion and was followed by a rally of more than 200% in less than a week.
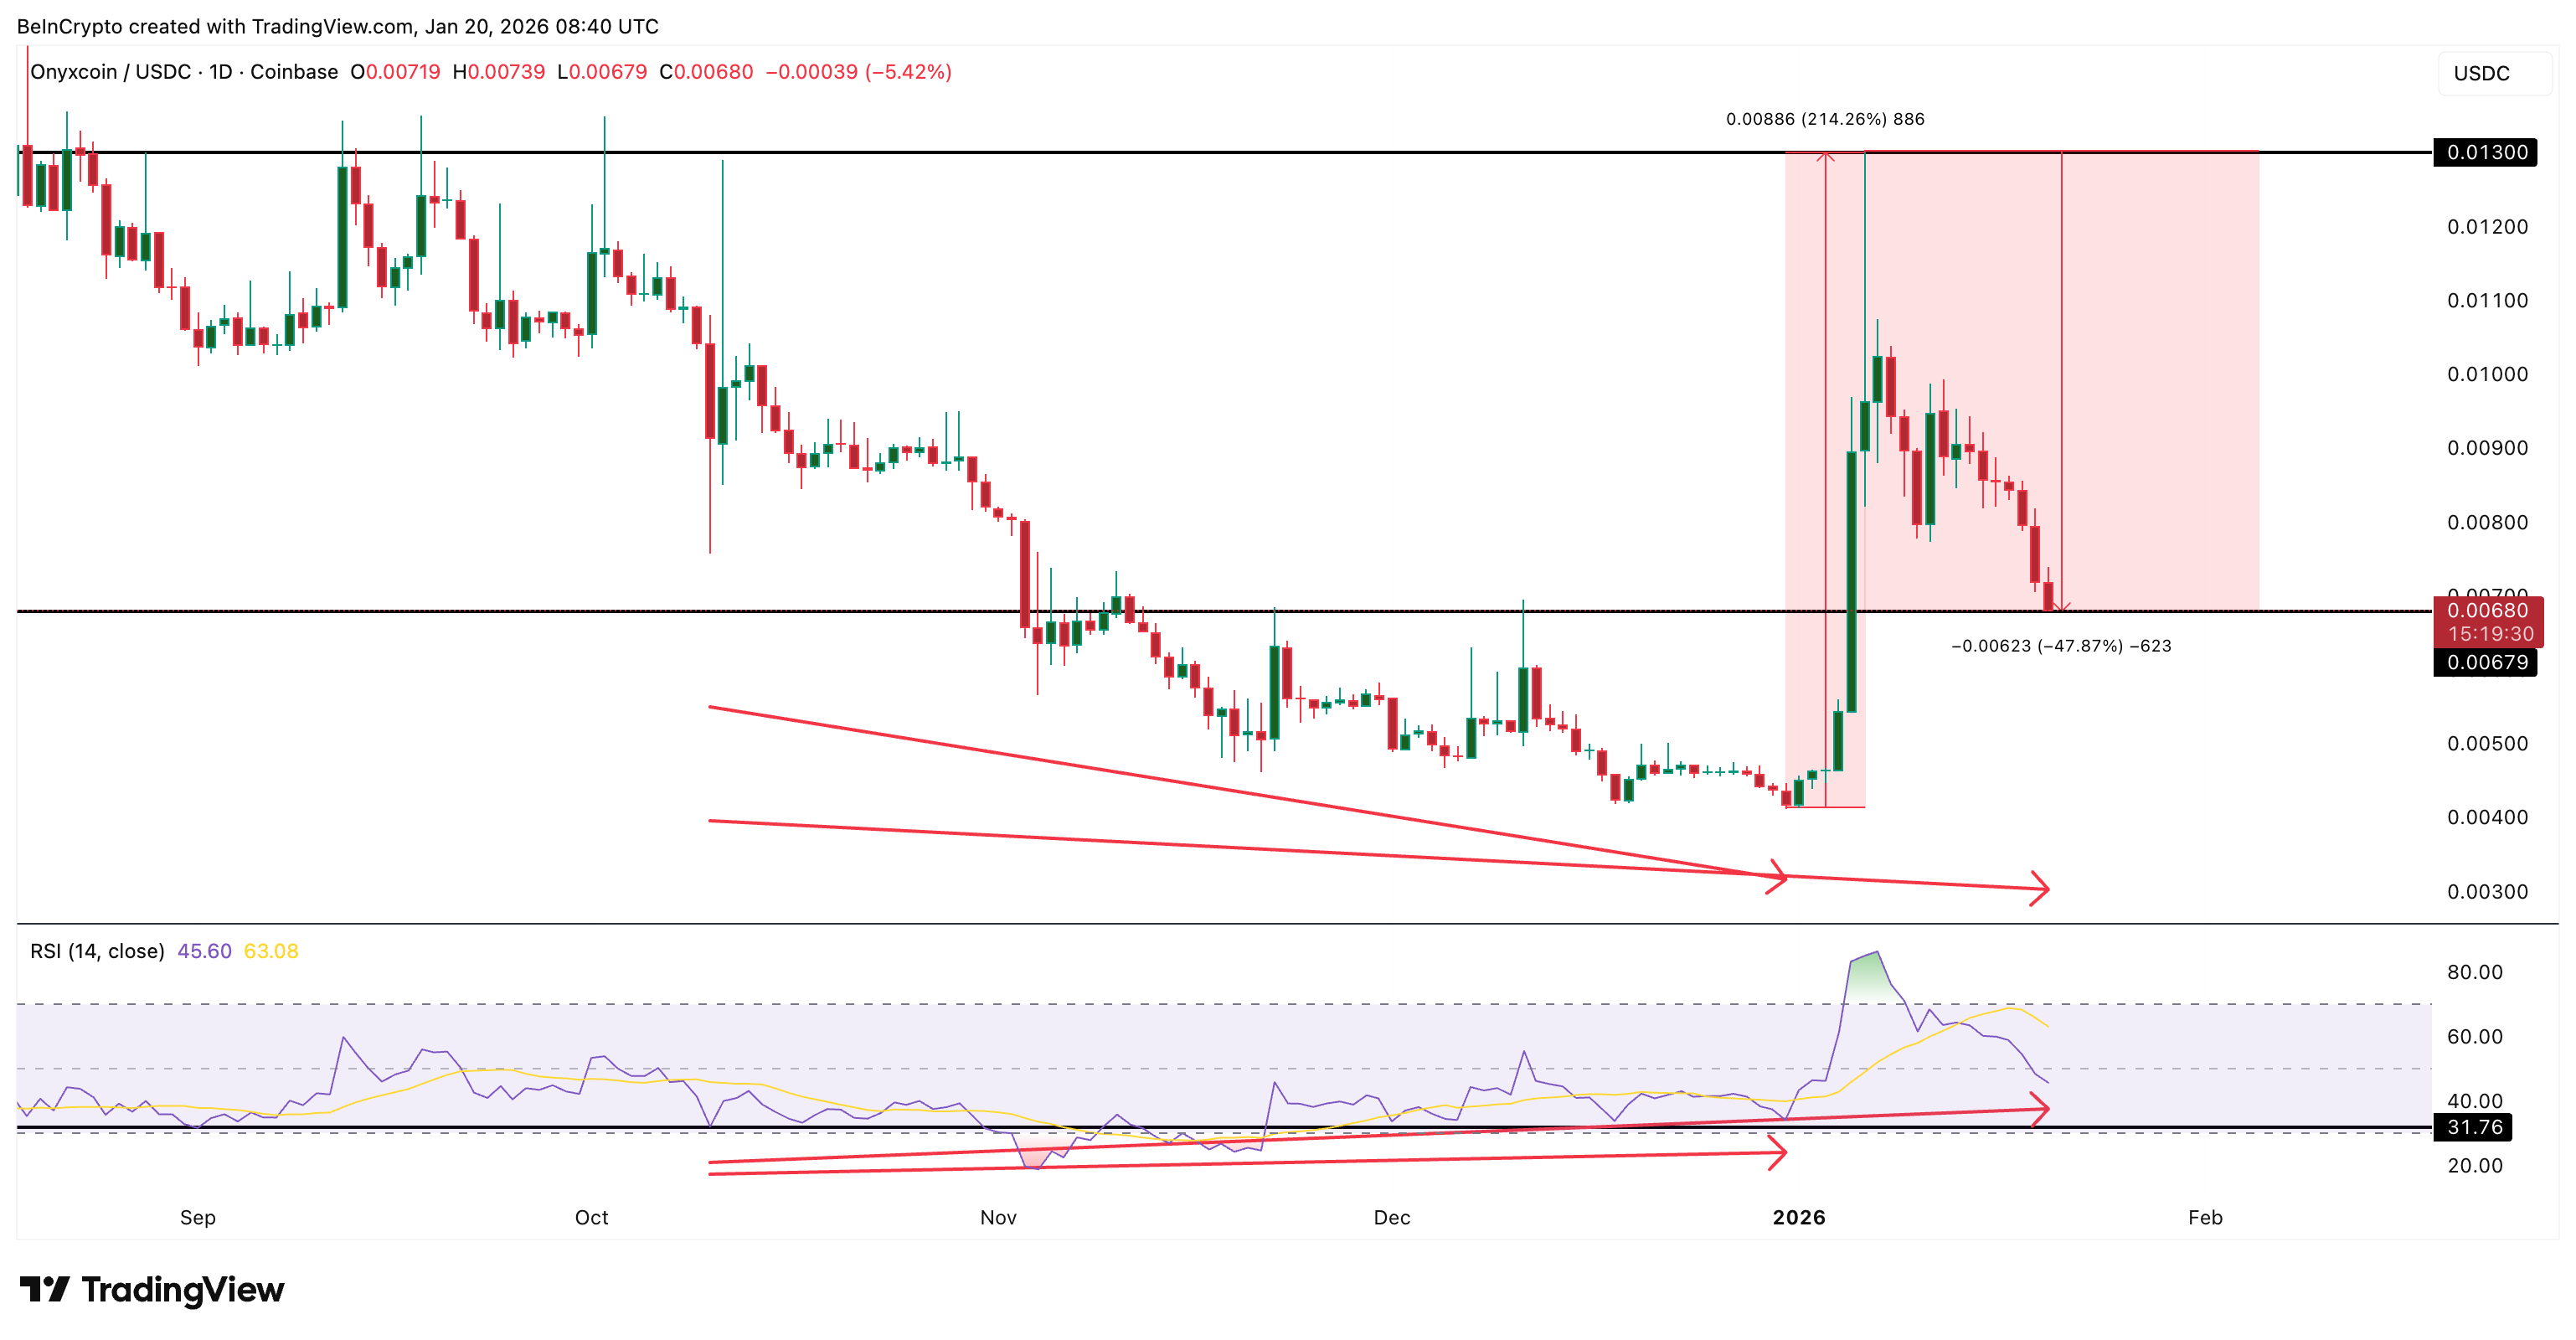
A similar structure is now developing between October 10 and January 20. Price continues to drift lower, but RSI is holding up better than during the prior selloff. The signal is not confirmed yet. For immediate divergence confirmation, the next daily candle needs to hold above roughly $0.0067. If that happens, the divergence shifts from potential to active. If not, a deeper correction, provided the RSI doesn’t drop under the October 10 levels, still keeps the bullish divergence setup alive.
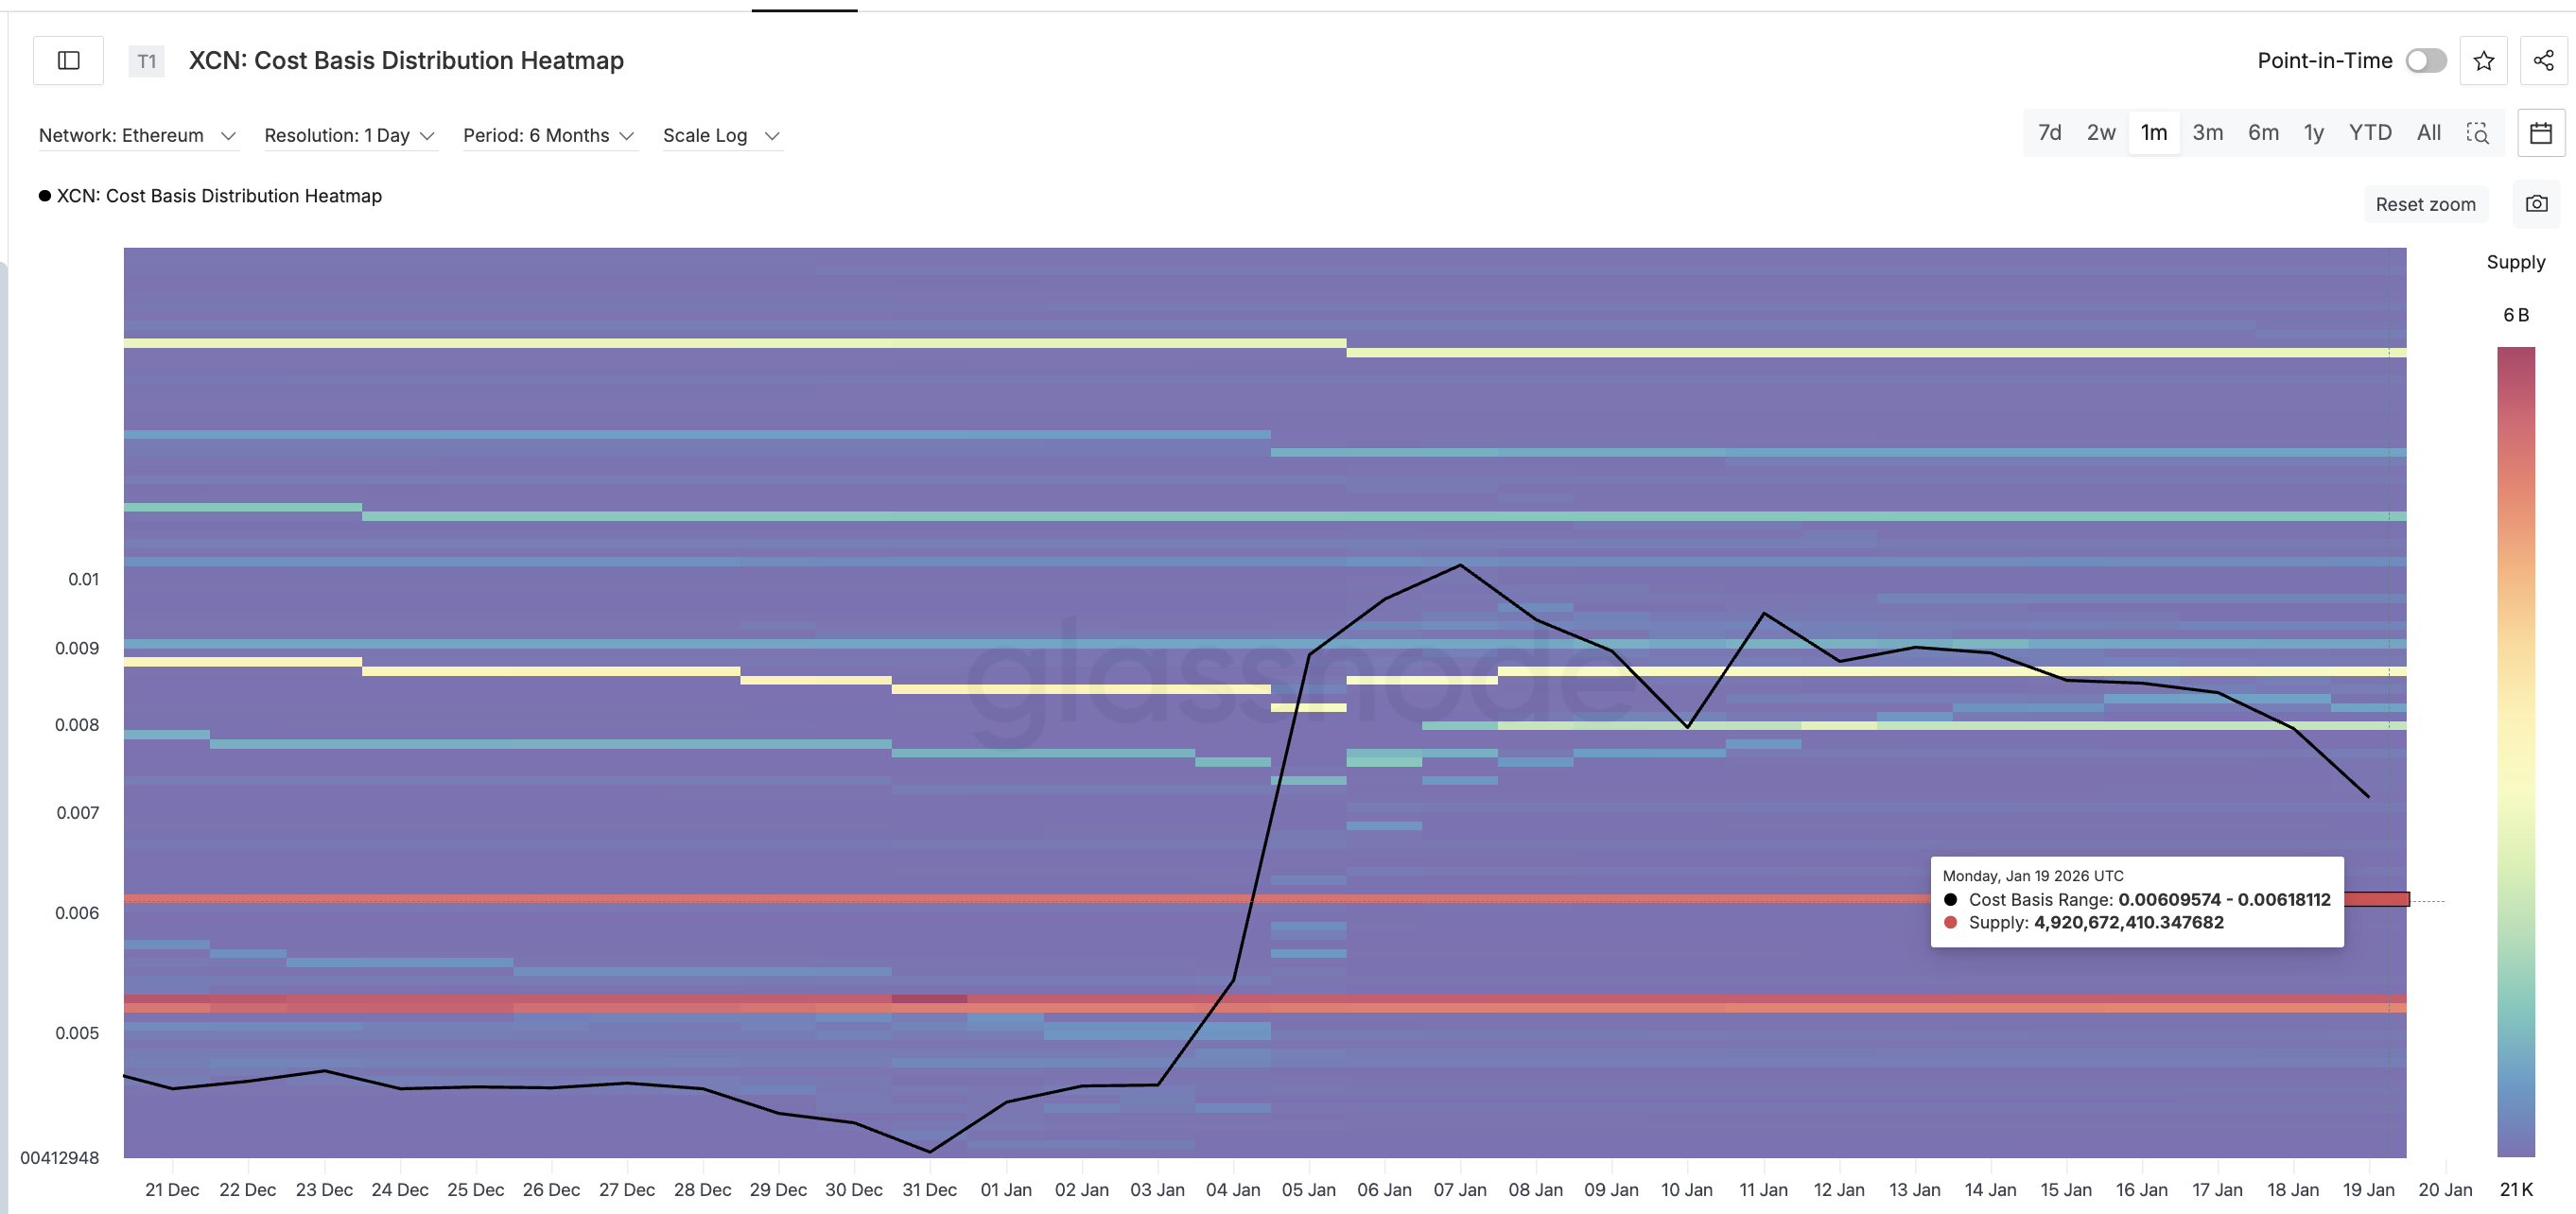
Even if XCN price slips further, the downside is becoming increasingly defined. Cost basis data shows a dense accumulation zone between $0.0060 and $0.0061, where roughly 4.9 billion XCN were acquired. This cluster represents a level where many holders are already near breakeven, making it a natural area for selling pressure to fade and for buyers to step in.
Momentum is trending up just as the price approaches one of its heaviest historical support zones.
Speculative Holders Exit in Size — Why That May Be Constructive
The most important change is happening in holder behavior.
Over the past month, speculative Onyxcoin holders have exited aggressively. Wallets holding XCN for one day to one month saw their combined share of circulating supply collapse, as shown by the HODL Waves metric. This metric segregates wallets based on holding time.
The one-week to one-month cohort fell from 27.56% of supply to just 3.65%, while the one-day to one-week group dropped from 4.69% to roughly 0.80%.
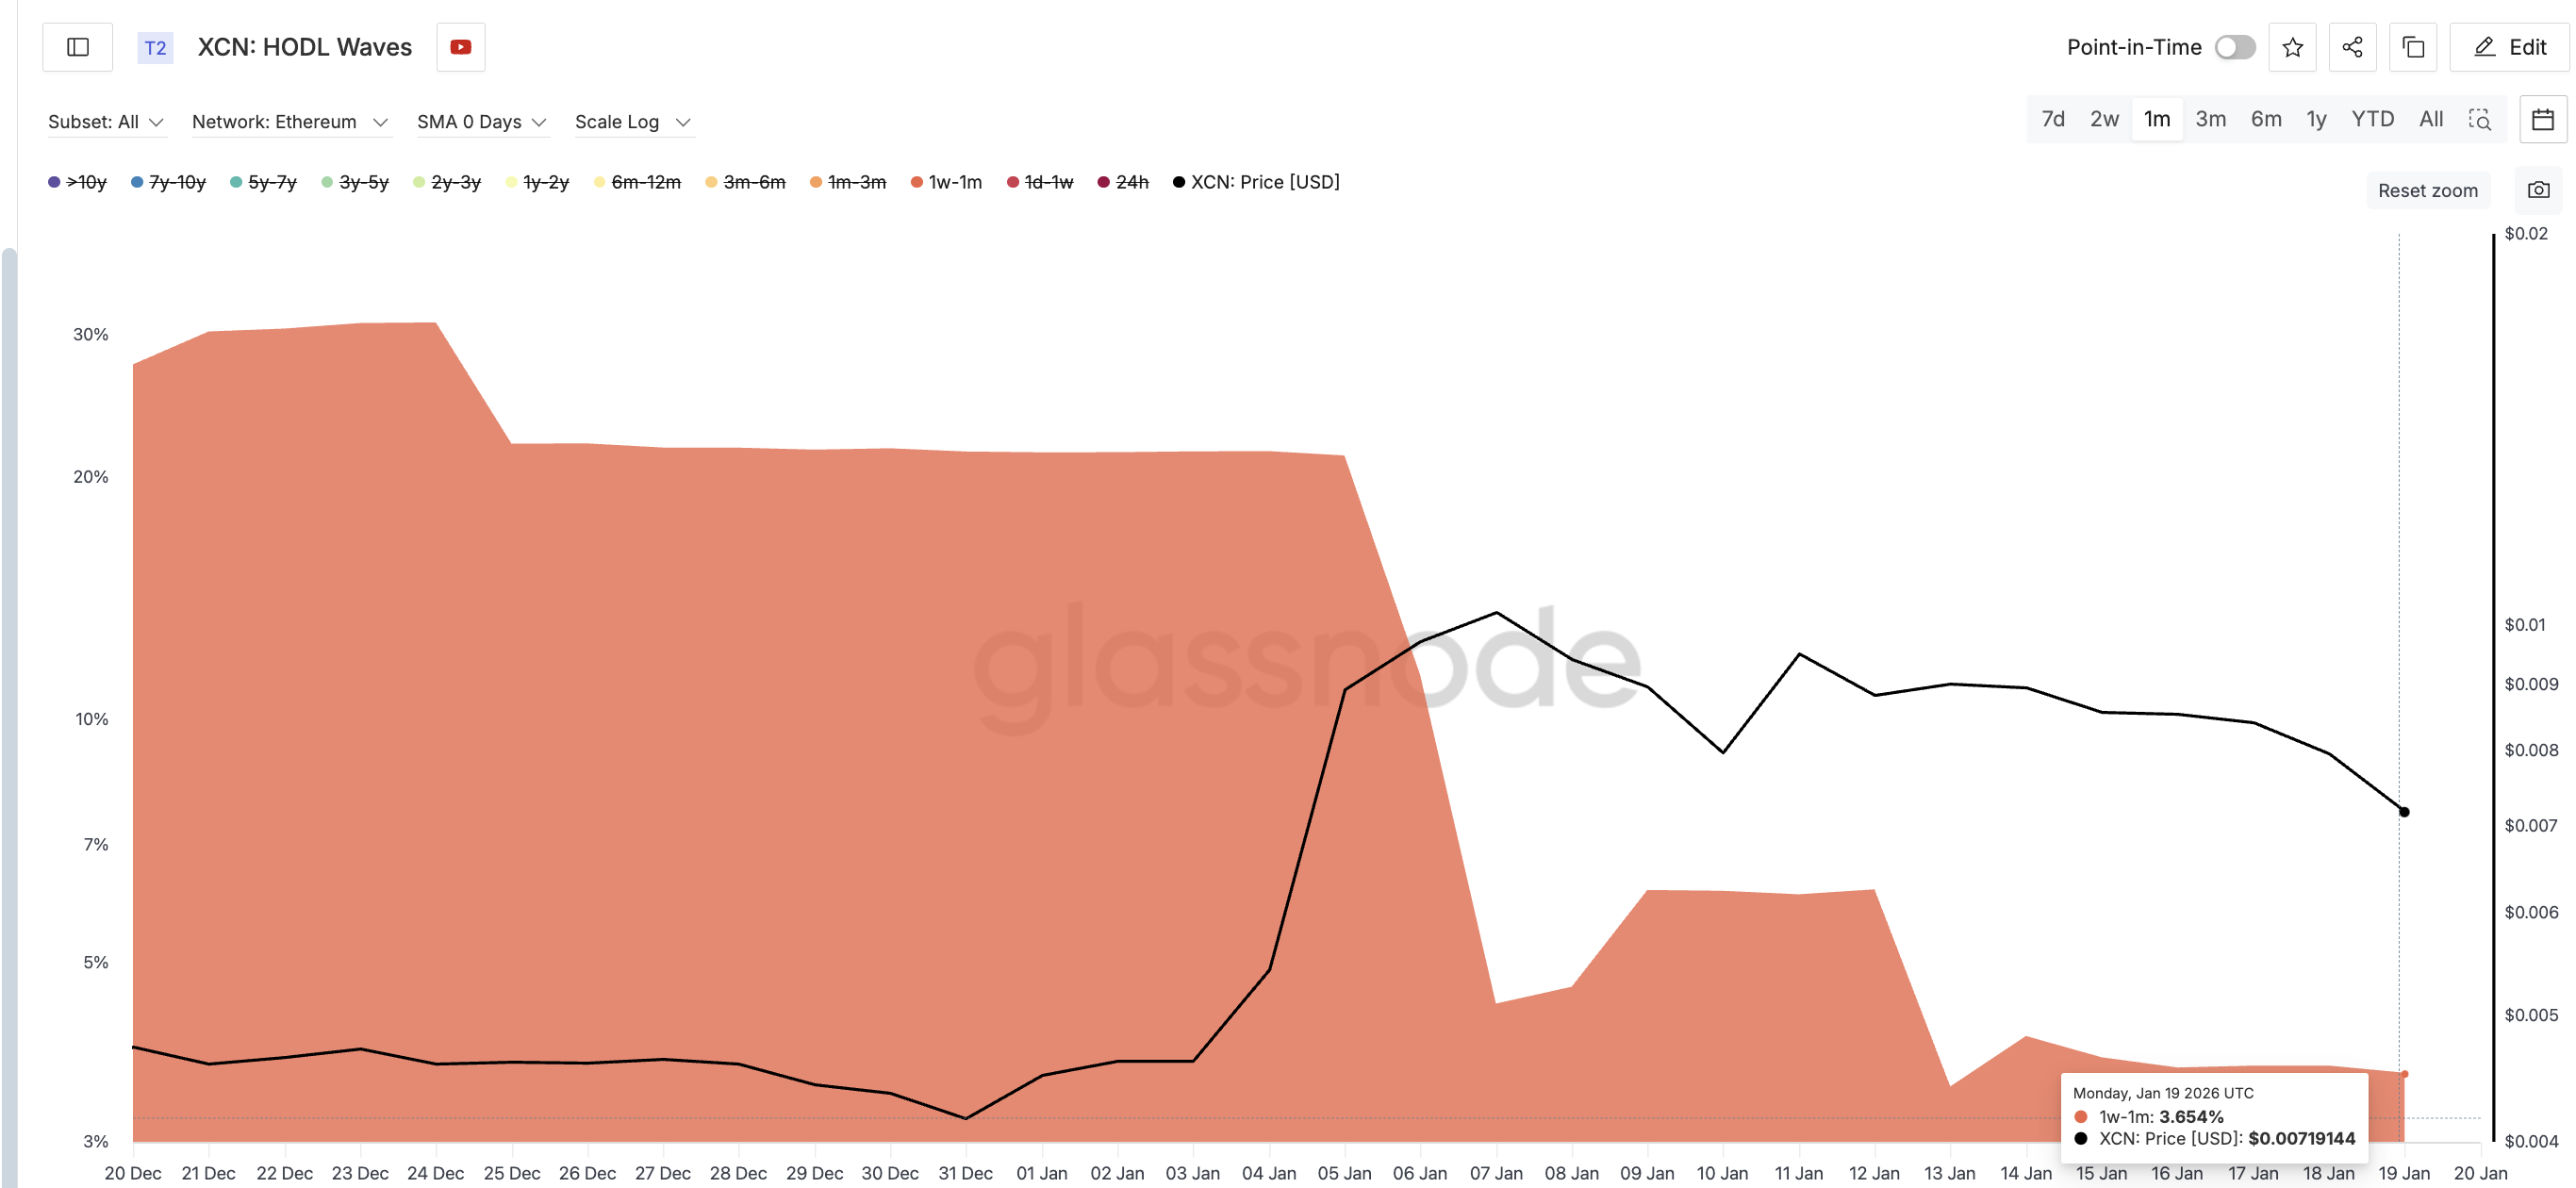
Together, these speculative cohorts controlled more than 32% of the total supply earlier in the correction. They now control less than 5%.
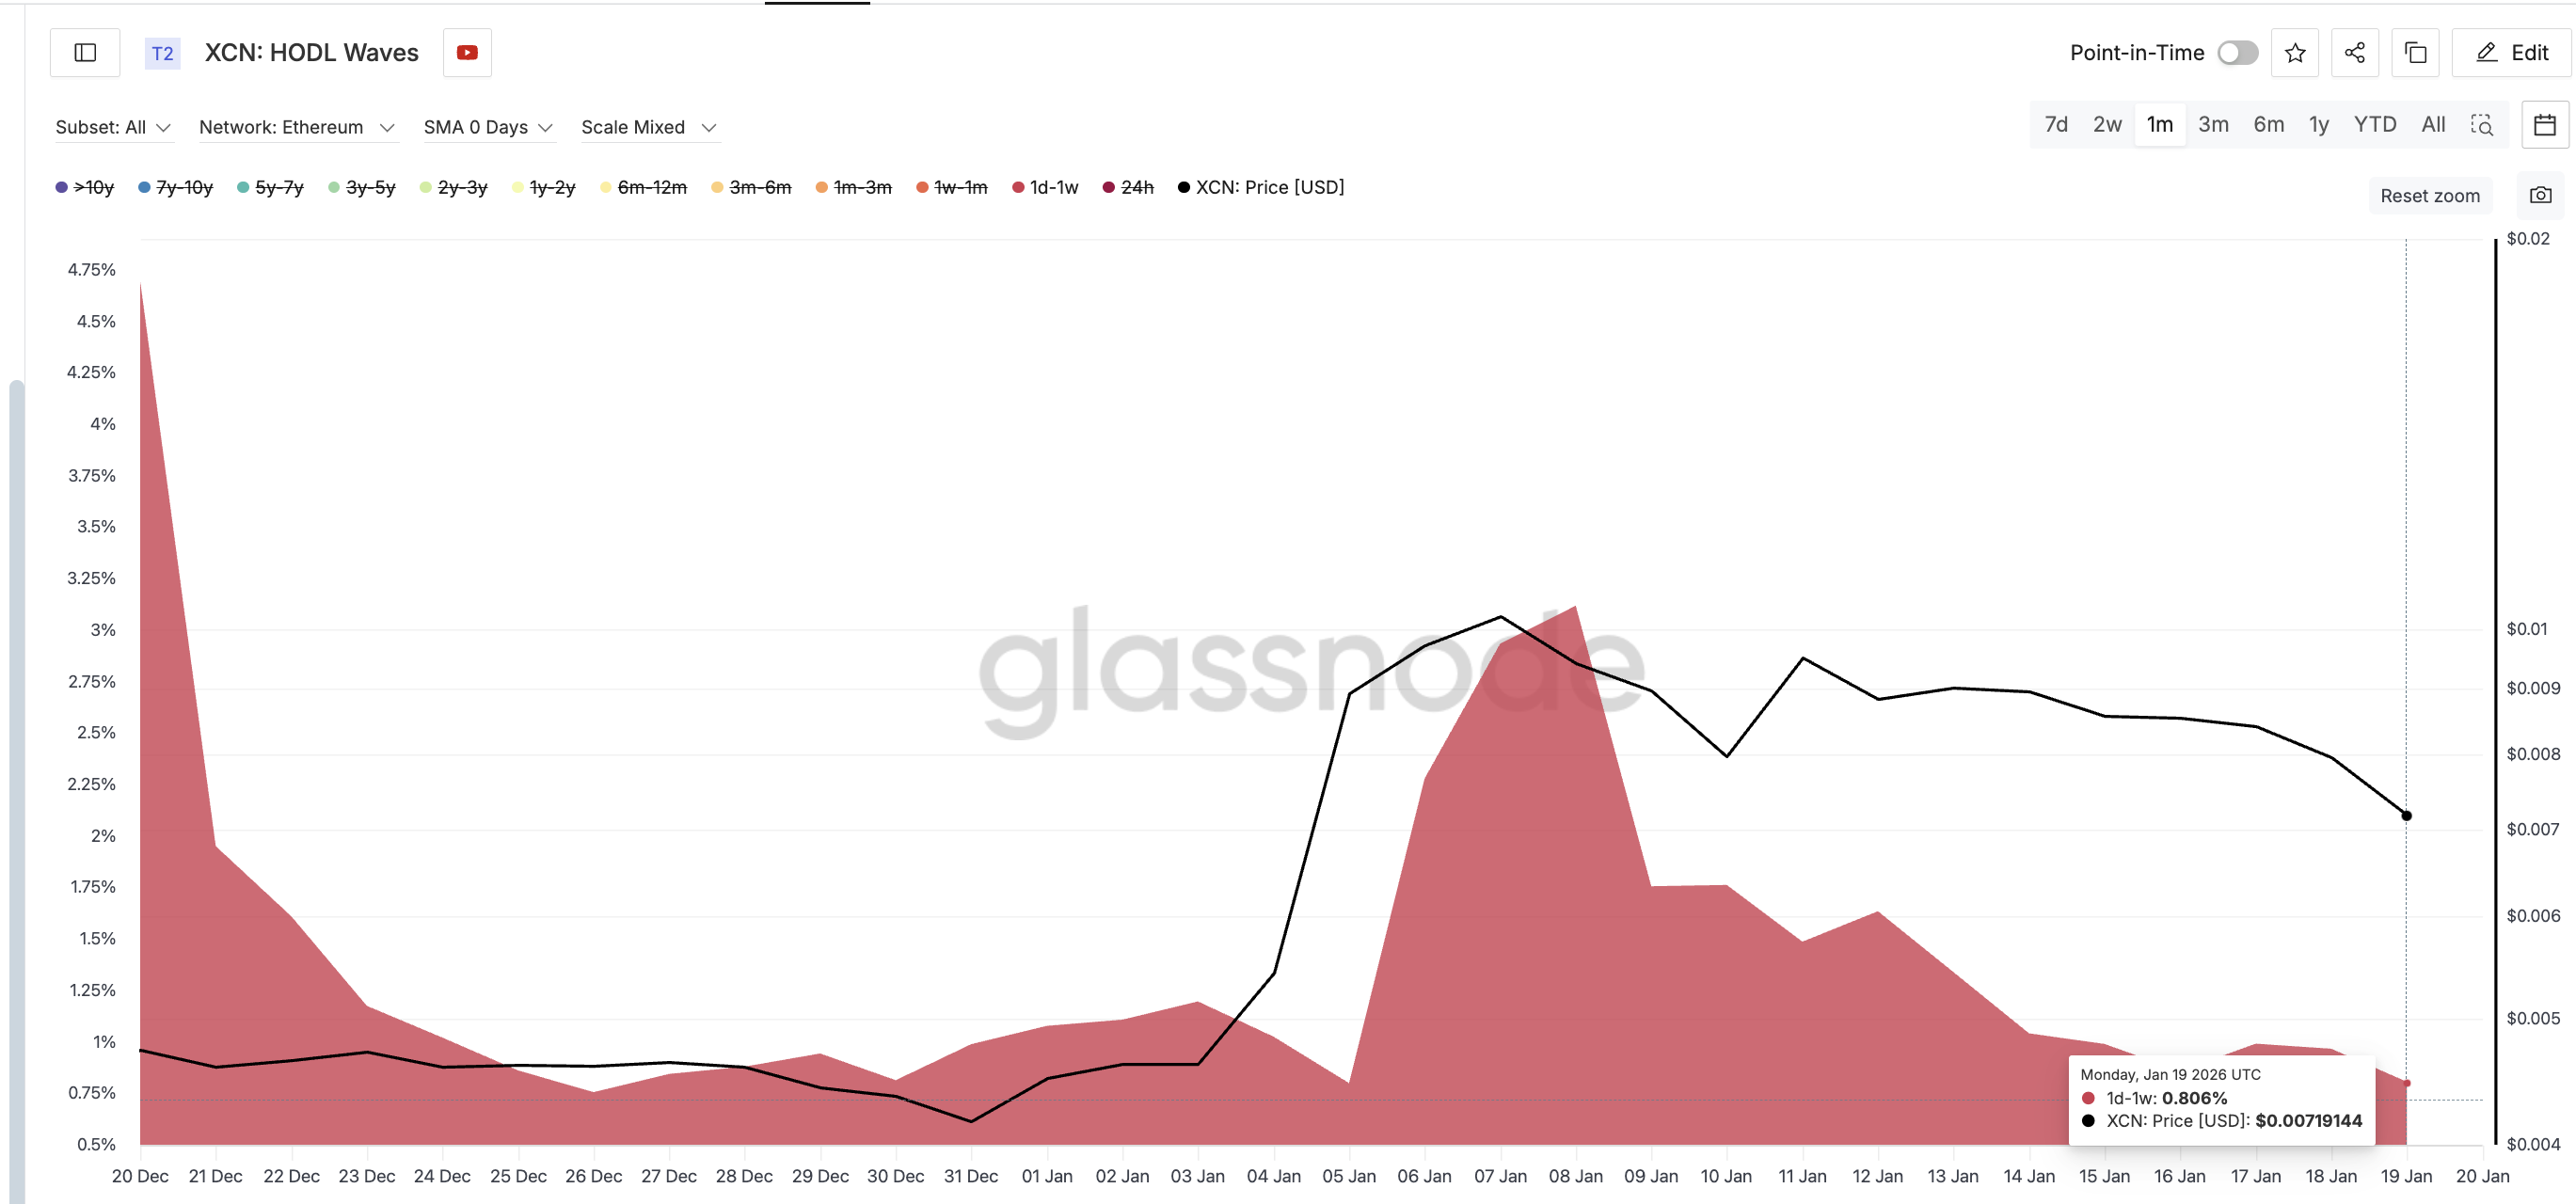
That represents an 85% reduction in speculative supply.
This type of exit usually occurs late in a correction, not early. These holders tend to chase momentum and exit aggressively during drawdowns, booking whatever profits they can muster. Once they are gone, forced selling pressure often dries up quickly.
At the same time, longer-term holders are moving the other way. Wallets holding XCN for 6 to 12 months increased their share of supply from 6.81% to 8.03% between December 20 and January 19.
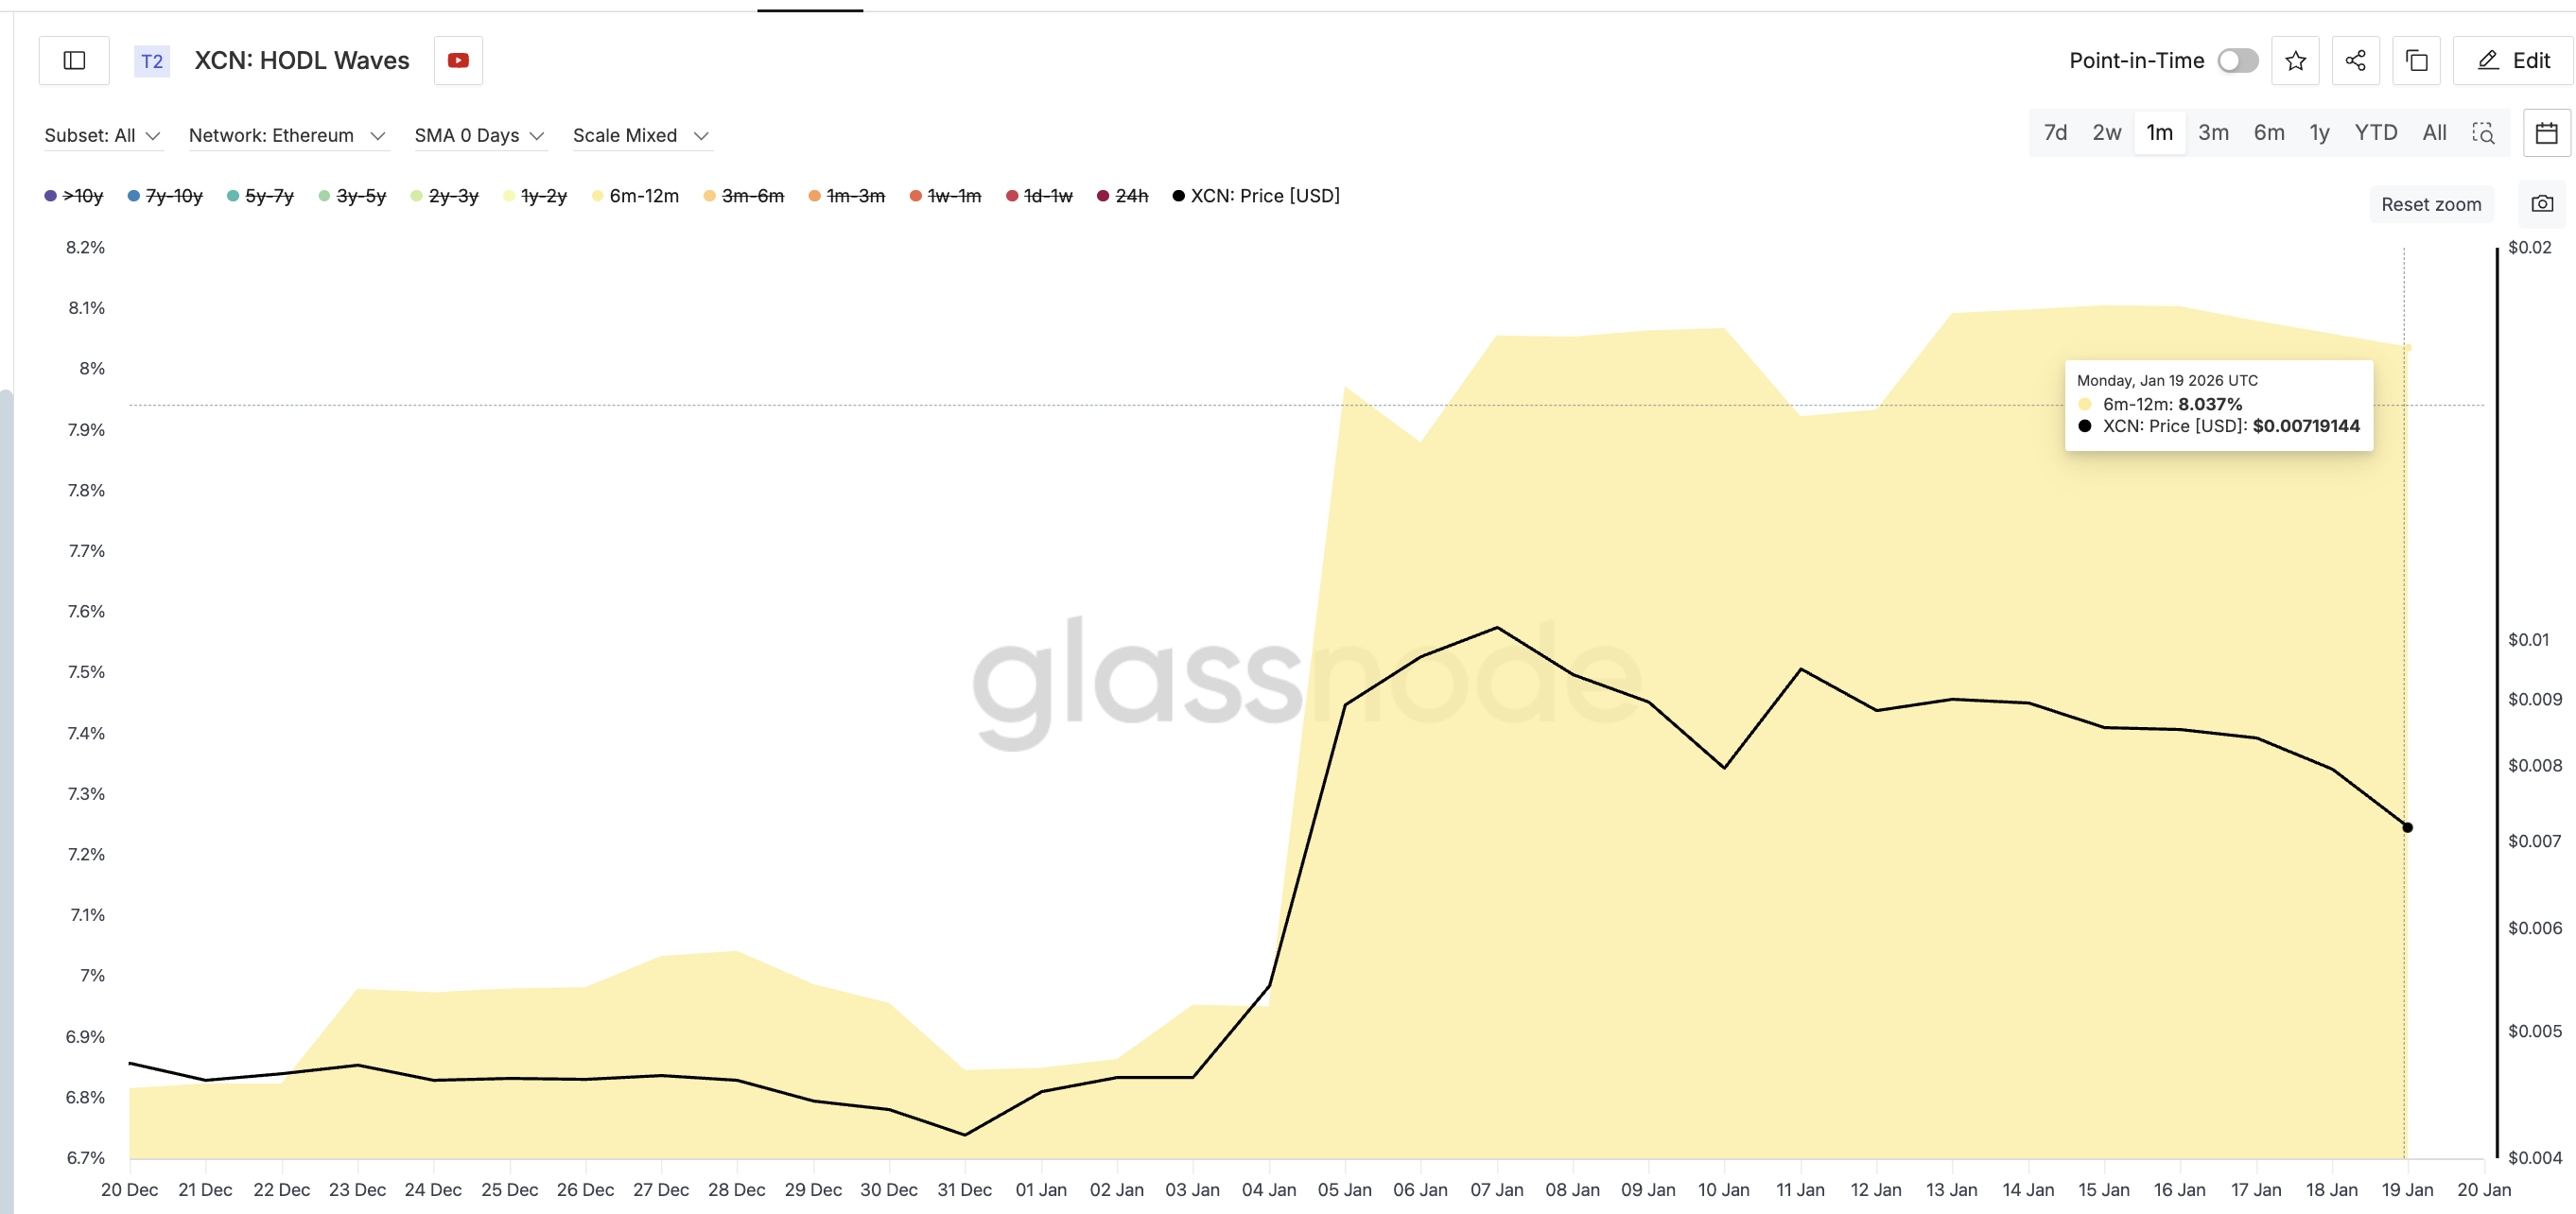
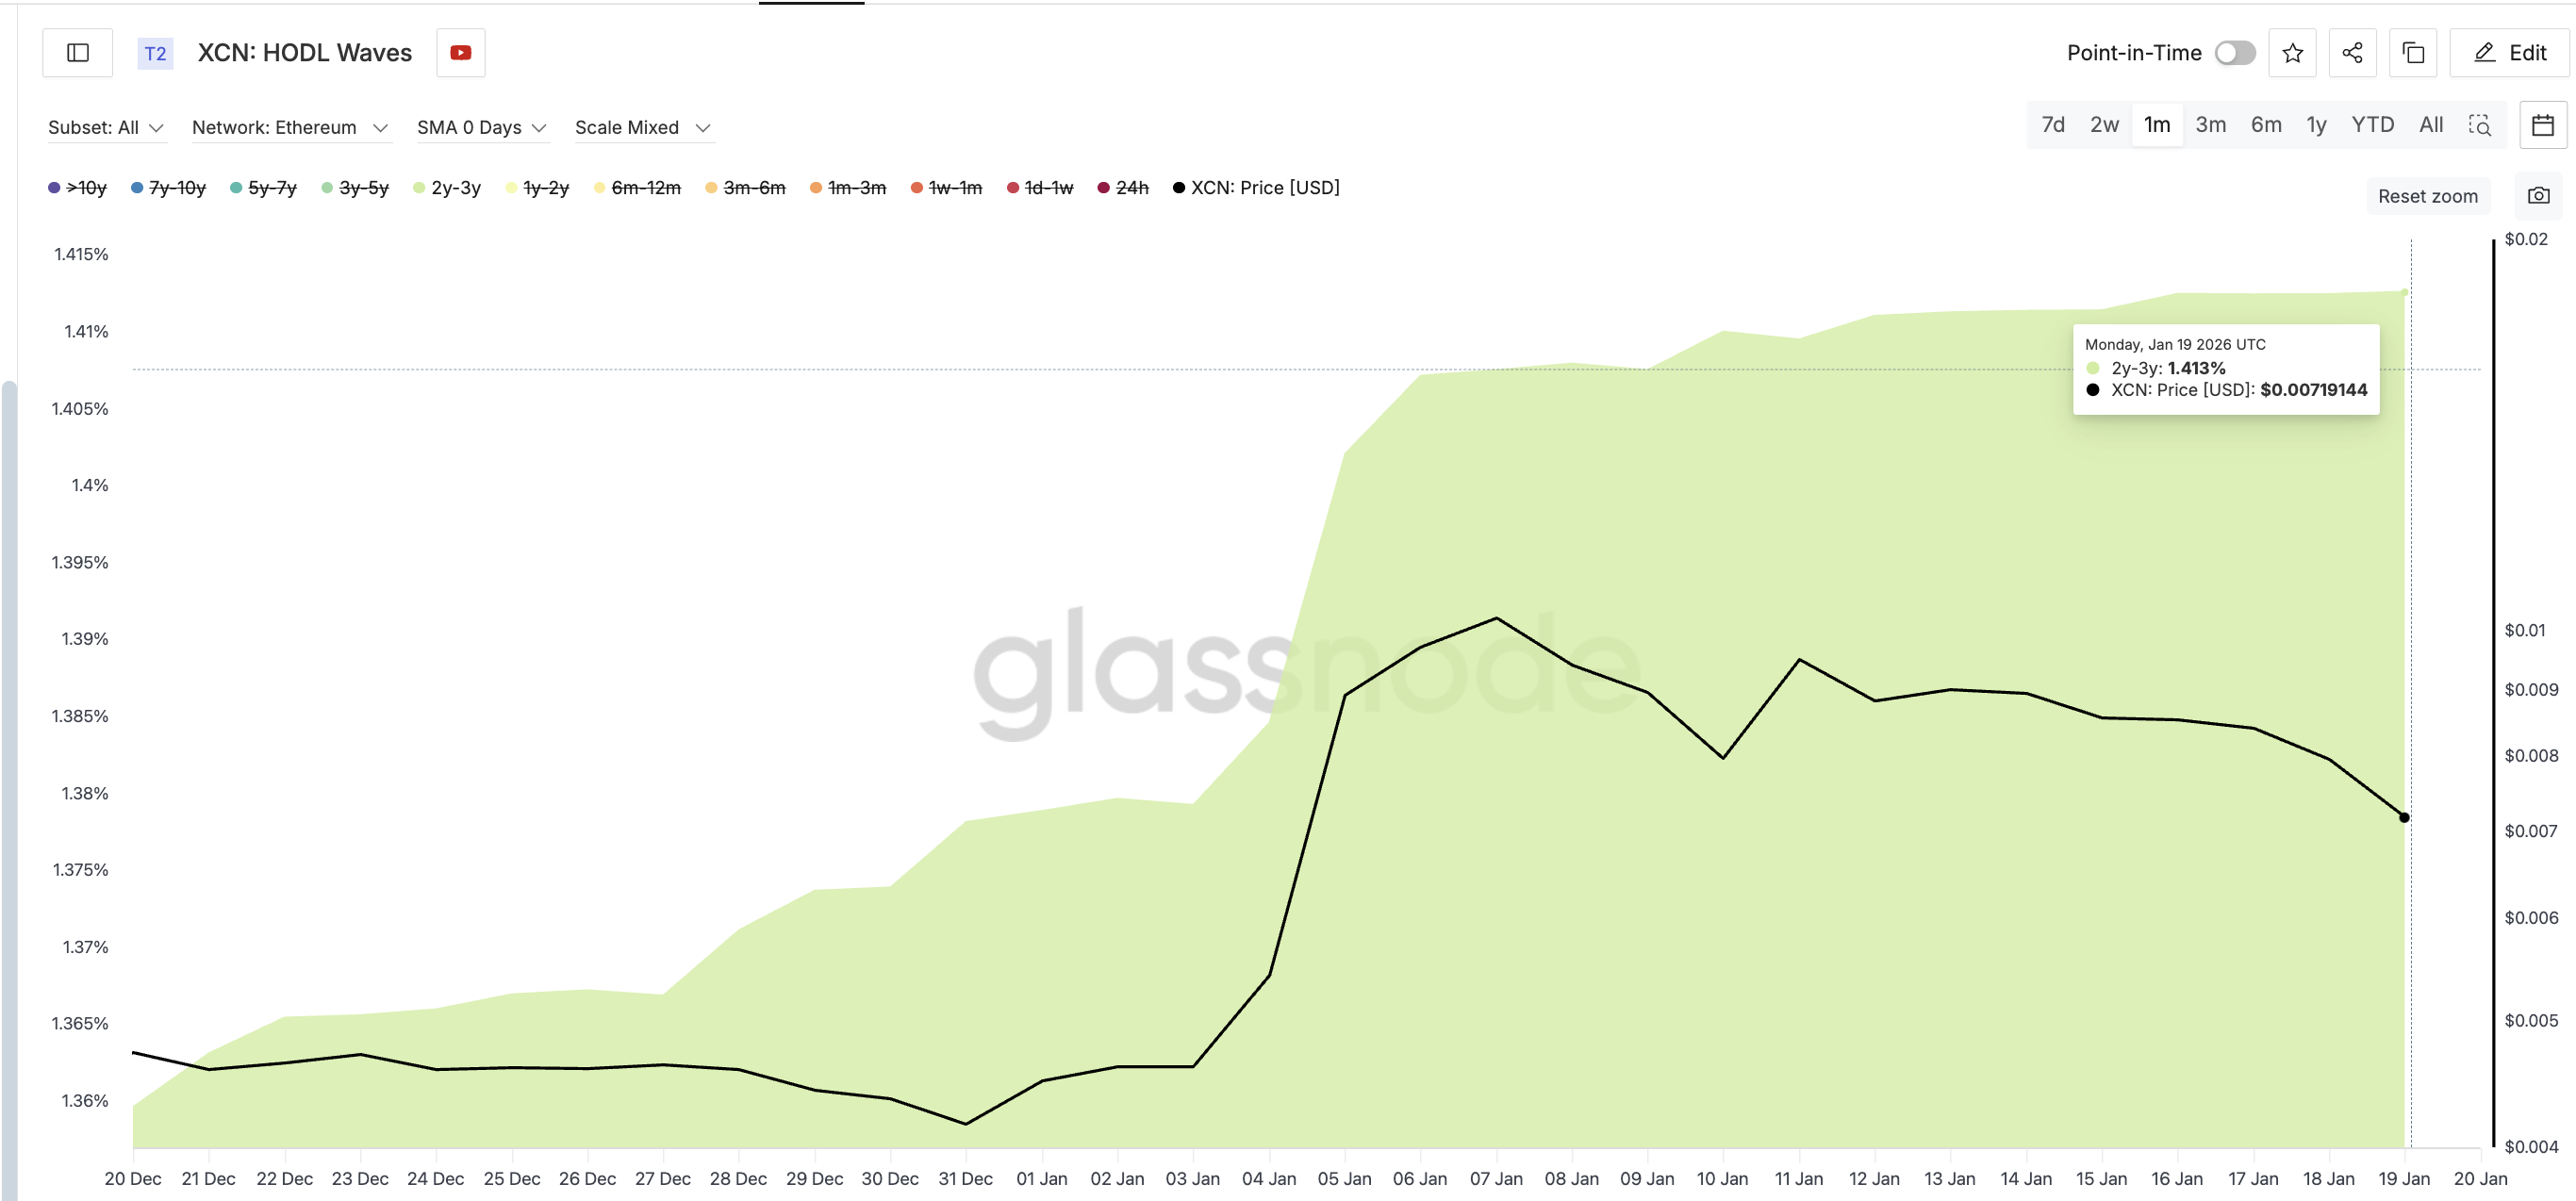
Even the oldest cohorts, 2-3y, posted modest increases. These holders typically add during weakness rather than strength and tend to sell much more slowly.
This rotation matters. Supply is moving from reactive traders to conviction holders. That does not guarantee an immediate rally, but it significantly reduces the risk of another sharp dip.
In short, the dump may already have done its job.
XCN Price Levels That Decide Whether the Correction Is Ending
With speculative supply flushed and momentum stabilizing, price levels now decide what comes next.
The first area to watch is $0.0067. Holding above this level allows the RSI divergence to confirm and signals that buyers are willing to defend higher lows. If price slips below that, $0.0060 becomes the critical line. This level aligns with the lower edge of the cost basis cluster and represents the point where downside risk starts to compress.
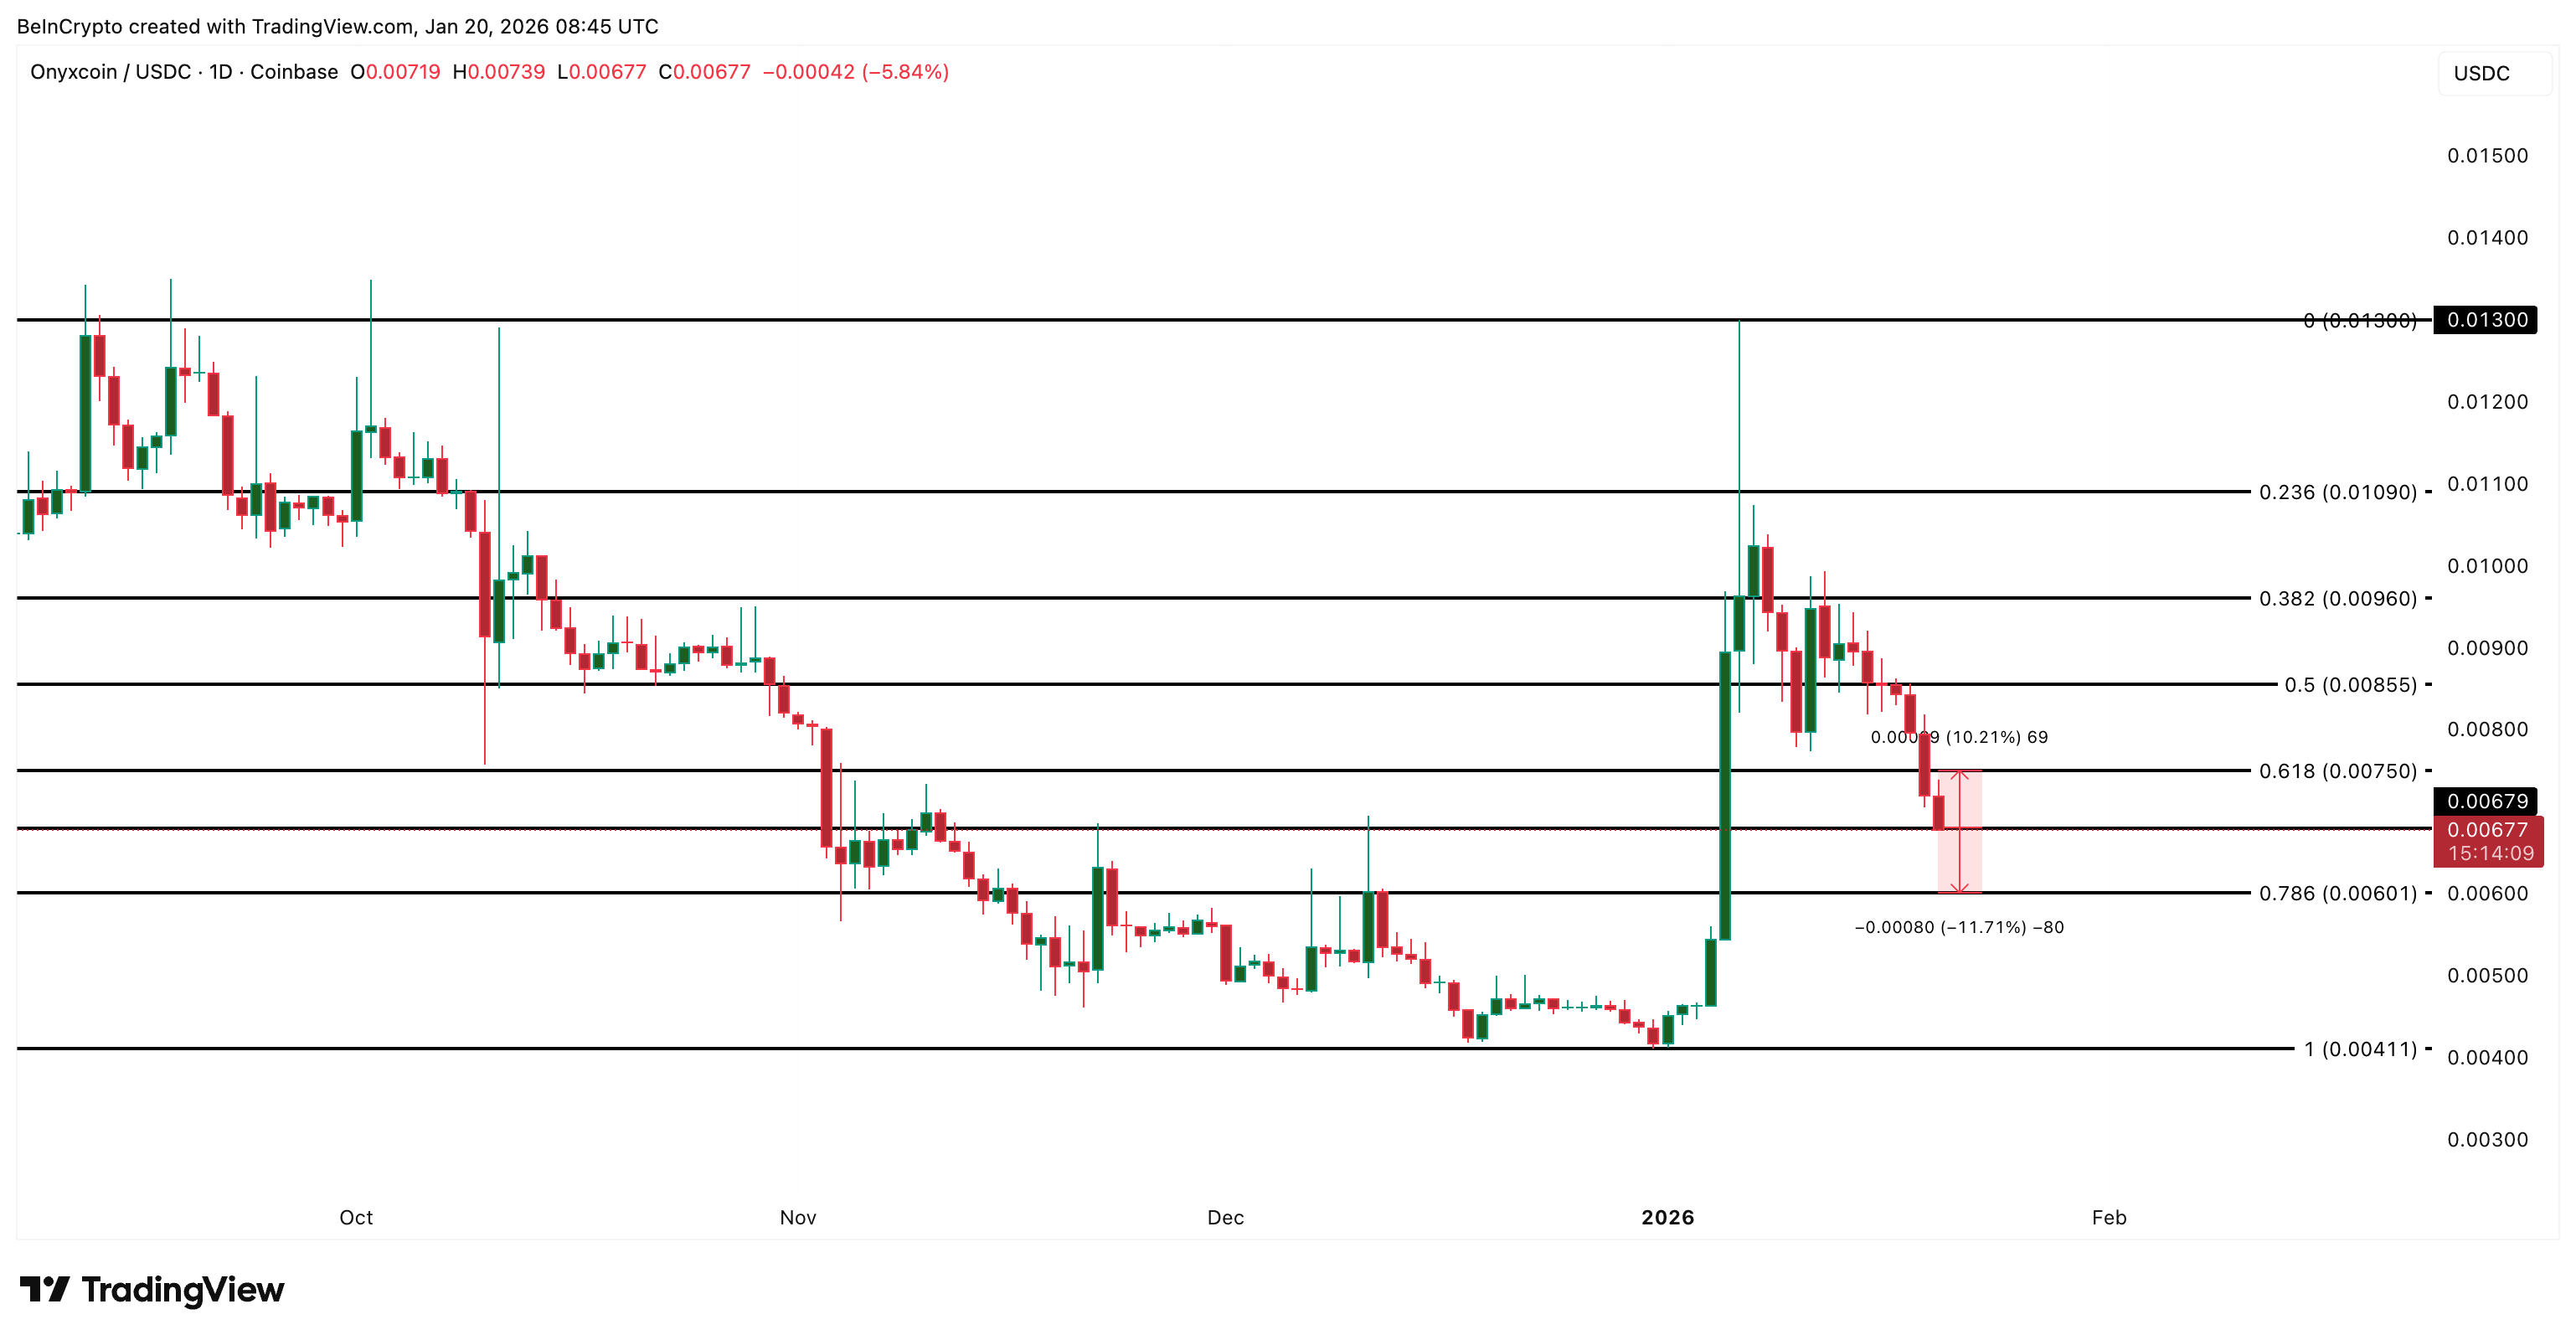
On the upside, the first meaningful test sits near $0.0075. Clearing that zone would mark a rebound of roughly 10% and suggest buyers are stepping back in with intent. A broader bullish shift only appears if XCN can reclaim $0.0096, the level lost in early January that has capped every bounce since.
Until that happens, rallies remain corrective rather than trend-changing.
The post Onyxcoin Holders Exit in Size — How an 85% Supply Dump Could Help XCN Price appeared first on BeInCrypto.