
Monero (XMR) is trading at $359.55, down 0.61% on the day, holding inside an ascending channel but unable to break the descending trendline that has capped every rally since January.
Two money flow indicators are sending conflicting signals, leaving traders caught between a bearish breakdown setup and a potential reversal.
Mixed Signals Suggest Weak Conviction From XMR Holders
The Chaikin Money Flow (CMF) currently reads -0.18, its lowest reading since the chart’s start in late February. The indicator peaked at approximately +0.16 on February 25, then began a consistent series of lower highs and lower lows.
A descending trendline drawn directly on the CMF shows that XMR’s netflow deterioration has been steady and deliberate. The indicator crossed below zero around March 5 and has not returned above it since.
Want more token insights like this? Sign up for Editor Harsh Notariya’s Daily Crypto Newsletter here.
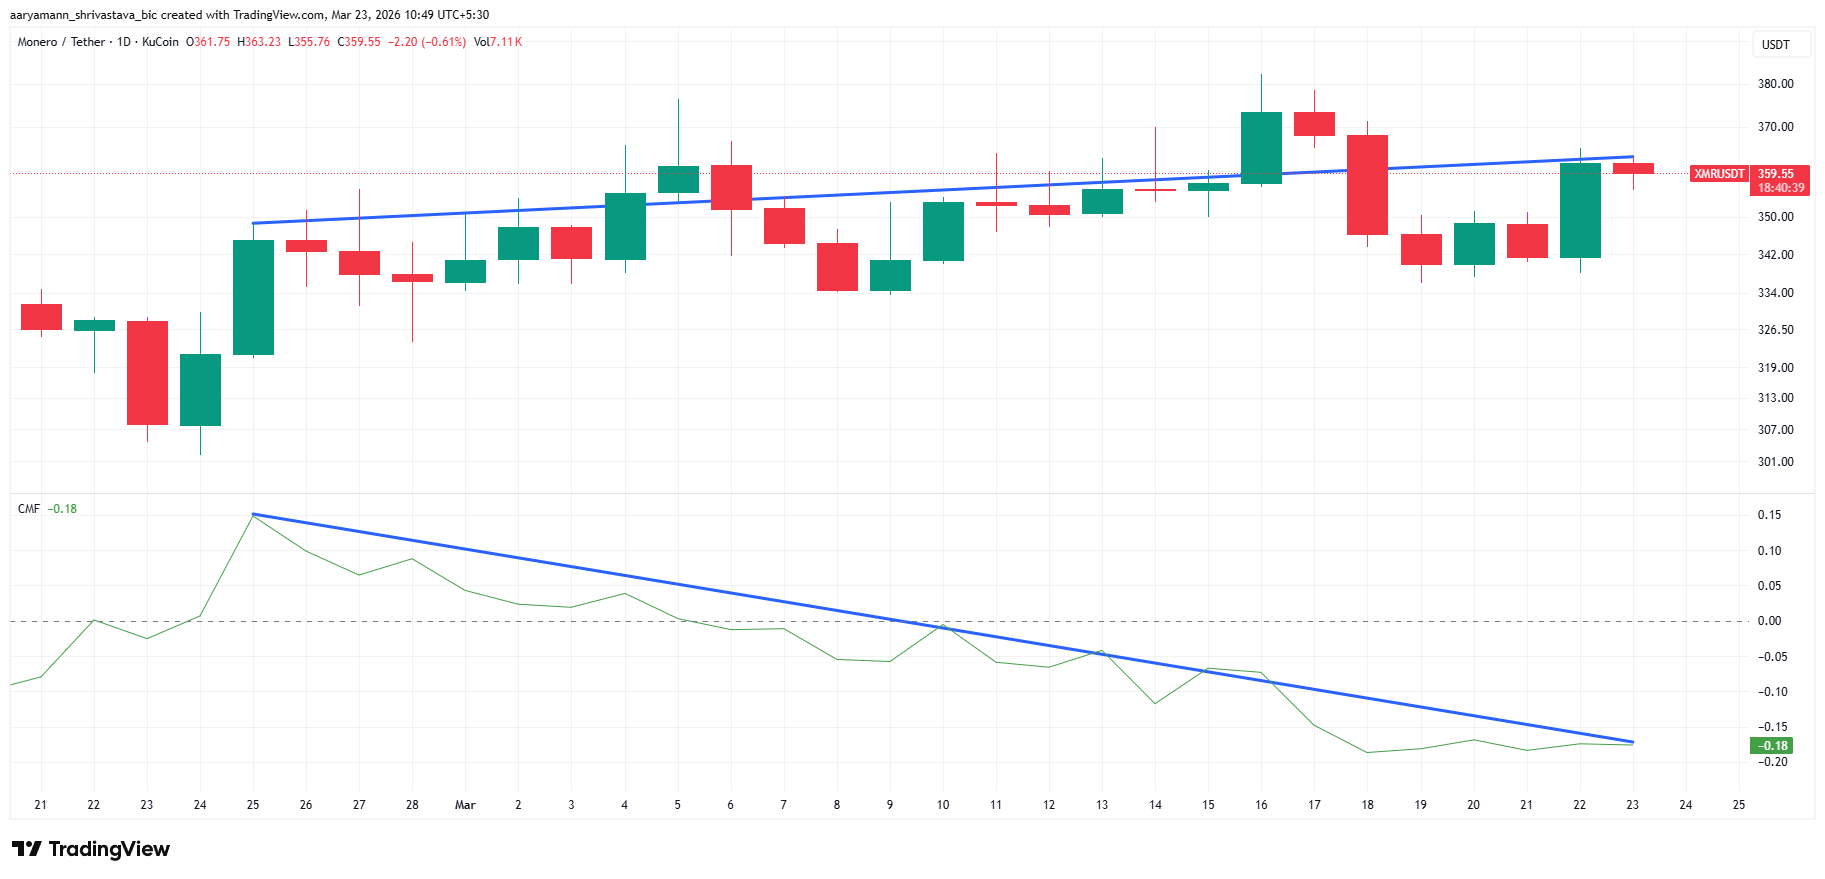
A CMF at -0.18 signals that volume-weighted selling pressure is substantial. For this reading to reverse, buyers would need to close multiple consecutive candles in the upper half of their daily range — something price has struggled to do under the descending trendline resistance near $370.
Despite the bearish CMF reading, the Money Flow Index (MFI) tells a different story. Since late January, price has been making lower highs while the MFI has been making higher lows — a textbook bullish divergence.
The MFI currently sits at 58.61, in neutral territory. The ascending trendline drawn on the indicator has held through multiple XMR price dips, including the tests near $305–$310 in early February.
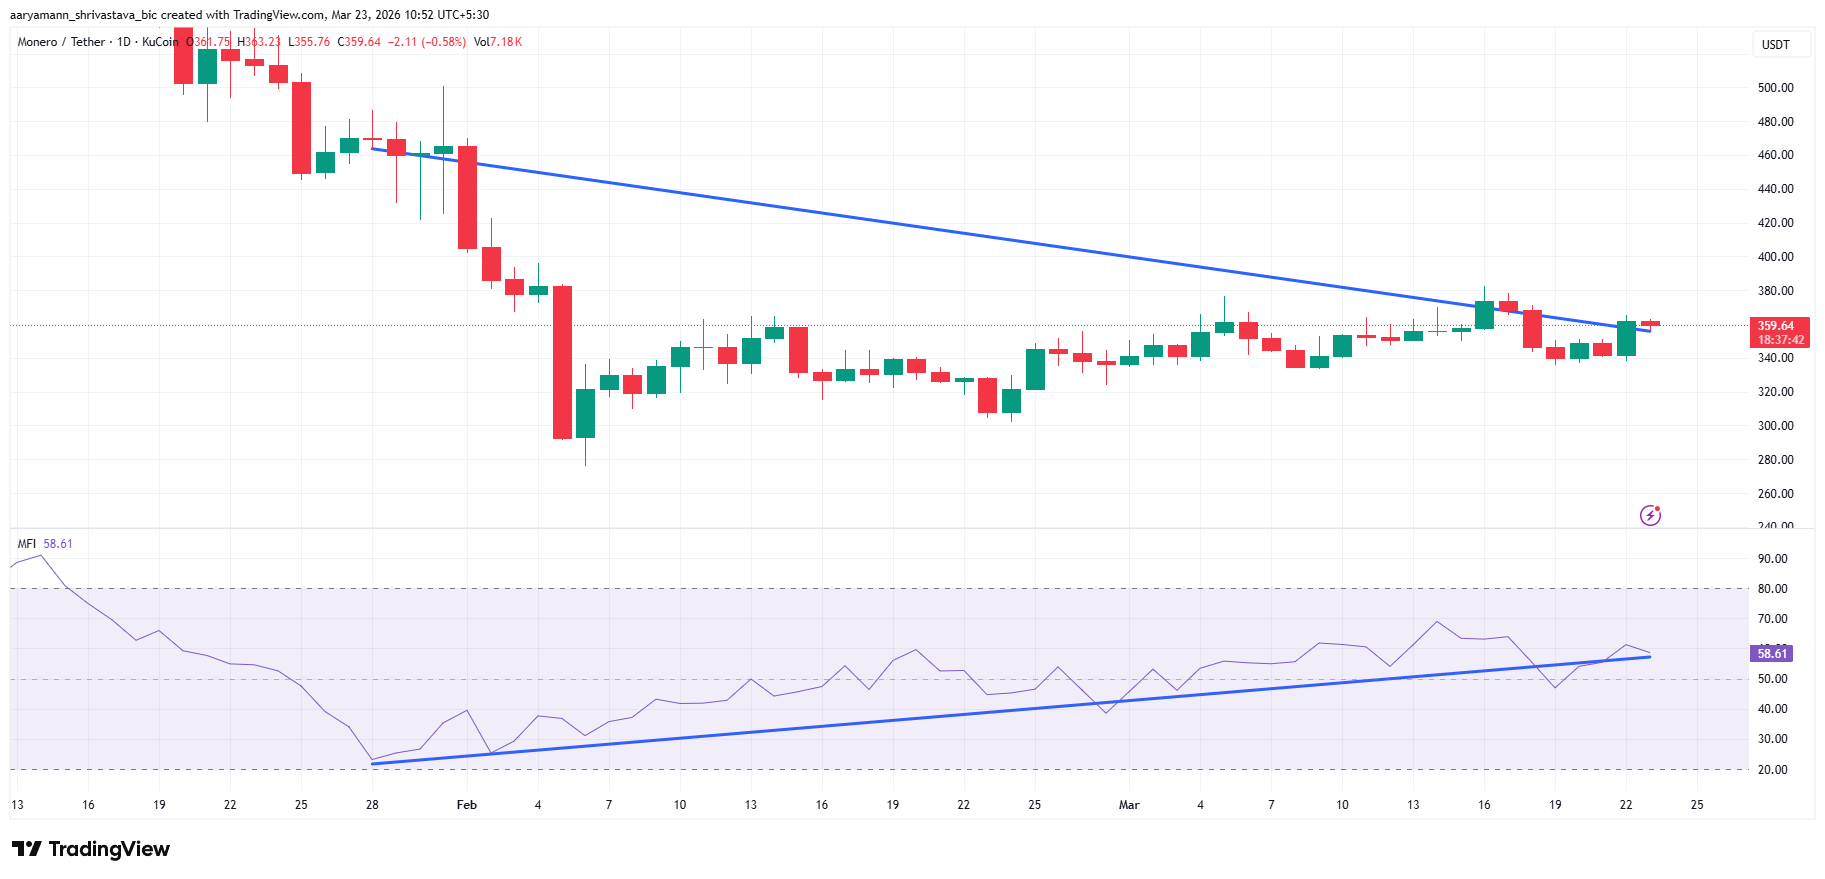
However, divergences are warning signals, not entry signals. The MFI has been building this pattern for nearly two months without triggering a sustained price reversal. A break of the MFI trendline below the 40 level would erase the divergence and confirm the CMF’s bearish reading.
XMR Price May Still Break Down
The 2-day chart shows XMR price trading within an ascending channel, currently near the upper band resistance around $372–$375. The Fibonacci 1.236 extension at $355.94 and the 1.5 level at $372.95 frame the current price on either side.
A measured move of -16.08% is annotated on the chart from the current range, projecting a target near $279.69 — close to the Fibonacci 0 level at $276.28. The descending trendline from the daily chart currently sits near $370 and has rejected every breakout attempt since January.
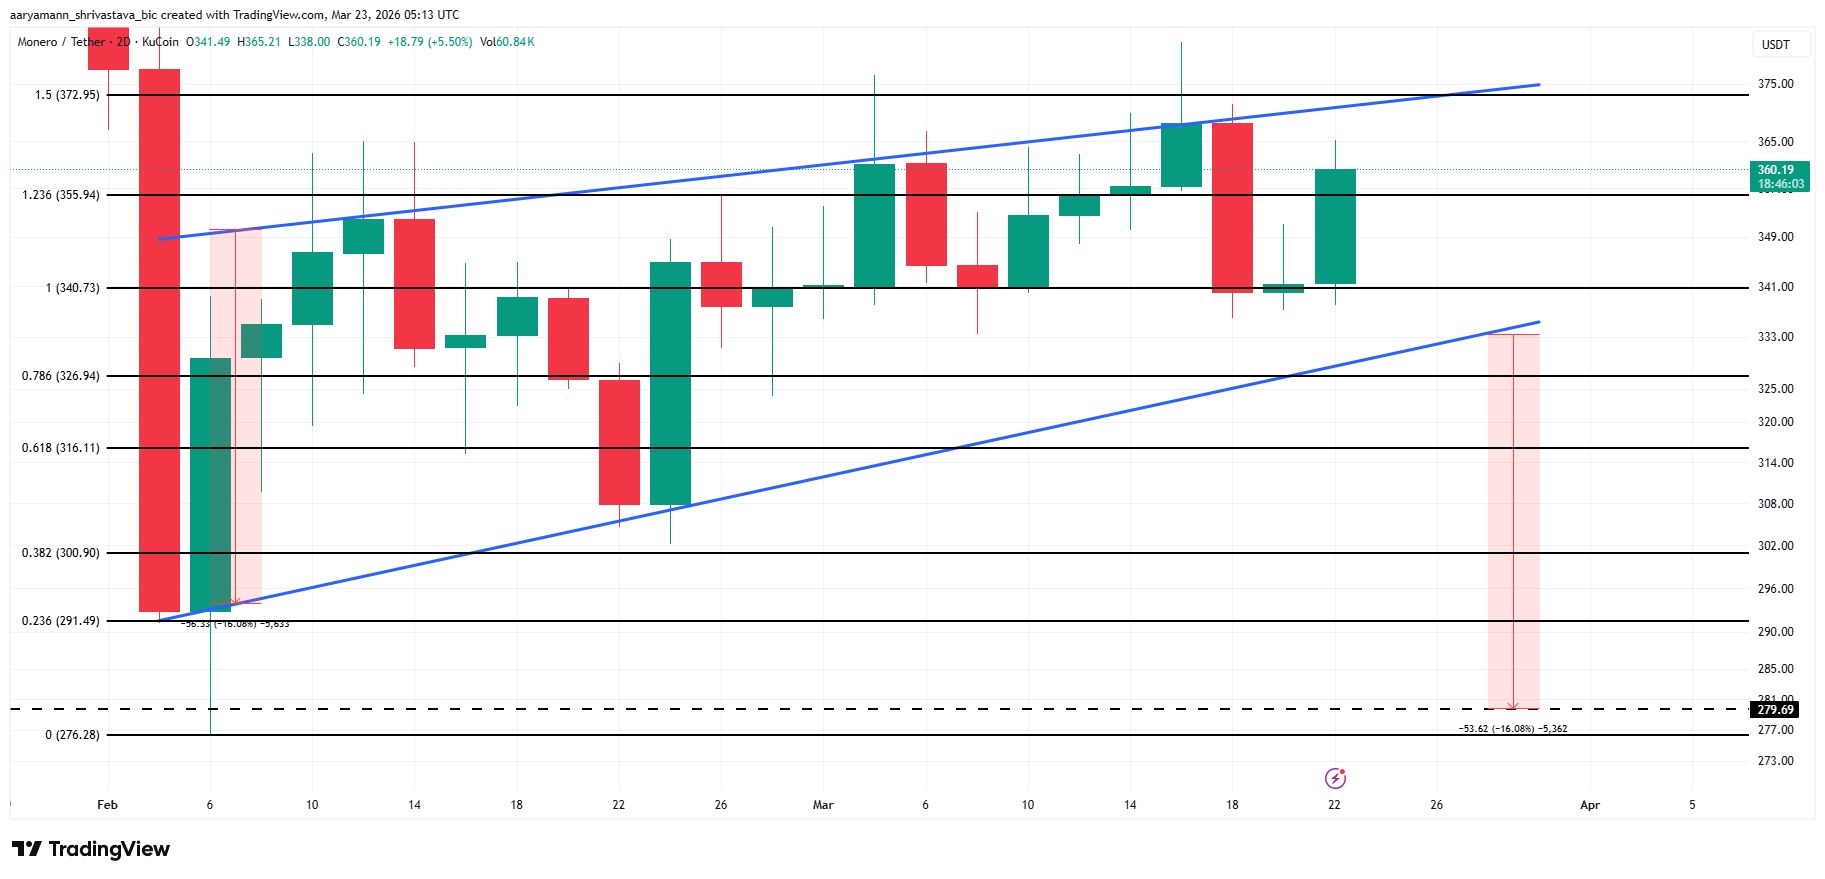
The critical support level is the ascending channel’s lower boundary, currently near $332. A daily close below that line would activate the 16.08% measured move toward $279. The $316 Fibonacci 0.618 level would offer an intermediate buffer.
To invalidate the bearish setup, XMR would need a confirmed daily close above the descending trendline near $370. The recent launch of a new native Monero iOS wallet with privacy features could attract fresh buyers, but a trendline break with volume is required before that fundamental narrative can drive sustained price recovery.
The post Monero (XMR) Price’s 16% Breakdown Still Likely Due To Indecisive Investors appeared first on BeInCrypto.