XRP is trading at $1.38, pressing directly against the ascending blue trendline support on the daily chart. The double top pattern formed between February and March now hangs over the price.
Two on-chain signals provide the context for what happens next. Holder behavior is the deciding factor.
XRP Holders’ Buying Pressure Comes Down
The Glassnode exchange net position change chart covers March 1 through March 26. With the exception of a single large green bar near March 5 registering approximately 40 million XRP in inflows, every other day in the period shows red bars — net outflows from all exchanges combined.
The largest outflow bars fall between March 7 and March 17, with several days exceeding 80 million to 140 million XRP leaving exchanges in a single session. Even after that peak, the outflows have continued consistently through March 25, with daily red bars in the 20 million to 40 million XRP range.
Want more token insights like this? Sign up for Editor Harsh Notariya’s Daily Crypto Newsletter here.
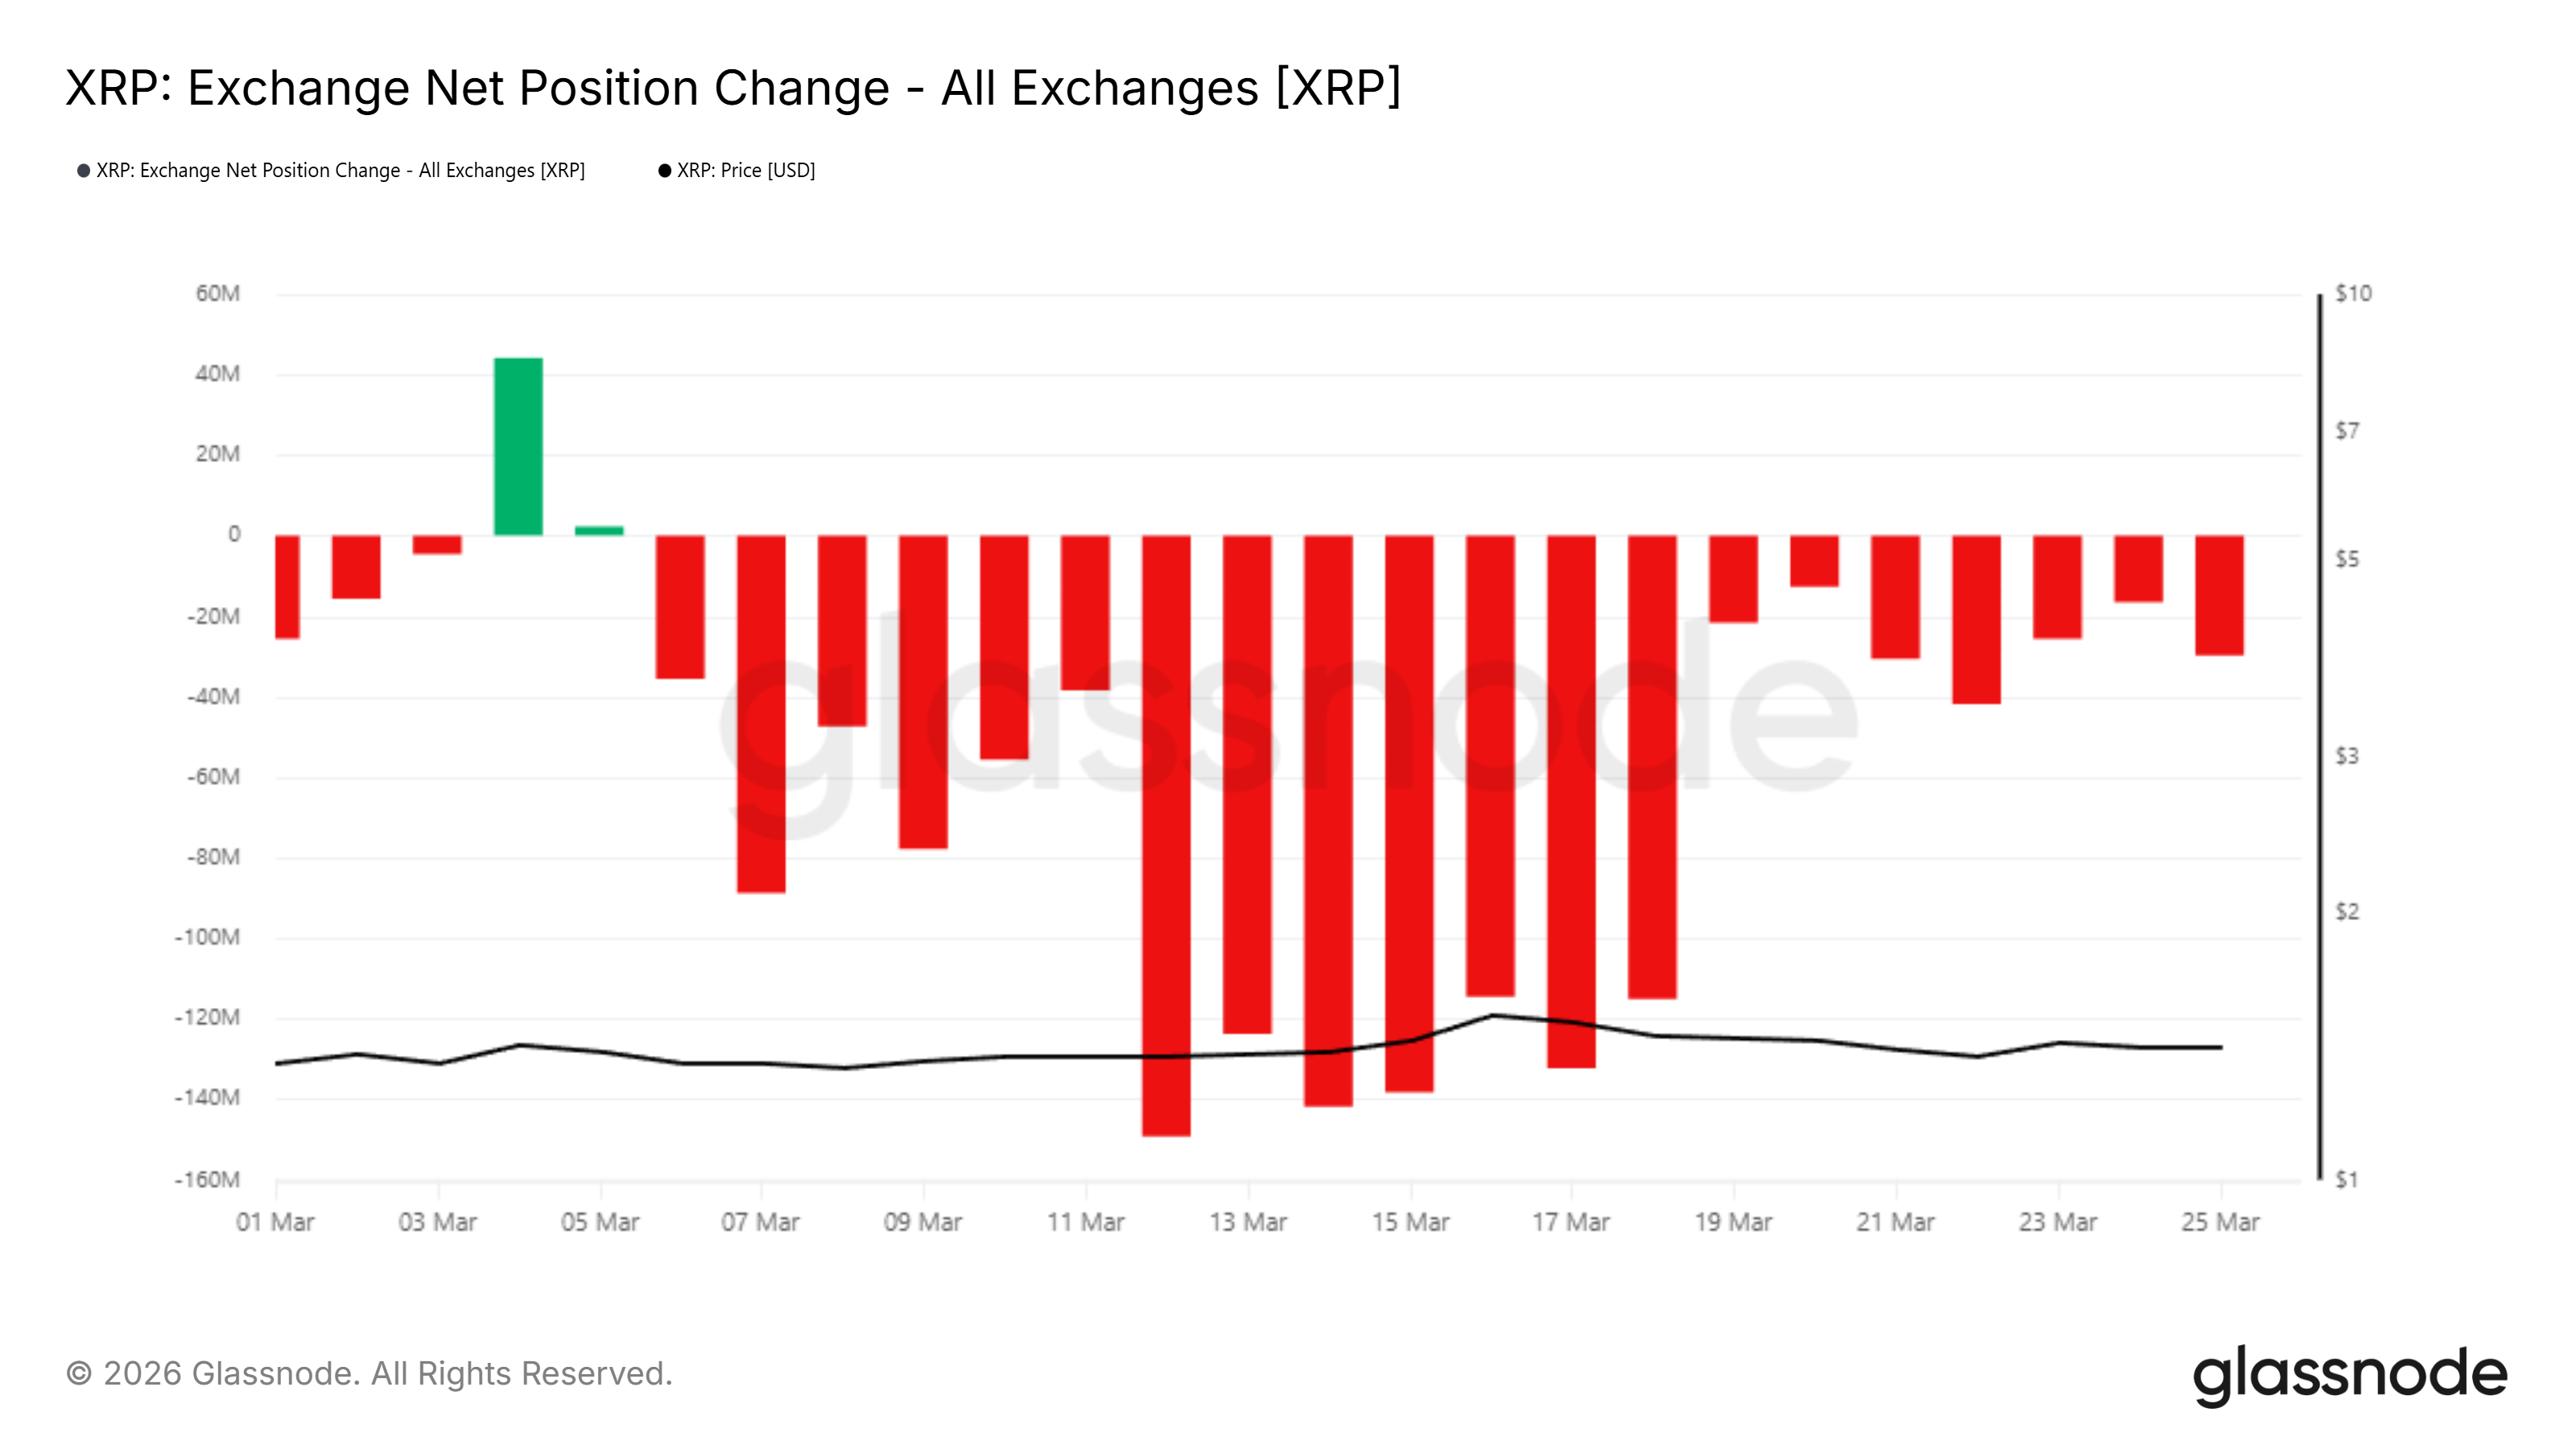
XRP leaving exchanges is slowing down, but the presence of buying pressure is a positive. Going forward, if this momentum is maintained, the XRP price will be able to prevent a decline.
MVRV Signals Holders Are Underwater
The MVRV Ratio chart spans July 2024 through March 2026. The green shaded zones mark periods where MVRV dropped below 1.0, meaning the market value of XRP fell below the average cost basis of all holders. Those periods have historically marked accumulation floors rather than breakdown points.
XRP’s MVRV ratio has been in green territory since late February 2026, with the ratio currently near 1.0 and the market price converging with the realized price (orange line) around the $1.40 level.
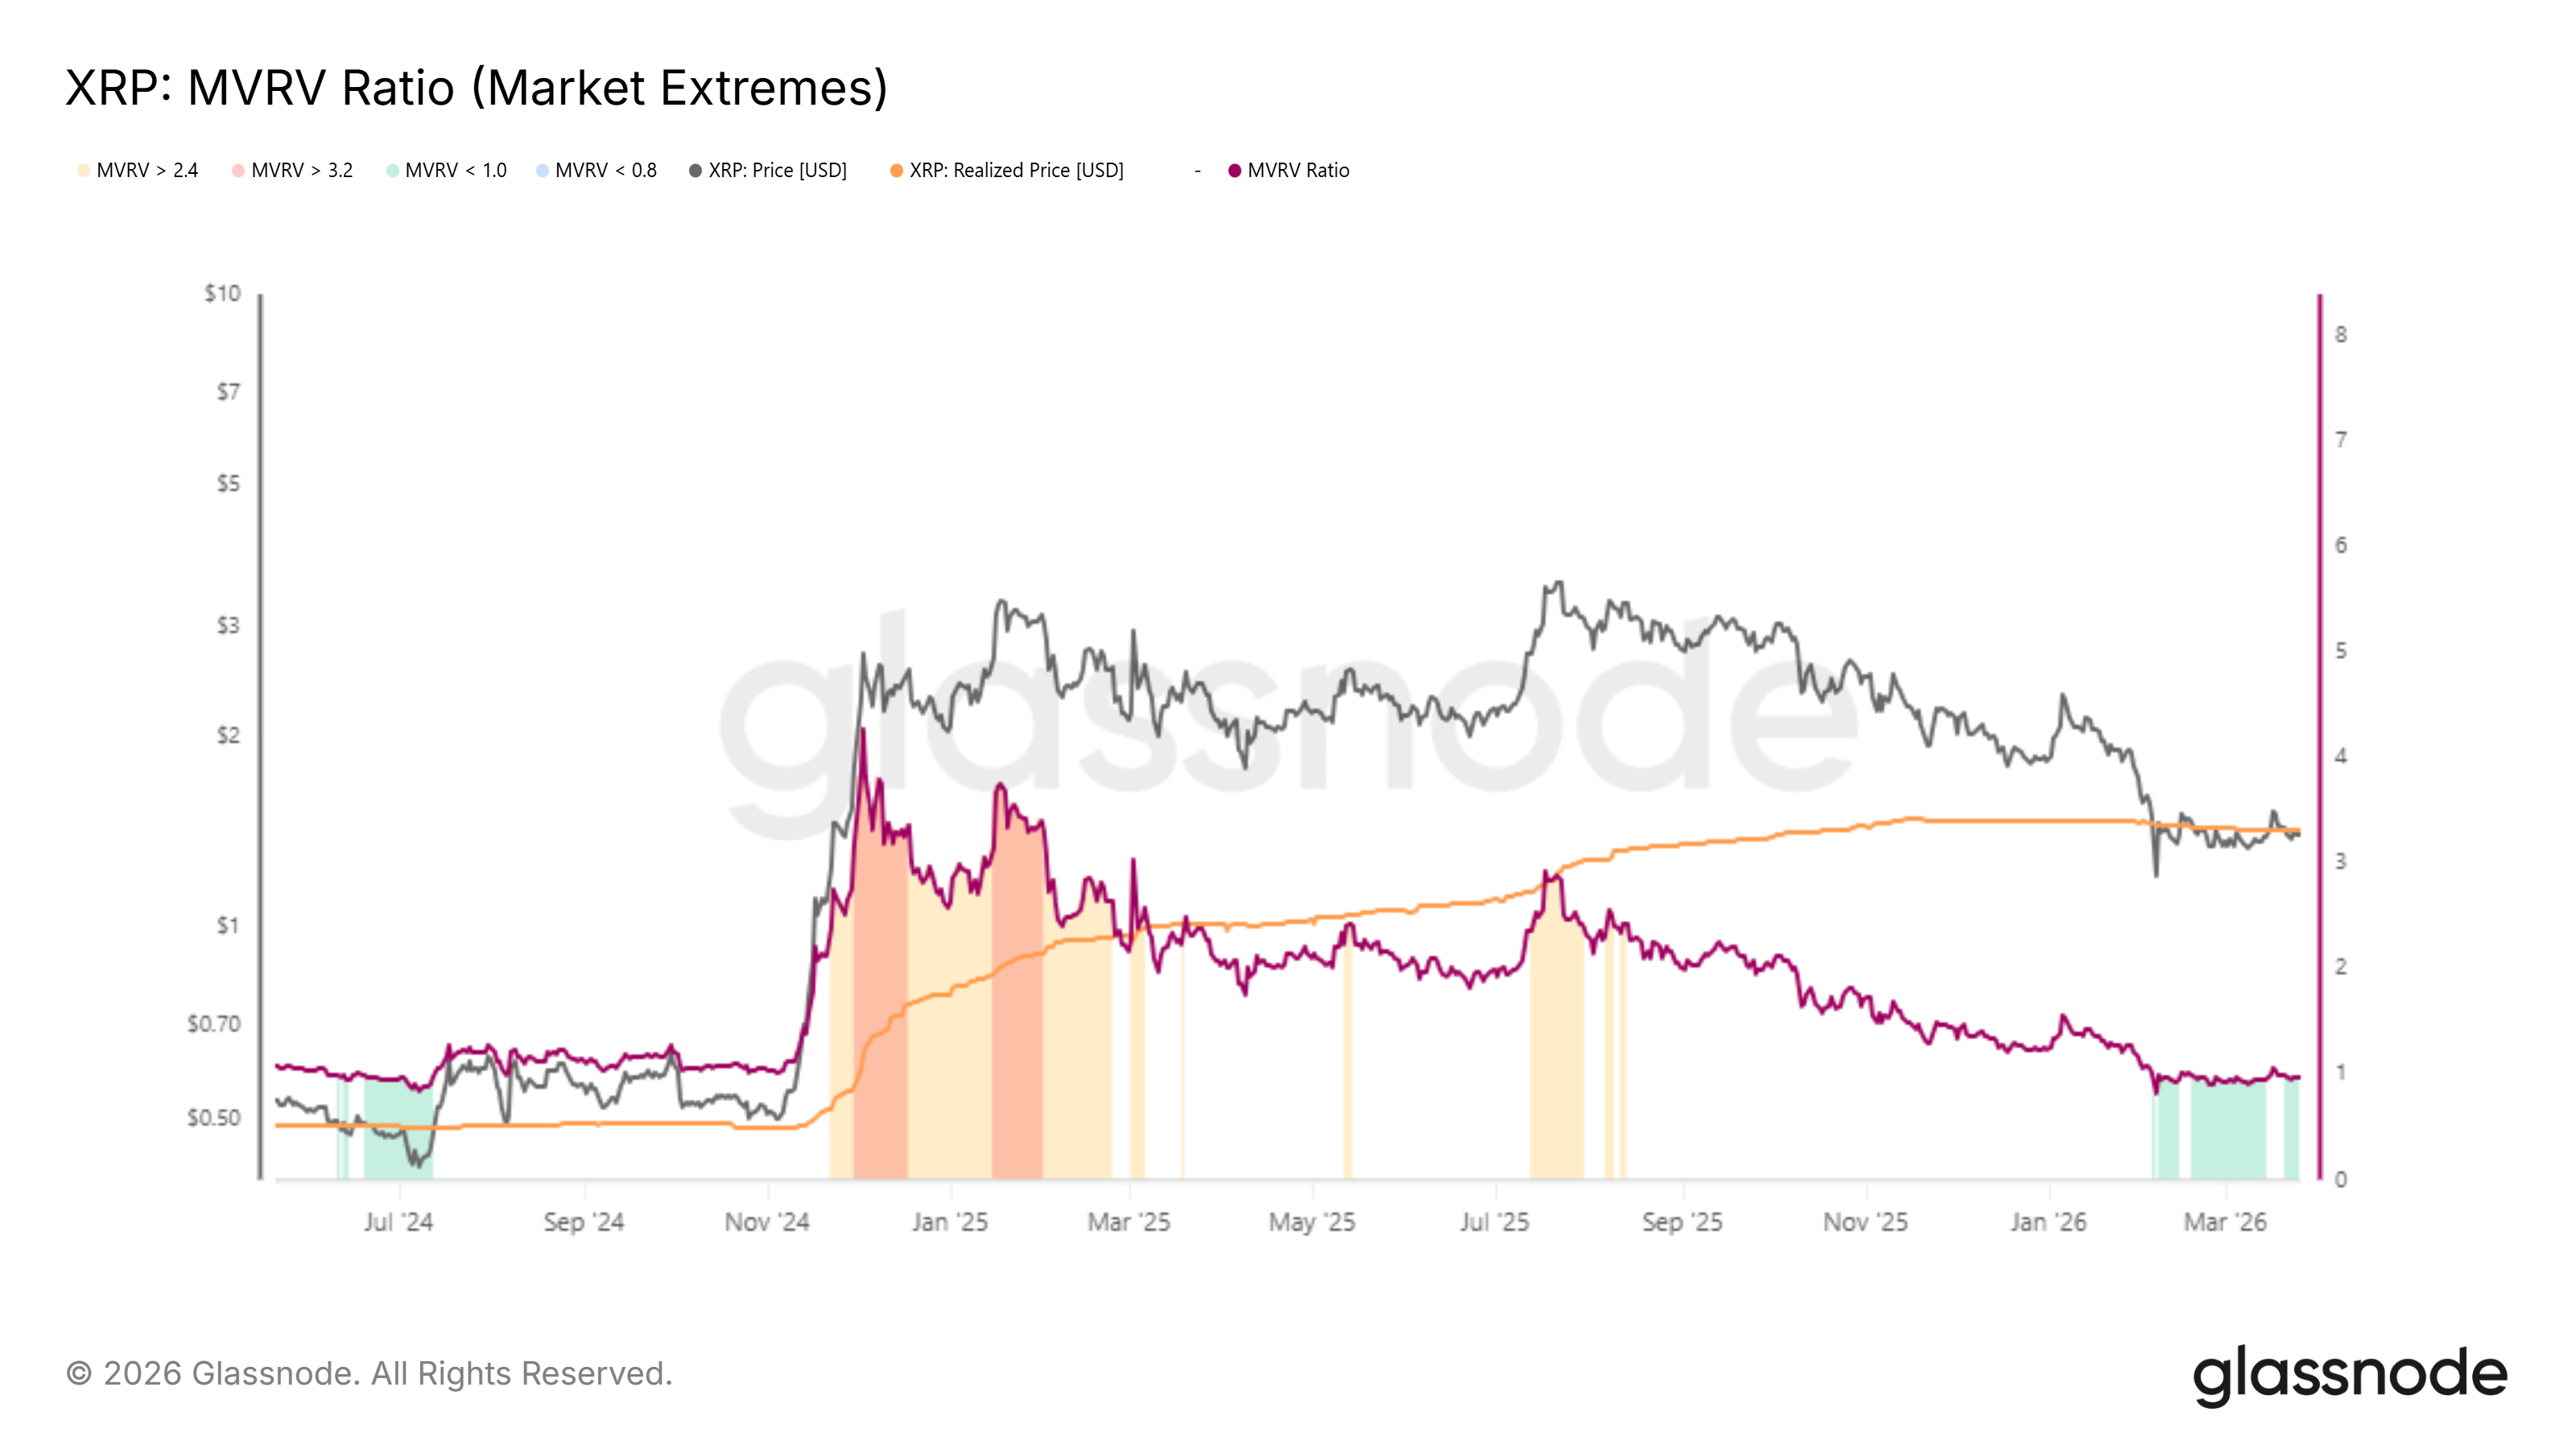
Every prior green zone on this chart — July 2024 and the brief dip in early 2026 — was followed by a recovery. The current MVRV reading places XRP in the same category of historical undervaluation that preceded prior rebounds.
XRP Price Double Top Presents Threat
XRP price sits at $1.38. The altcoin is inching closer to the ascending trendline that has provided support since the February 5 open at $1.21. The double top pattern — with peaks at $1.69 and $1.58 — has its neckline above $1.33. A daily close below that level completes the pattern and projects a measured downward move.
The immediate support is $1.33. Holding that level keeps the trendline intact and preserves the possibility of XRP price recovery toward $1.43 and then $1.51. The MVRV undervaluation and persistent exchange outflows both argue that holders are not capitulating at current prices. This is the one factor that could prevent the neckline from being tested.
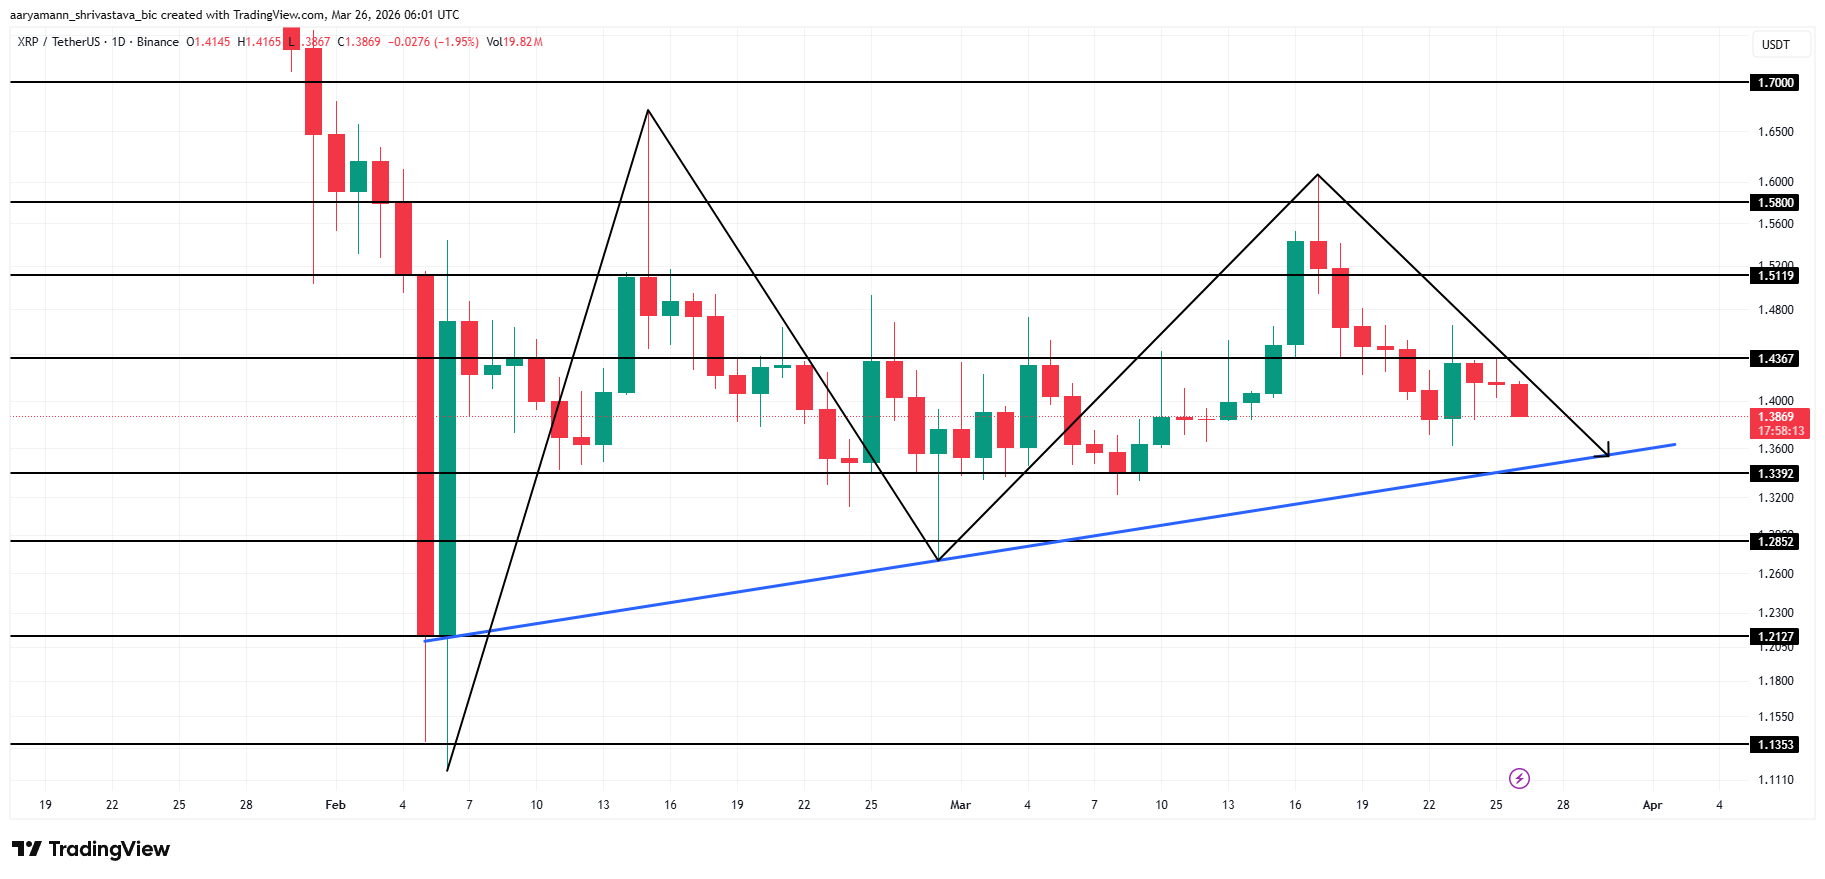
A daily close above $1.51 would break the lower-high structure of the double top entirely and invalidate the bearish pattern. Below $1.33, $1.21 becomes the final support before the breakdown comes into play.
The post 140 Million XRP Left Exchanges in a Day, Yet The Price Kept Falling appeared first on BeInCrypto.