
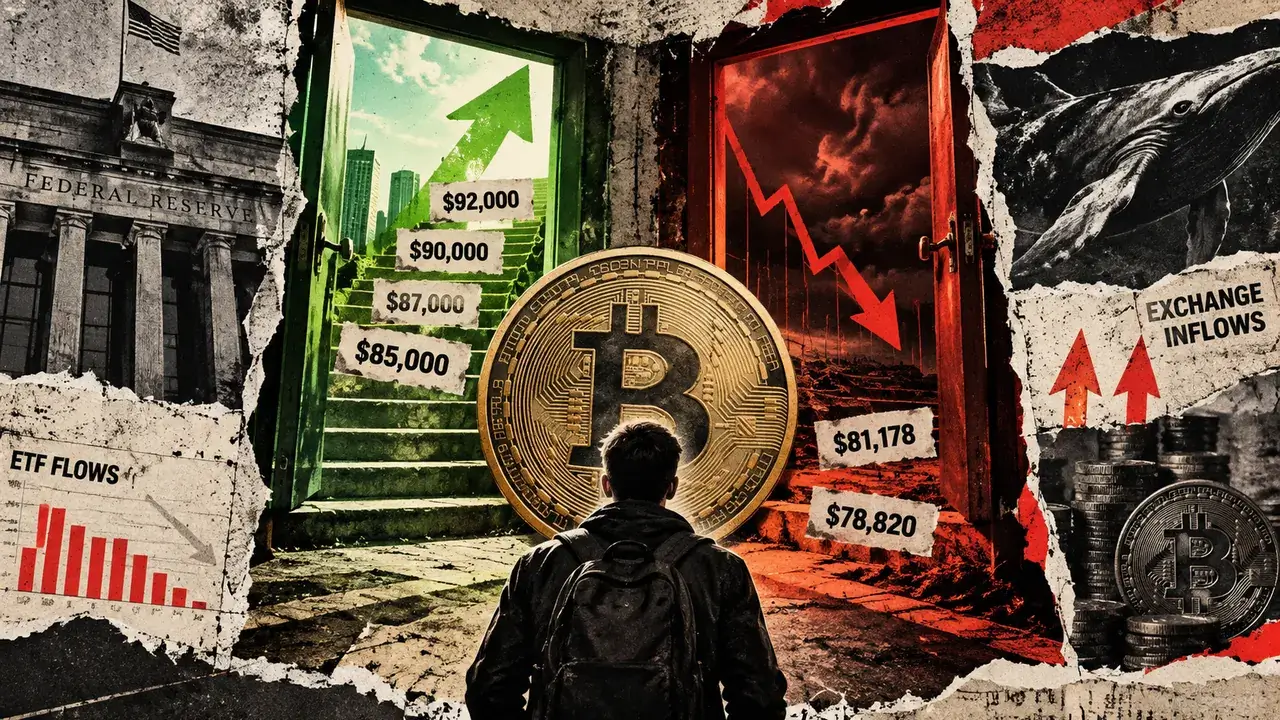
Bitcoin closed the week of Sept. 20 at $81,178, its first weekly settlement above the 50-week moving average since November 2025, and pushed further to an intraday high above $87,000 the next day.
The breakout clears one of the market's most closely watched technical lines, but leaves open the question of whether the buying underneath it can hold that ground.
A Bitcoin reclaim with history behind it
Galaxy Research examined 13 prior instances of Bitcoin reclaiming the 50-week average on a weekly close.
Eleven of those reclaims held, with the bear market's low staying in place afterward. In four of five completed bear markets that had previously lost the indicator, that first weekly reclaim marked the definitive bottom.
Galaxy's sample draws repeatedly from the same handful of market cycles, limiting how much weight the pattern alone can carry.
| Historical signal | What it suggests | Why it needs caution |
|---|---|---|
| 13 prior weekly reclaims studied by Galaxy | The 50-week MA has historically marked major trend shifts | Small sample |
| 11 reclaims held without a lower bear-market low | Reclaims often preceded durable recoveries | Observations repeat across the same cycles |
| 4 of 5 completed bear markets bottomed at the first reclaim | This week’s close has historical weight | Does not guarantee the current cycle follows the pattern |
| Current weekly close: $81,178 vs. 50-week MA at $78,820 | Bitcoin reclaimed the line by about 3% | Needs follow-through above nearby resistance |
Nicolai Sondergaard, senior research analyst at Nansen, points to a specific gap behind the rally. Large Bitcoin traders on Hyperliquid remained net short even as price broke higher, and on-chain data showed more Bitcoin flowing into exchanges than out of them over the two days surrounding the move.
He said in a note:
“Bitcoin's move above $84,000 looks less like a clean macro-driven accumulation event and more like a combination of renewed ETF demand and a large short squeeze.”
Under-positioned traders forced to chase price can keep a rally running mechanically for a while.
Sondergaard's added that capital has moved into higher-beta pockets like lending, yield and RWA-linked tokens, staying selective and concentrated in specific corners of the market.
He argued that the current setup is better described as a tactical risk-on rebound than a confirmed new accumulation cycle.
Glassnode's Sept. 21 research found spot taker flow turning positive, a genuine demand signal. Alongside that, futures open interest, funding rates and realized profit-taking all climbed over the same window, and the firm's weekly ETF-flow indicator stayed negative by roughly $300 million.
What needs to happen from here
Sondergaard framed the next test around two conditions: sustained spot buying and ETF inflows returning to positive. In his view, those are what separate a rally that holds from one that fades once the squeeze runs out of shorts to force.
The immediate level is $85,000, and he wants to see it hold as genuine support through repeated tests. Above that, $87,000 becomes a retest level, with $90,000 standing as the next psychological marker and $92,000 as a further resistance zone Sondergaard has flagged. He tied it all to spot demand continuing and macro headlines staying calm.
| Level | Role now | What to watch |
|---|---|---|
| $92,000 | Further resistance | Break above would strengthen the upside case |
| $90,000 | Psychological resistance | Next major round-number test |
| ~$87,400 | Intraday high / retest zone | Reclaiming it after a pullback would show resilience |
| $85,000 | Immediate support test | Key level Sondergaard wants to see hold |
| $81,178 | Prior weekly close | Losing this would weaken the breakout structure |
| $78,820 | 50-week moving average | Retest of the reclaimed trend line |
The Federal Reserve raised its target rate range to 3.75% to 4% on Sept. 16, with officials leaving open the possibility of another increase this year.
CoinShares' James Butterfill warned two days later that persistent inflation and elevated yields could delay a sustained Bitcoin recovery. He even called a decisive break above $80,000 improbable at the time.
Butterfill's broader point about persistent inflation and elevated yields constraining liquidity conditions still factors into the calculation.
Oil prices and Treasury yields eased on Sept. 21, coinciding with the rally, and a reversal in either would tighten the same financial conditions that helped fuel Bitcoin's move higher.
Regulators moved fast while Congress stalled
The Senate failed to advance the CLARITY Act on Sept. 15. Two days later, the SEC issued a temporary, conditional five-year exemption letting qualifying venues trade tokenized US stocks under specified safeguards.
The CFTC separately submitted a single preliminary regulatory filing covering crypto-asset transactions and markets for federal review.
Diana Pires, chief business officer at sFOX, sees deliberate preparation behind that timing. She said in a note:
“Clarity's failure wasn't the moment these agencies decided to act; it was the trigger on a plan they'd already built.”
Agency exemptions and rulemaking move faster than statute, and a future commissioner or administration can narrow or unwind them far more easily than a law passed by Congress. Pires added that these agencies' moves should be treated as real runway.
The CFTC's filing remains an early-stage submission, and its eventual requirements are not yet public. Both actions matter for Bitcoin mainly through institutional confidence, signaling that US market infrastructure keeps developing even when Congress cannot pass full market-structure legislation.
Will a Bitcoin breakout turn into a floor or a squeeze?
The bull case has spot demand and ETF flows both turning decisively positive in the coming days, letting Bitcoin hold $85,000 as genuine, repeatedly tested support.
Under that path, a retest and clearance of $87,400 opens the way toward $90,000 and eventually $92,000, and the 50-week reclaim joins Galaxy's list of successful historical cases.
| Signal | Bull-breakout version | Bull-trap version |
|---|---|---|
| $85,000 level | Holds through repeated tests | Breaks quickly after the rally |
| Spot demand | Spot taker buying stays positive | Spot bid fades after the squeeze |
| ETF flows | Turn decisively positive | Stay negative or choppy |
| Leverage | Open interest rises without overheating | Funding and open interest rise faster than spot demand |
| Exchange flows | BTC outflows resume | More BTC keeps entering exchanges |
| Macro backdrop | Yields and oil stay calm | Yields or oil reverse higher |
The bear case has ETF flows staying negative while exchange inflows continue and leverage builds faster than spot demand can support.
In that scenario, Bitcoin loses $85,000, slides back toward the $81,178 weekly close, and eventually retests the $78,820 moving average itself. What looked like a durable reversal turns into a short squeeze, borrowing its gains from traders who never believed in it.
Bitcoin has already cleared the technical line that history says matters most. What happens at $85,000 over the coming days will determine whether that history applies this time.
The post Bitcoin’s $87,000 breakout puts $90,000 in sight, but history comes with a catch appeared first on CryptoSlate.