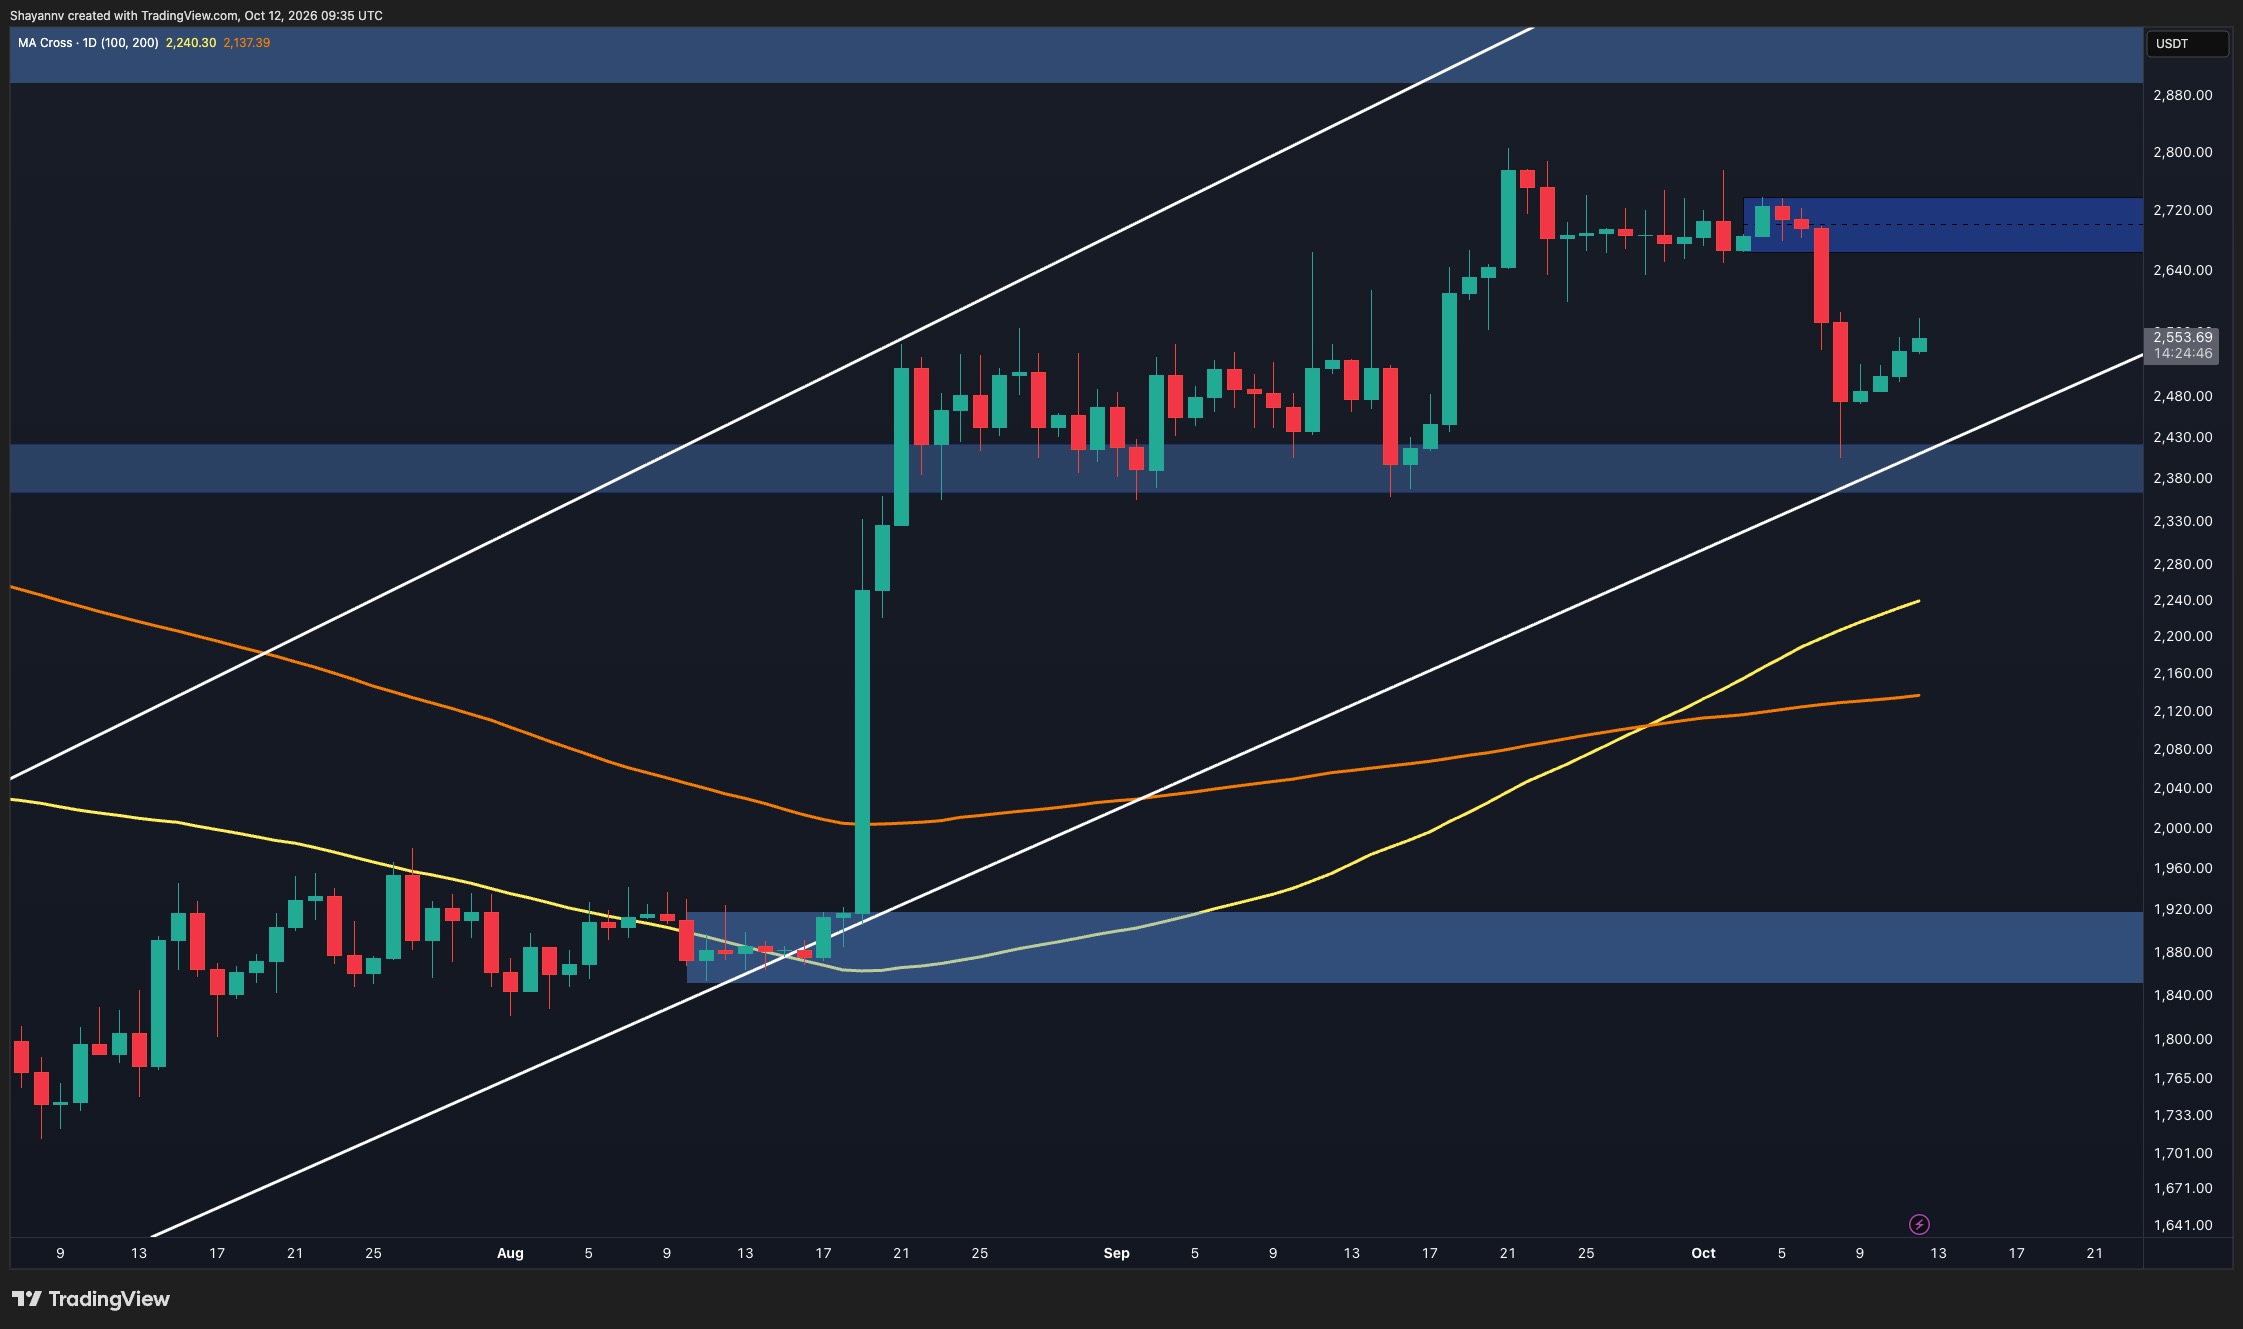
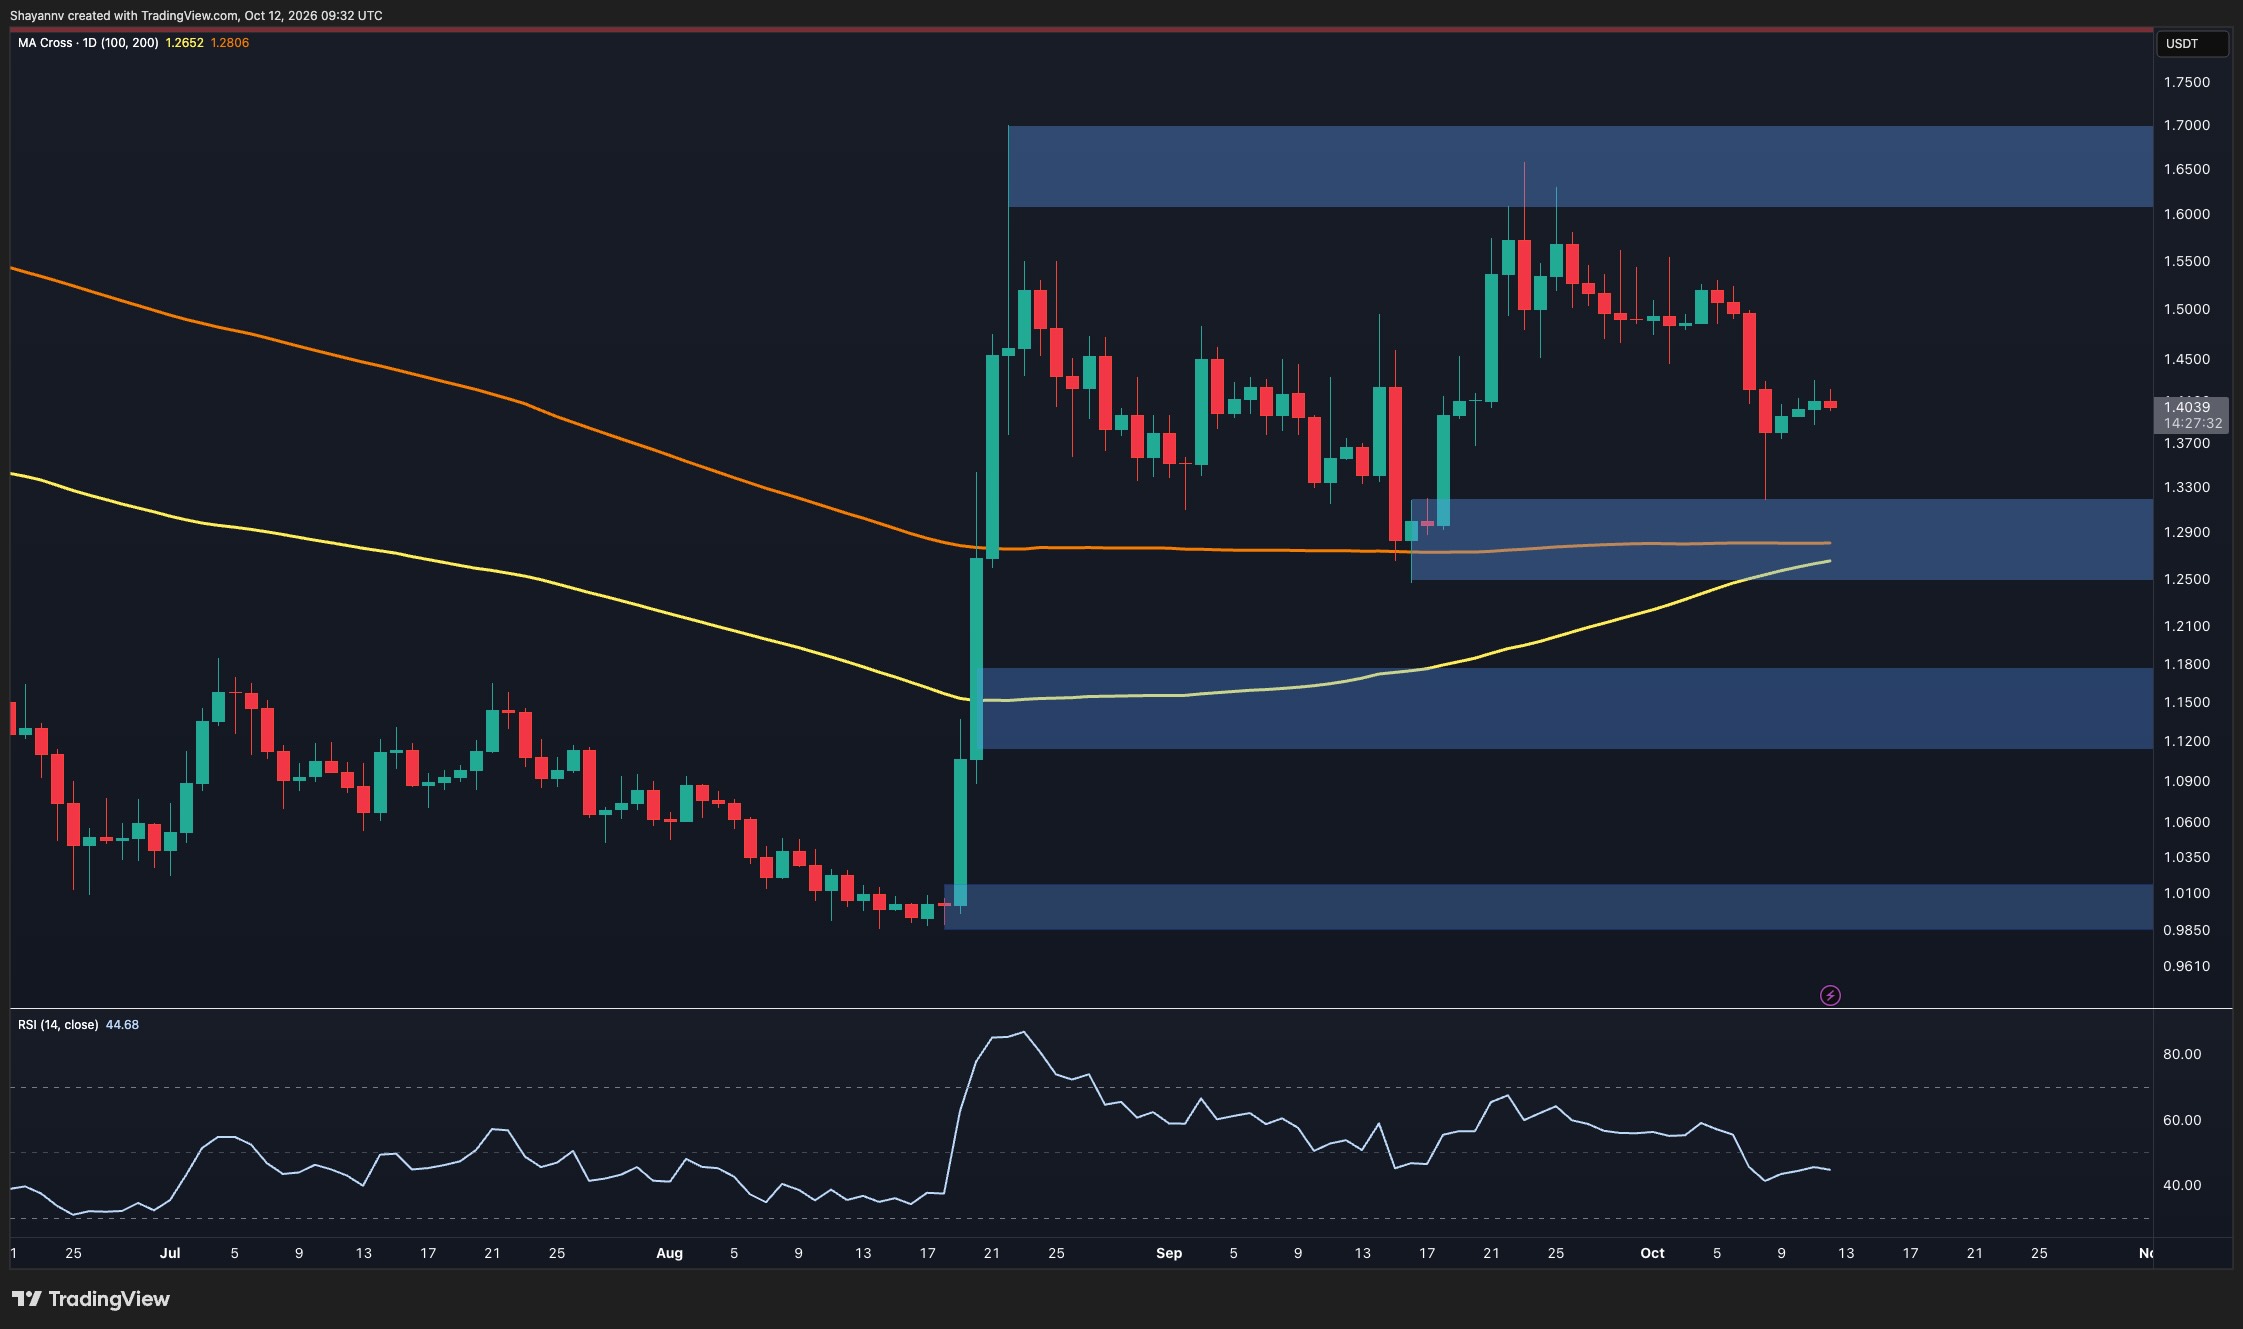
XRP’s rebound has stalled near $1.40 after a sharp decline from its recent consolidation. Buyers have responded around a major demand zone, but the price remains beneath nearby resistance and within a corrective structure.
Ripple Price Analysis: The Daily Chart
On the daily timeframe, Ripple’s token has extended its correction following the rejection from the $1.61–$1.70 resistance zone. The latest selloff pushed the price below the $1.48–$1.50 consolidation area, with a long lower wick reaching approximately $1.32 before buyers stepped in. Subsequent candles show stabilization around $1.40, although the recovery has so far lacked strong follow-through.
The $1.25–$1.32 demand zone remains particularly important. It overlaps with the 100-day and 200-day moving averages, positioned near $1.265 and $1.281, respectively. The rising 100-day average is approaching the 200-day average from below, suggesting a potential bullish crossover, but confirmation is still pending. Meanwhile, the daily RSI sits around 45, indicating that momentum remains below neutral despite the bounce.
Holding the demand zone could preserve the broader recovery and support another attempt toward the $1.48–$1.52 resistance area. Beyond that, the $1.61–$1.70 supply zone remains the main upside barrier. Conversely, a sustained break below $1.25 would weaken the recovery structure and expose the next highlighted support zone at $1.11–$1.18.
XRP/USDT 4-Hour Chart
The 4-hour chart shows XRP moving within a descending channel, with successive lower highs maintaining the corrective trend. The recent decline broke through the $1.43–$1.45 support zone before briefly reaching the channel’s lower boundary near $1.32. Buyers then drove a rebound toward $1.42, where the recovery encountered renewed selling pressure.
The former $1.43–$1.45 demand zone now represents an overhead resistance area. Its proximity to the descending channel’s upper boundary creates a significant obstacle for buyers. A sustained move above both would provide an initial signal that selling pressure is easing and could open the way toward the $1.48–$1.52 resistance region.
Until that breakout occurs, the rebound appears corrective. Losing nearby support around $1.38 would bring the $1.34–$1.35 area back into focus, followed by the broader $1.25–$1.32 demand zone. The reaction to the $1.43–$1.45 resistance area will therefore be important in determining whether XRP can escape the descending channel or remains vulnerable to another decline.

The post Ripple Price Analysis: What’s Next for XRP After Another Rejection at Key Resistance? appeared first on CryptoPotato.