Ripple’s XRP is trying to gain traction amid a volatile macro backdrop, where Bitcoin dominance and ETF optimism are stealing the spotlight. Despite broader altcoin hesitation, XRP has seen a short-term bounce, but remains trapped below major resistances. The recent spike followed Bitcoin’s ETF rally, yet XRP is still under pressure on both the USDT and BTC pairs, reflecting weak relative strength.
Ripple/USDT Pair: Technical Analysis
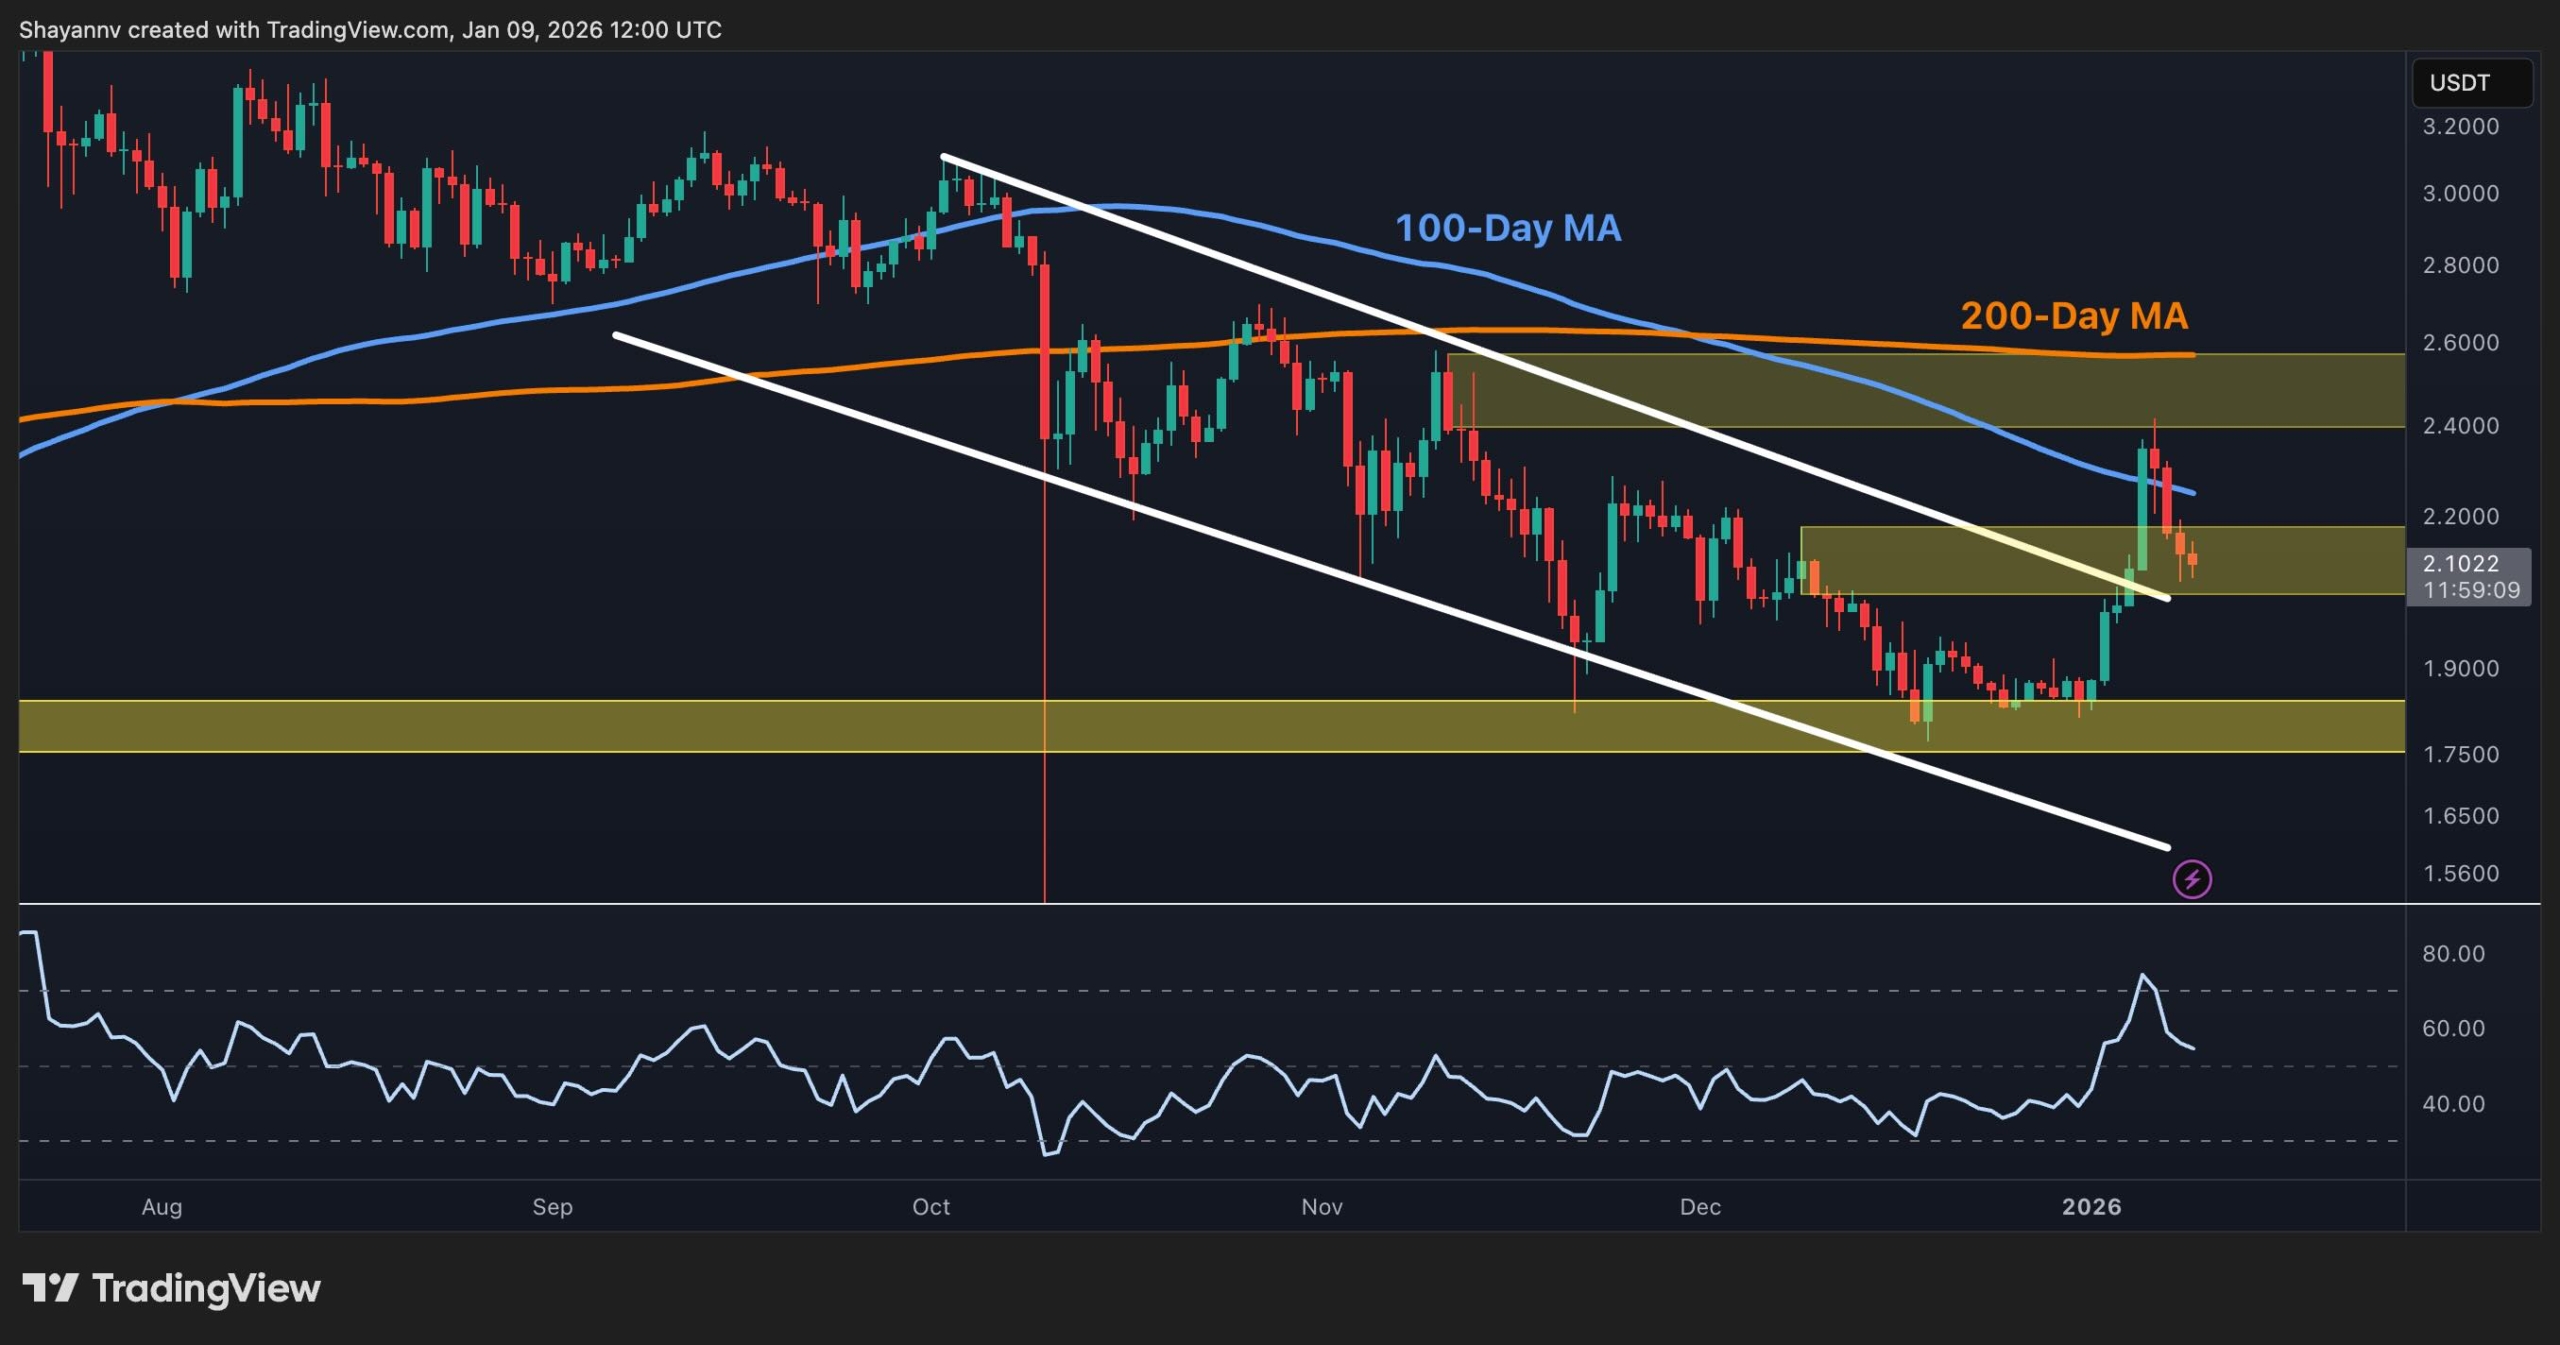
The XRP/USDT daily chart shows a clean breakout from the descending channel that had been pressuring the price since October. This breakout triggered a strong bullish move, pushing the asset into the $2.40 resistance zone. However, it was quickly rejected from the 100-day moving average, now located around the $2.30 mark, and is currently pulling back.
The current support lies around the $2.00 zone, a previous range high turned support. This area must hold to keep the bullish structure intact. If lost, the price could revisit the $1.80 demand zone. On the upside, reclaiming the $2.40 zone with volume would open the door for a push toward the critical $3.00 area.
The BTC Pair
The XRP/BTC chart paints a less bullish picture. After a brief breakout above the key 2,400 sat zone, the price faced strong resistance from the 200-day moving average and quickly reversed. XRP is now trading just below the 100 and 200-day moving averages, both flattening, signaling uncertainty.
The failure to hold above both moving averages and horizontal resistance suggests bearish pressure is returning. If XRP fails to defend the 2,200 sat zone, it may revisit the key demand area at the 2,000 sat mark.
On the flip side, a reclaim of the 2,400 sat supply zone on strong volume could reignite a mid-term rally, but that would require broader altcoin strength, which is not evident yet.

The post Ripple Price Analysis: What Is XRP’s Next Move as Bullish Momentum Quickly Faded? appeared first on CryptoPotato.