XRP is still trading in a broader downtrend, and the rebound attempts keep getting capped at lower highs. The asset is now trying to establish a bottom near the lower part of the range, so the next move likely comes down to whether buyers can defend the recent floor and reclaim the first resistance band.
Ripple Price Analysis: The USDT Pair
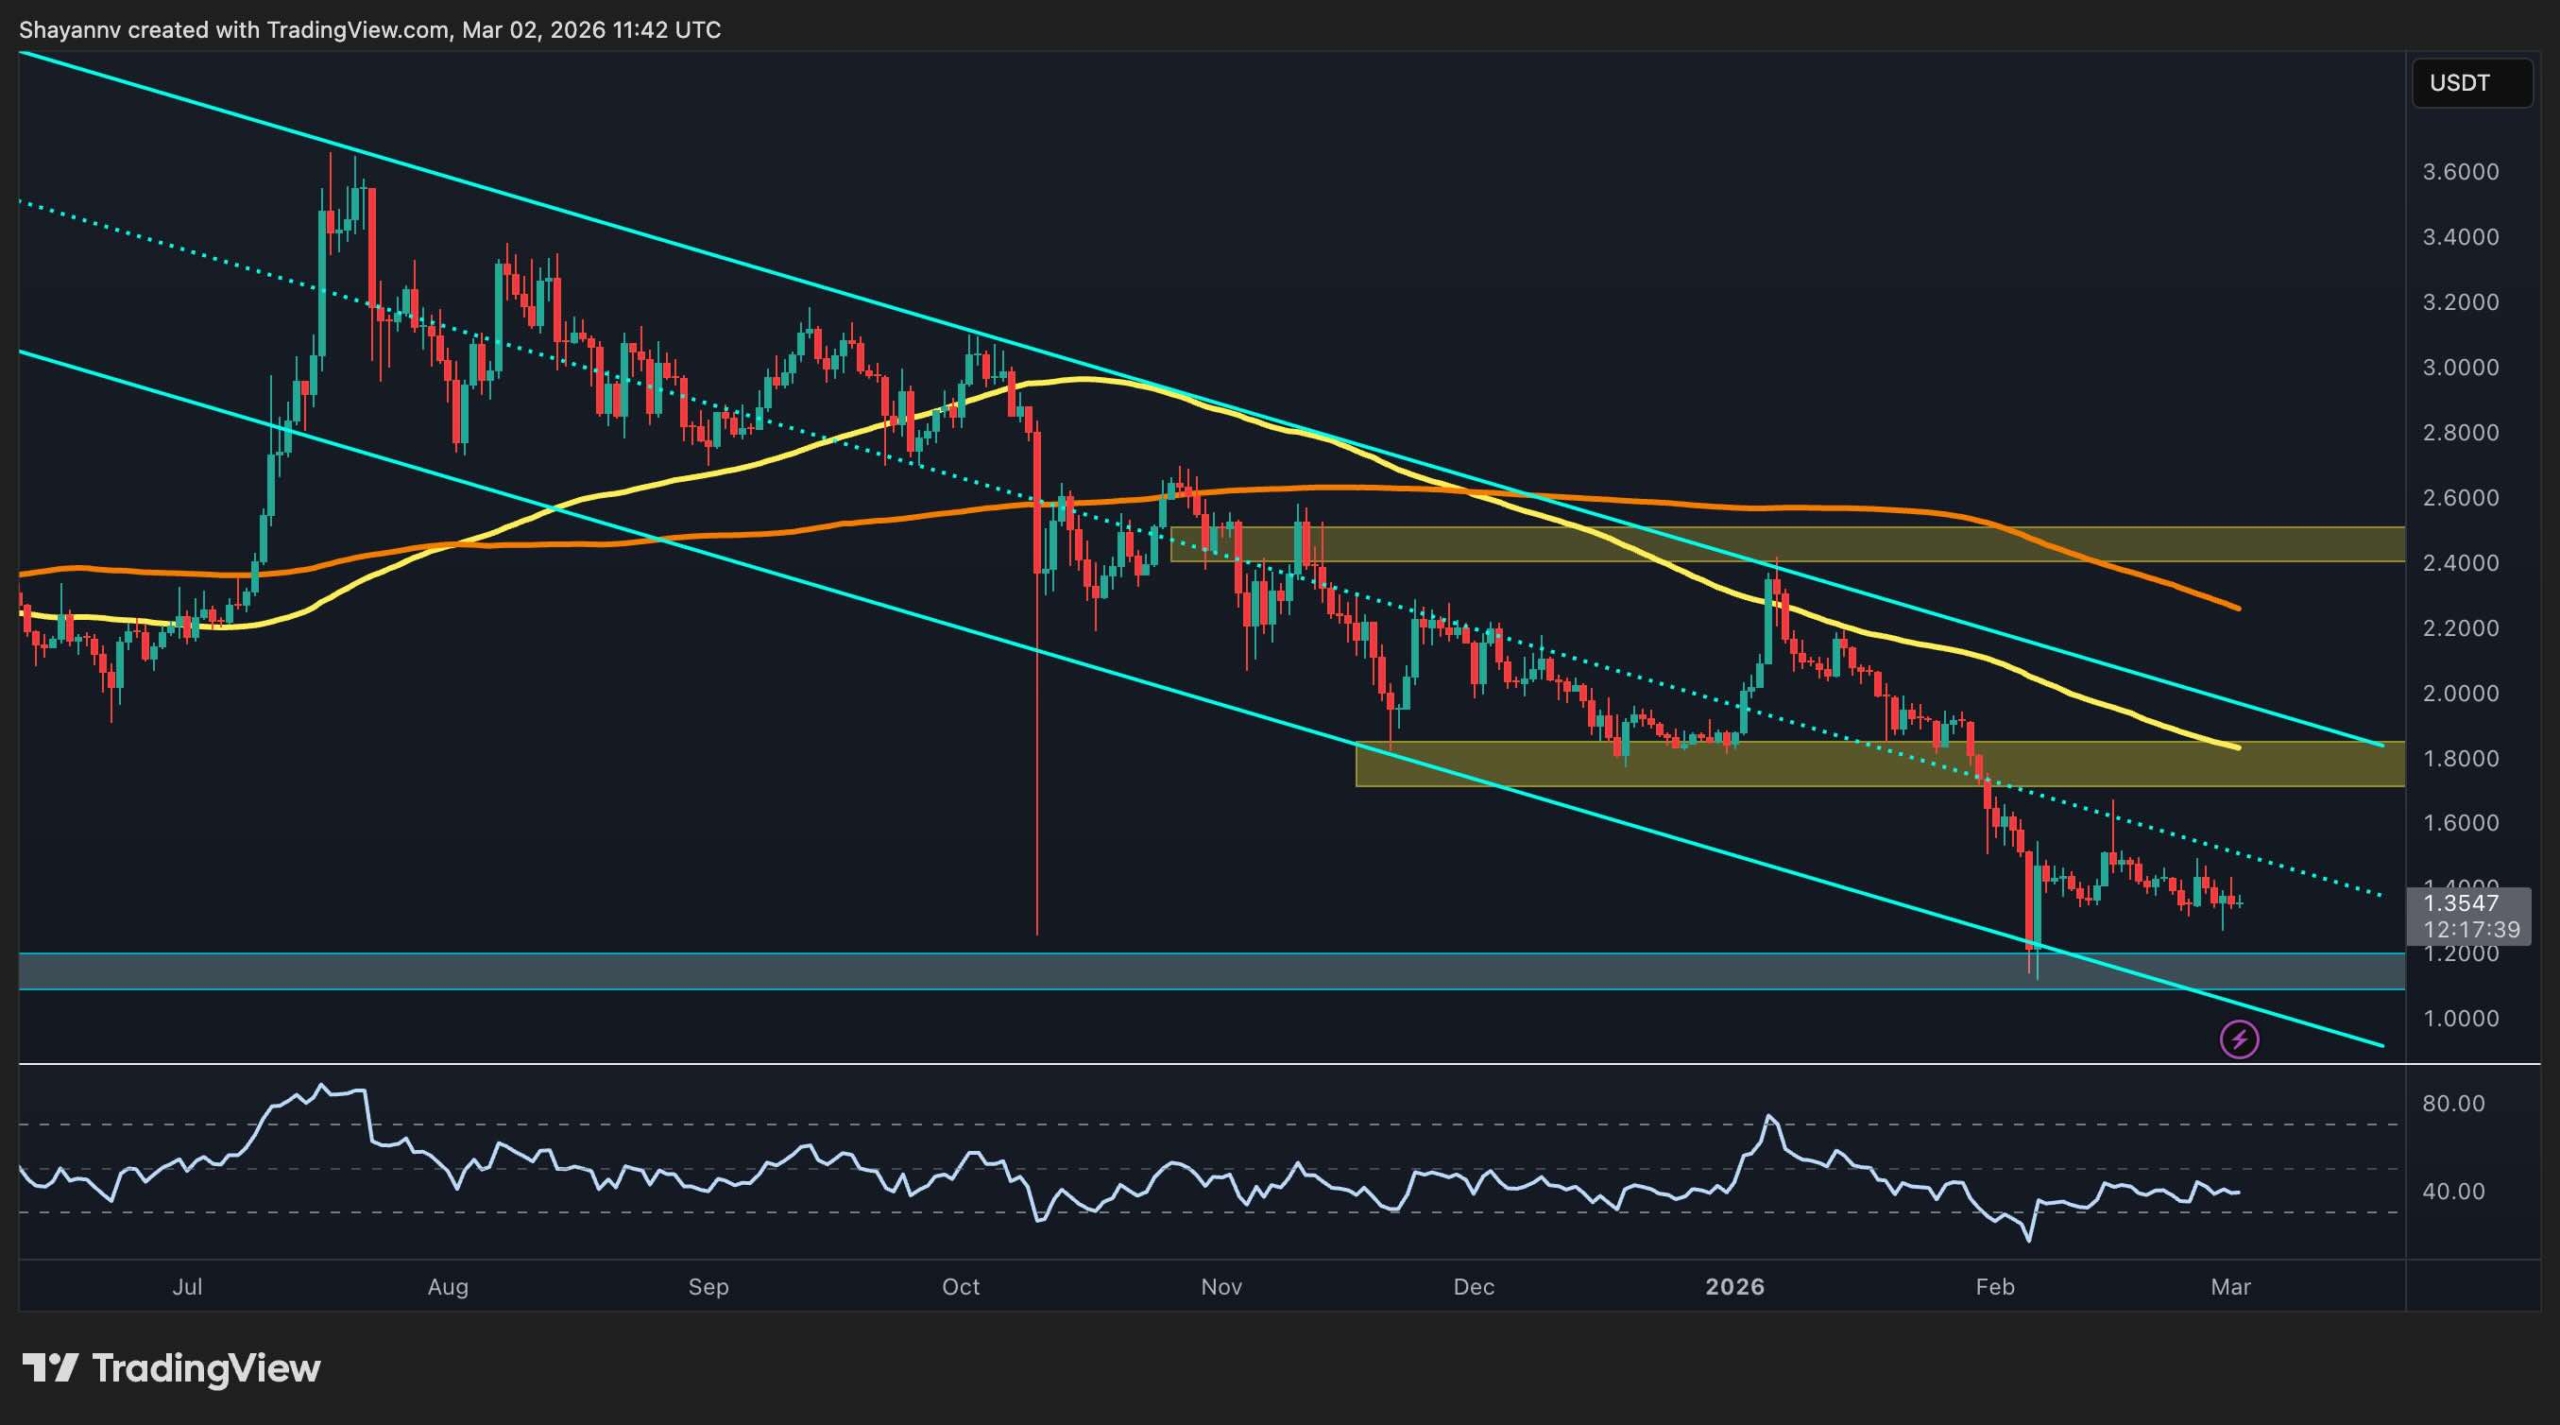
On the daily XRPUSDT chart, the trend remains bearish inside a descending channel, with the price holding below the 100-day moving average and the 200-day moving average. The most important overhead supply is the $1.80 zone, which has acted as a pivot area and now lines up with dynamic resistance from the moving averages and the channel structure.
Above that, the next heavier resistance level sits around $2.40 to $2.50, where sellers previously stepped in and where a larger trend shift would need to prove itself.
Support is concentrated around $1.20, which is the area that has been repeatedly defended after the recent flush. As long as XRP stays above this band, the market can keep forming a base and attempt a recovery leg. A clean daily breakdown below $1.20, however, would weaken the structure and increase the odds of a deeper drop toward the next support region near $1.00 or even lower.
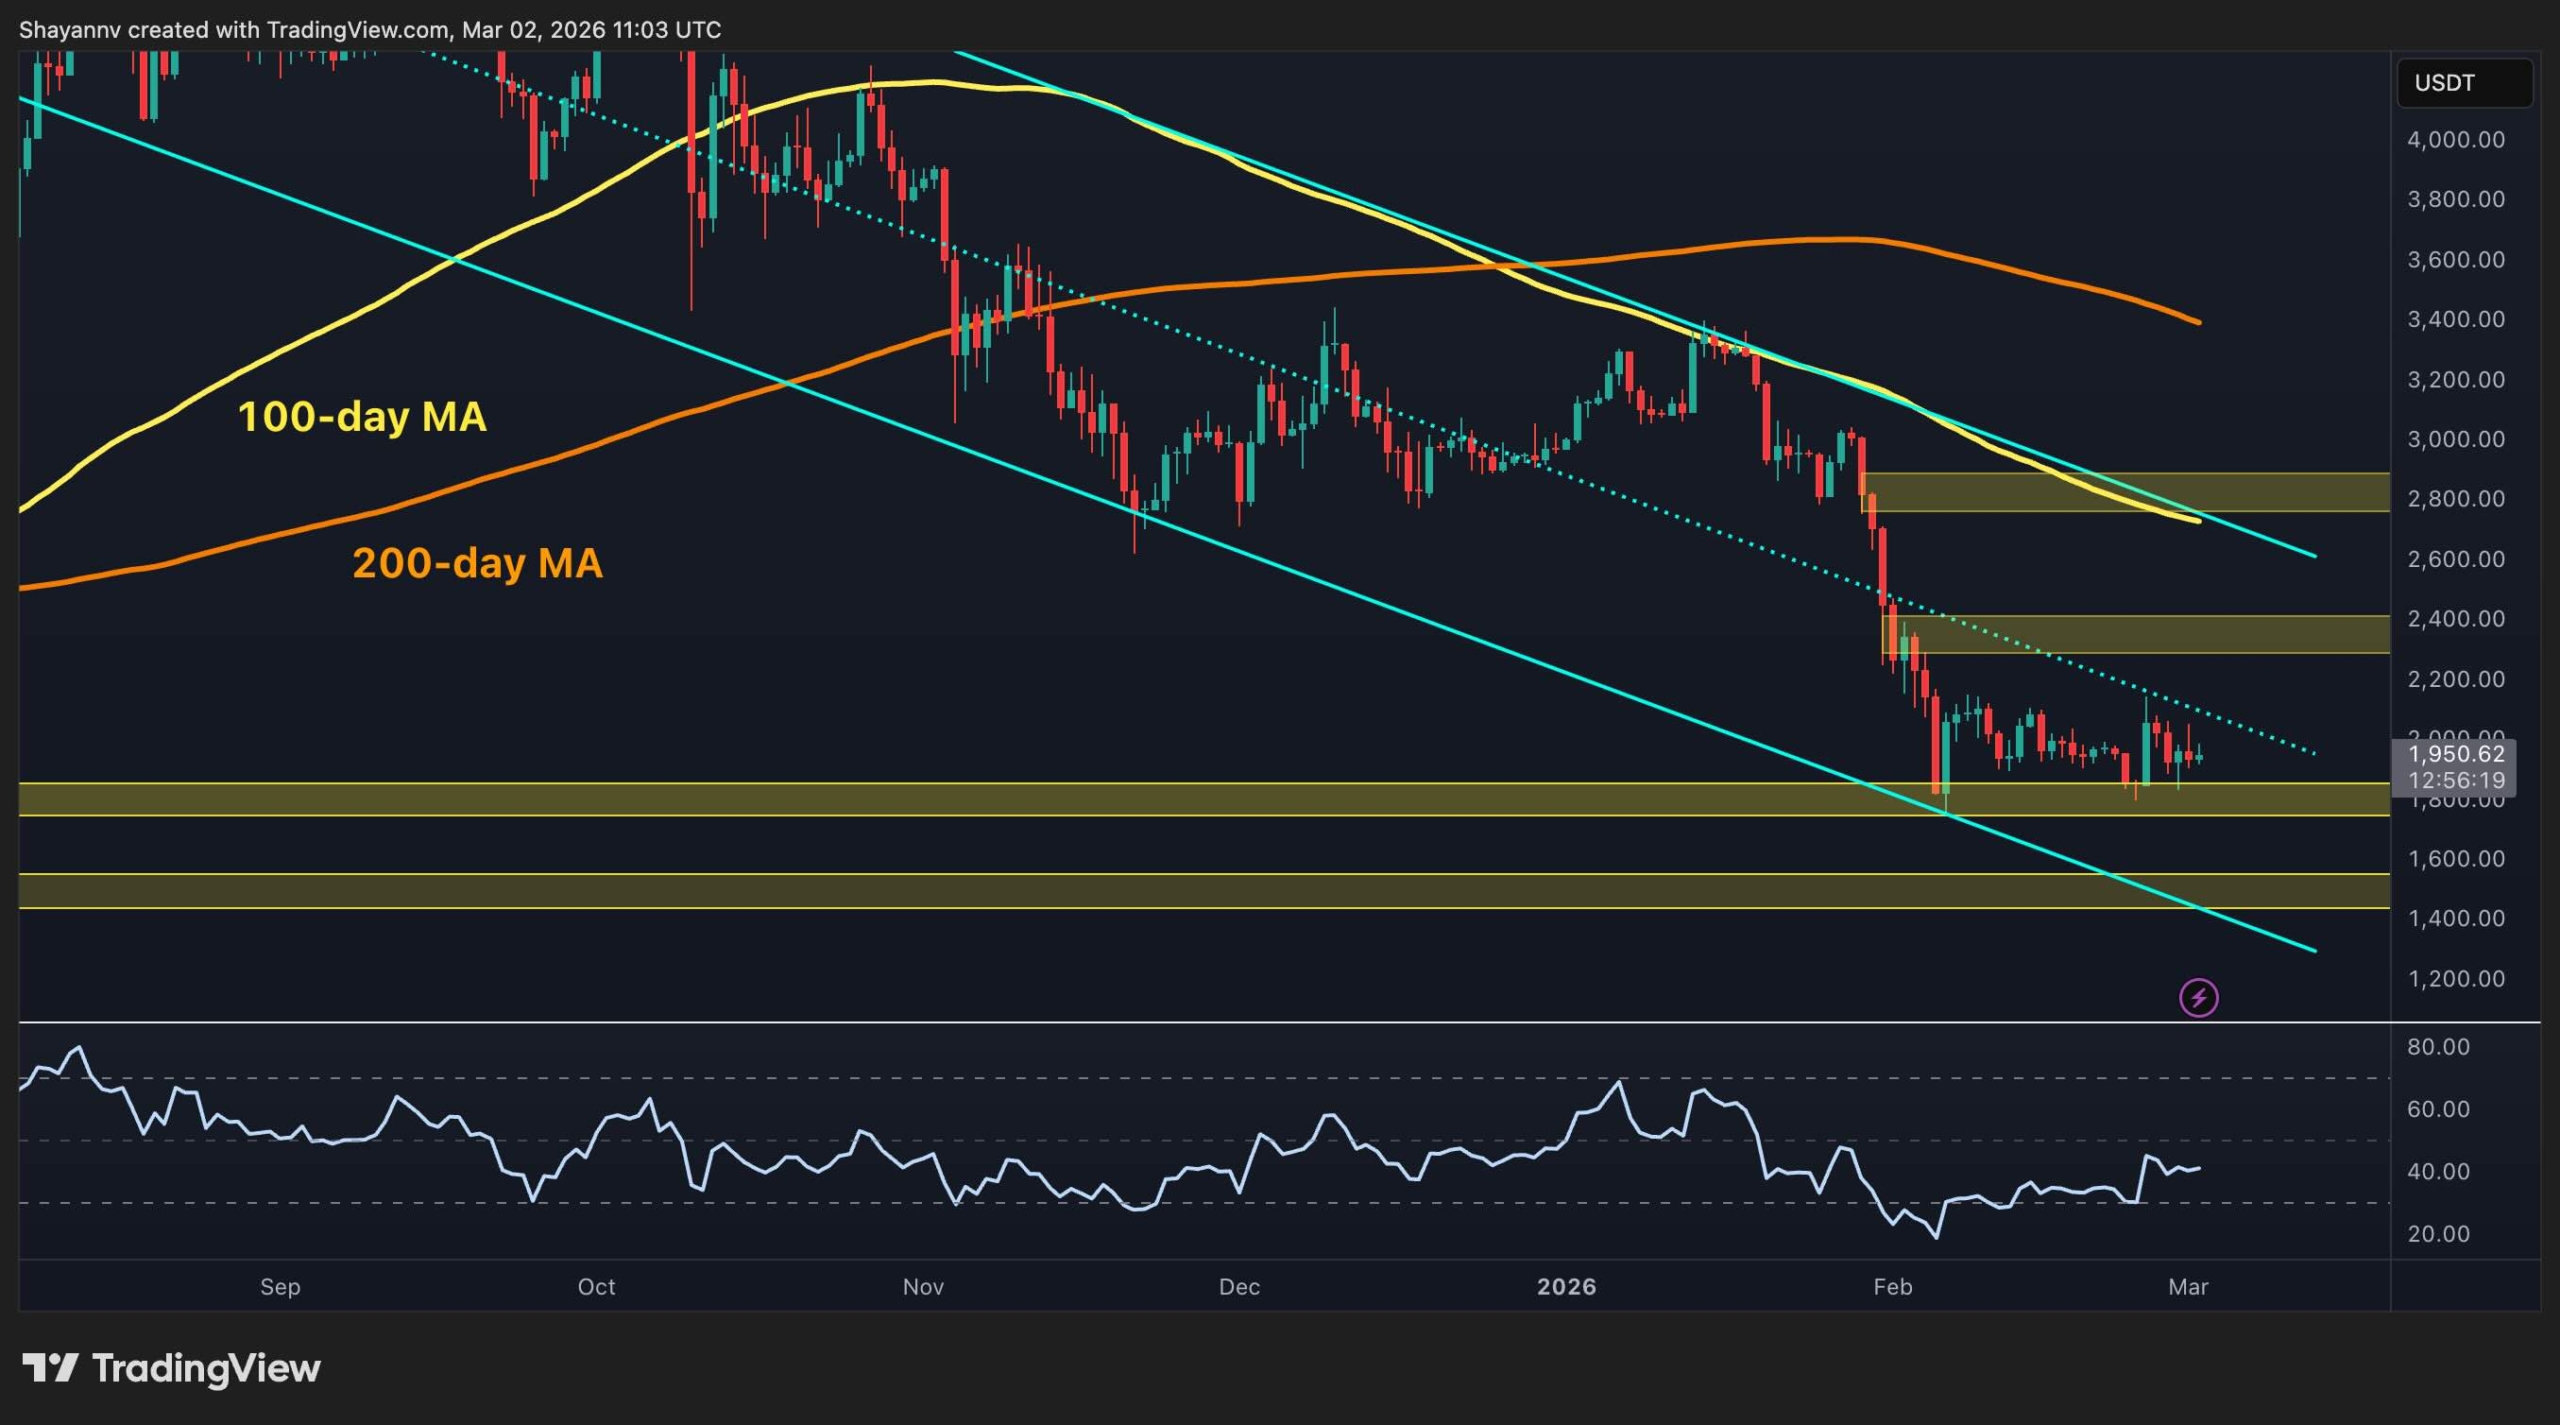
The BTC Pair
On the daily XRPBTC chart, XRP is trading around 2,050 sats and still sits below key resistance levels and the key 100-day and 200-day moving averages, after failing to hold the prior recovery swings. The first resistance to watch is the 100-day moving average around 2,200, followed by the 200-day moving average around 2,400 sats.
These elements have repeatedly rejected the price and also overlap with the moving averages, acting as pressure from above. If XRP can reclaim that zone and hold it, the next upside target becomes the 2,500 to sats supply area.
The main support is also located near the 2,000 sats region, which has been tested multiple times and is clearly a line bulls are trying to defend. If the 2,000-sat level fails on a clean break and close, the next major demand pocket sits much lower around 1,400 to 1,500 sats. That is the type of move that usually happens when Bitcoin strength outpaces altcoins, so XRPBTC is still the key risk gauge for bulls here.

The post Ripple Price Analysis: Is the Bottom In for XRP? The Critical Levels You Need to Watch appeared first on CryptoPotato.