Ethereum is still trying to transition from capitulation into stabilization, with the price holding above the key $1,800 demand zone while repeatedly pressing into resistance near $2,150. The higher timeframe trend remains bearish, but the short-term structure is improving, so the next clean break from this range will likely set the tone for the next multi-week move.
Ethereum Price Analysis: The Daily Chart
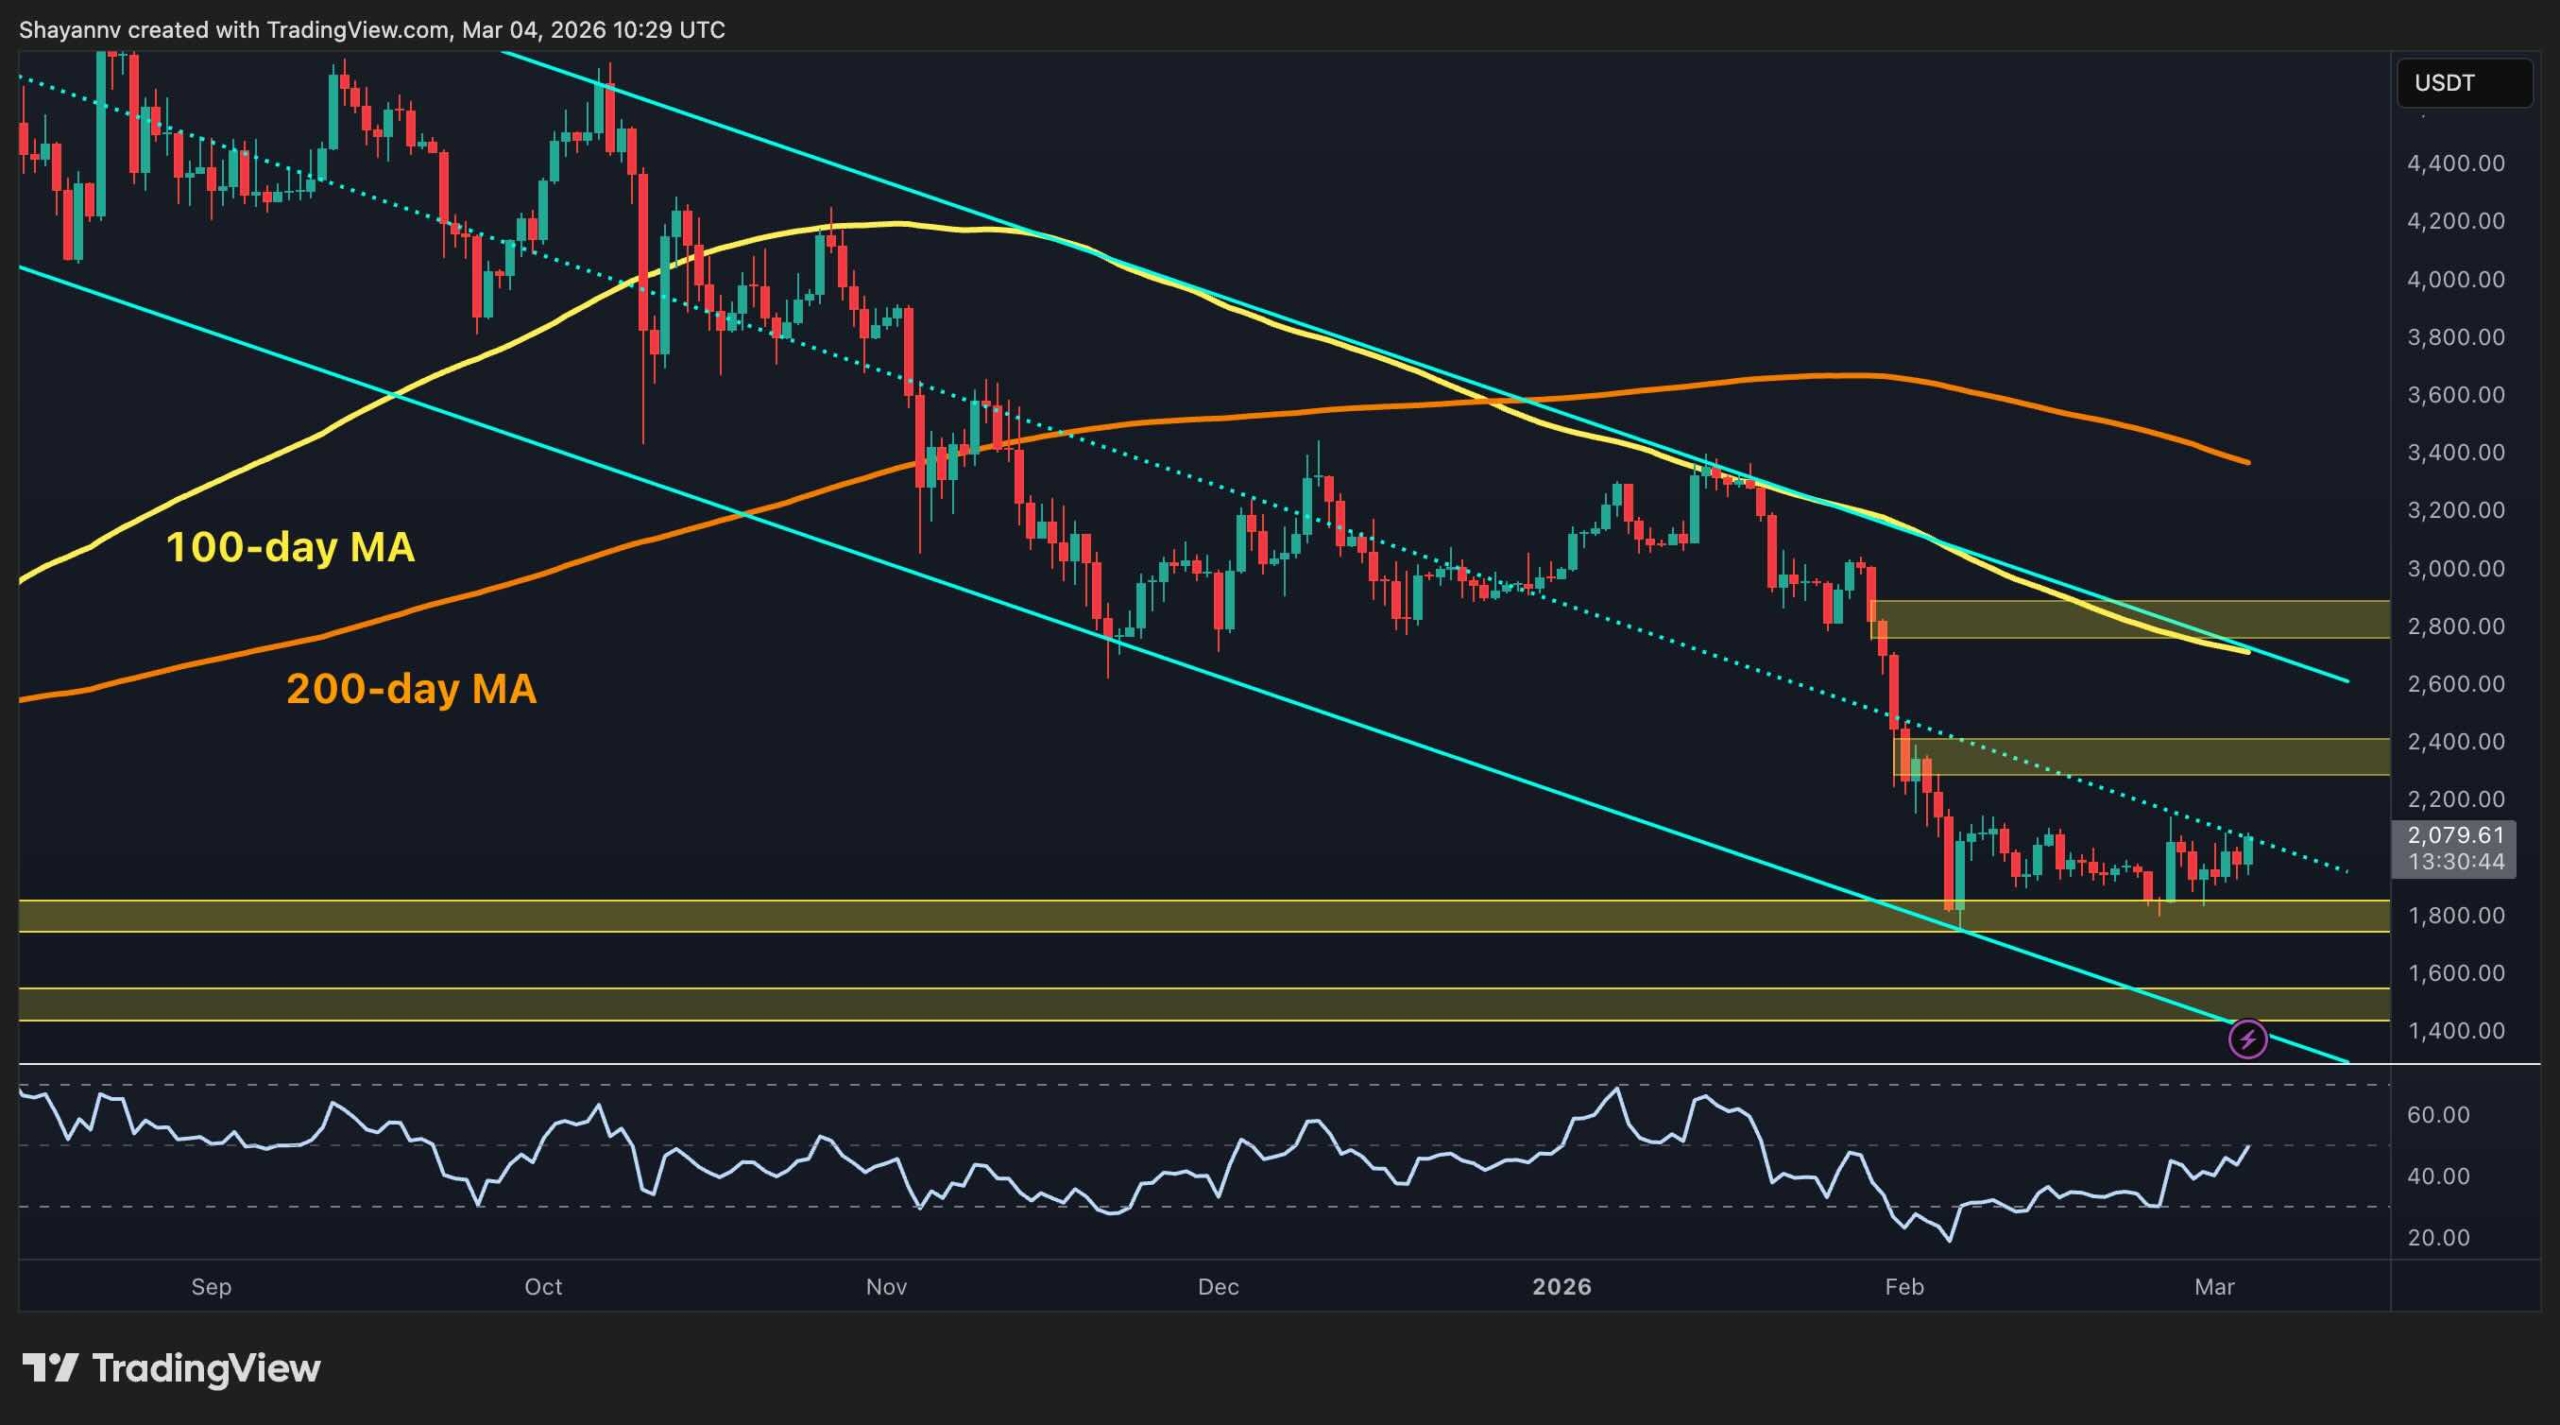
On the daily chart, ETH is still trading below the 100-day moving average and the 200-day moving average, and both are sloping lower, which keeps the broader bias bearish. The asset is also respecting a descending channel, and the latest bounce is happening from the lower end of that structure rather than from a reclaimed trend level. The nearest overhead supply remains the $2,300 to $2,400 zone, which has acted as a pivot area during the previous distribution phase.
The most important support remains $1,800, which has been tested and defended after the sharp breakdown. If ETH loses $1,800 on a daily close, the next downside magnets are $1,600 and then $1,400, where prior demand zones sit on the chart. On the upside, a daily reclaim of $2,400 would be the first meaningful step toward shifting structure, with the next major resistance band near $2,800 to $3,000.
ETH/USDT 4-Hour Chart
On the 4-hour chart, ETH has been carving out a clear range, with buyers defending the $1,800 support area while sellers repeatedly cap the price near the $2,150 mark. This kind of consolidation after a hard sell-off often becomes a decision point, because liquidity builds at both ends, and the breakout can travel quickly. A clean push above $2,150 that holds would put $2,300 to $2,400 back in play as the next target zone.
If ETH fails again at $2,150 and rolls over, the immediate focus returns to the $1,800 area. The risk with repeated support tests is that each bounce can weaken the bid over time, especially if broader market sentiment stays fragile. A breakdown below $1,800 would likely trigger another volatility expansion move because it removes the main demand shelf that has been absorbing selling pressure.

On-Chain Analysis
The exchange reserve chart shows a sustained downtrend in ETH held on exchanges, falling toward roughly 15.9 million ETH. In general, declining exchange reserves are associated with reduced immediate sell-side supply, because fewer coins are sitting on venues where they can be quickly sold. That can support stronger rebounds when demand returns, especially if the price is already basing near support.
The key nuance is timing. During a bear phase, reserve declines can reflect a mix of cold storage withdrawals, staking, and migration to on-chain venues, not necessarily aggressive accumulation. If reserves keep falling while price holds above $1,800 and starts reclaiming resistance, it would strengthen the case for a recovery move. If reserves flatten or begin rising again while ETH remains rejected under $2,150, it can signal renewed distribution and increase the odds of another sweep back into the $1,800 support area.

The post Ethereum Price Analysis: Will ETH Finally Secure the $2K Breakout? appeared first on CryptoPotato.