
Bitcoin’s latest leg up has carried the price directly into a major overhead supply region, putting the rally at an important test. Momentum remains constructive, but the reaction around the $86K-$89K area could determine whether the move develops into another bullish leg or pauses for a deeper retest.
Bitcoin Price Analysis: The Daily Chart
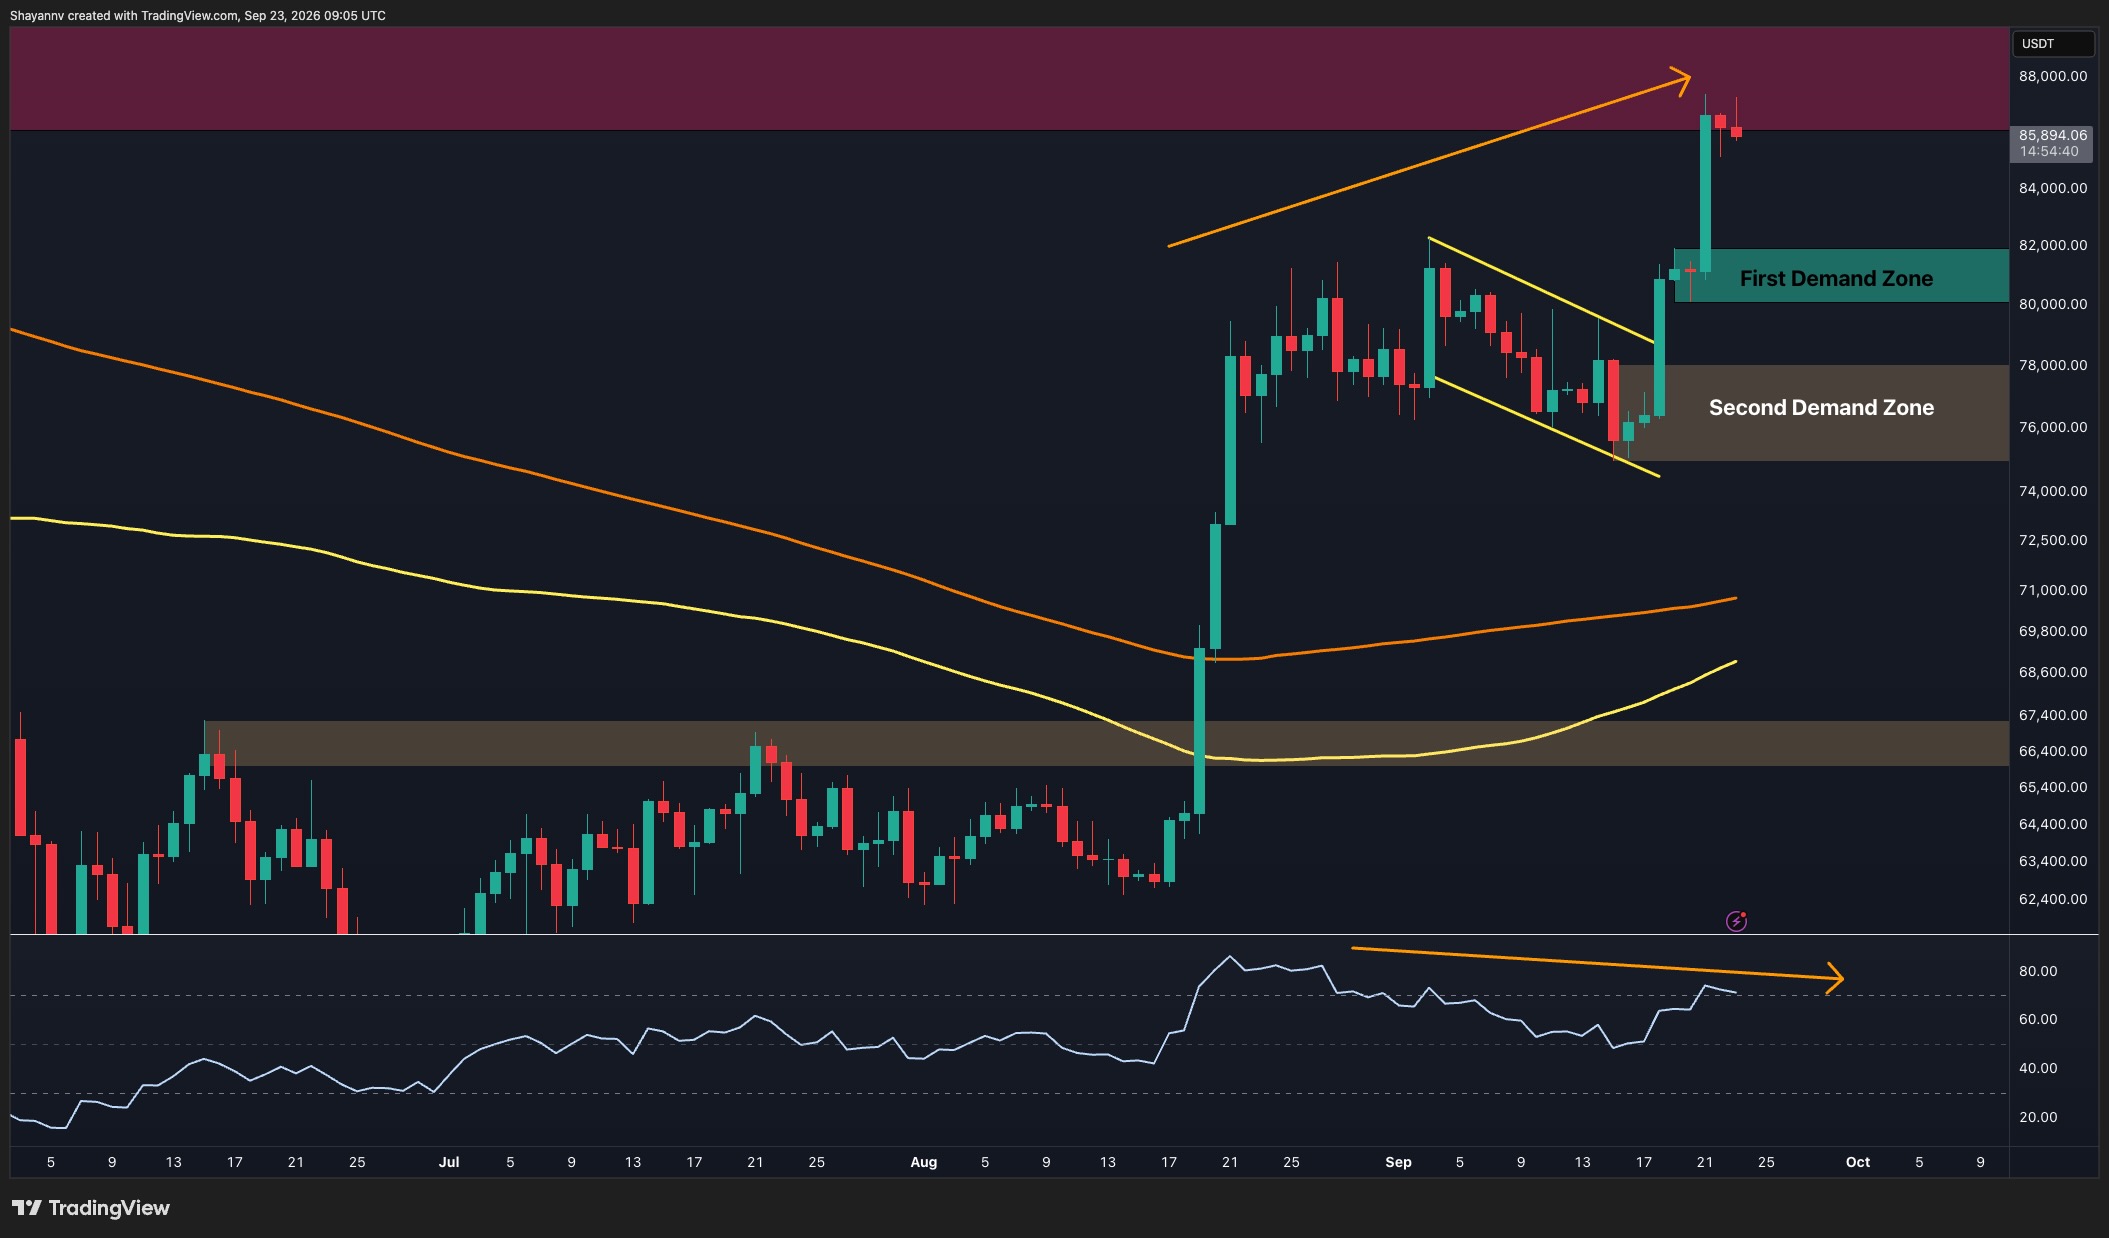
On the daily timeframe, Bitcoin has extended its recovery significantly after breaking out of the previous corrective structure. The asset is now trading around $86K and has entered the major $86K-$89K resistance zone highlighted on the chart.
The broader structure remains bullish. BTC is comfortably above both moving averages, while the sharp recovery from the $75K area has established a clear sequence of higher prices. However, the current resistance zone is substantial, and the latest candles show some hesitation after reaching it.
There is also a notable momentum divergence developing. While the price has pushed to a higher high, the RSI has failed to confirm that strength and remains below its previous peak. This bearish divergence does not necessarily signal an immediate reversal, but it suggests that upside momentum is not expanding at the same rate as price.
As a result, a rejection from the $86K-$89K resistance could trigger a corrective move toward the first demand zone around $80K-$82K. Below that, the $75K-$78K area represents the next major support. Conversely, a decisive daily breakout above $89K would invalidate the immediate bearish divergence concern and strengthen the case for continuation.
BTC/USDT 4-Hour Chart
The 4-hour chart emphasizes just how aggressive the latest move has been. After consolidating around the $80K-$82K demand zone, Bitcoin broke higher with a large impulsive candle and quickly reached the $86K region.
The price is now consolidating just inside the $86K-$89K supply zone rather than immediately reversing, which suggests buyers are still attempting to absorb the available selling pressure. The rising trendline from the $75K low also remains intact, supporting the short-term bullish structure.
Nevertheless, BTC is extended from its nearest demand area. If sellers gain control at the current resistance, the $80K-$82K zone would be the most important initial area to monitor for a pullback. Holding that region would preserve the breakout structure and could provide the foundation for another attempt at $89K.
A breakdown below $80K would weaken the short-term setup and increase the probability of a deeper correction toward the $75K-$78K demand zone.

Sentiment Analysis
The Realized Price UTXO Age Bands chart provides additional context for Bitcoin’s current position by showing the average acquisition prices of different holder cohorts.
BTC, currently around the mid-$80K region on this chart, has moved above the realized prices of several younger and intermediate cohorts. Most notably, price is approaching the 18-month-to-2-year cohort’s realized price, which sits around $88K. The 6-to-12-month cohort is also positioned near $90K.
These levels closely overlap with the $86K-$89K technical resistance identified on the price charts, creating an important confluence. Investors belonging to these cohorts may be approaching their aggregate cost basis, potentially increasing selling or breakeven supply as BTC moves higher.
At the same time, Bitcoin trading above the realized prices of several other active cohorts indicates that a larger portion of those holders has returned to unrealized profit. Therefore, the $88K-$90K region appears particularly important. A sustained move through it would place Bitcoin above another significant cluster of holder cost bases and could reinforce the bullish continuation scenario, while rejection would leave the current resistance confluence intact.

The post Bitcoin Price Analysis: BTC Faces First Major Test After 13% Weekly Rally appeared first on CryptoPotato.