XRP price trades at $1.33 on April 6, up 3% over the past 24 hours, but sitting inside a developing head and shoulders pattern on the daily chart. The right shoulder is forming, and any rally from here needs to push through a 1.24 billion token supply wall overhead.
The problem is that the buying pressure, which would normally drive that kind of move, has halved since late March, raising the question of whether the current bounce has enough fuel to absorb the supply or will simply complete the bearish pattern.
A Right Shoulder Is Forming, and Two EMAs Stand in the Way
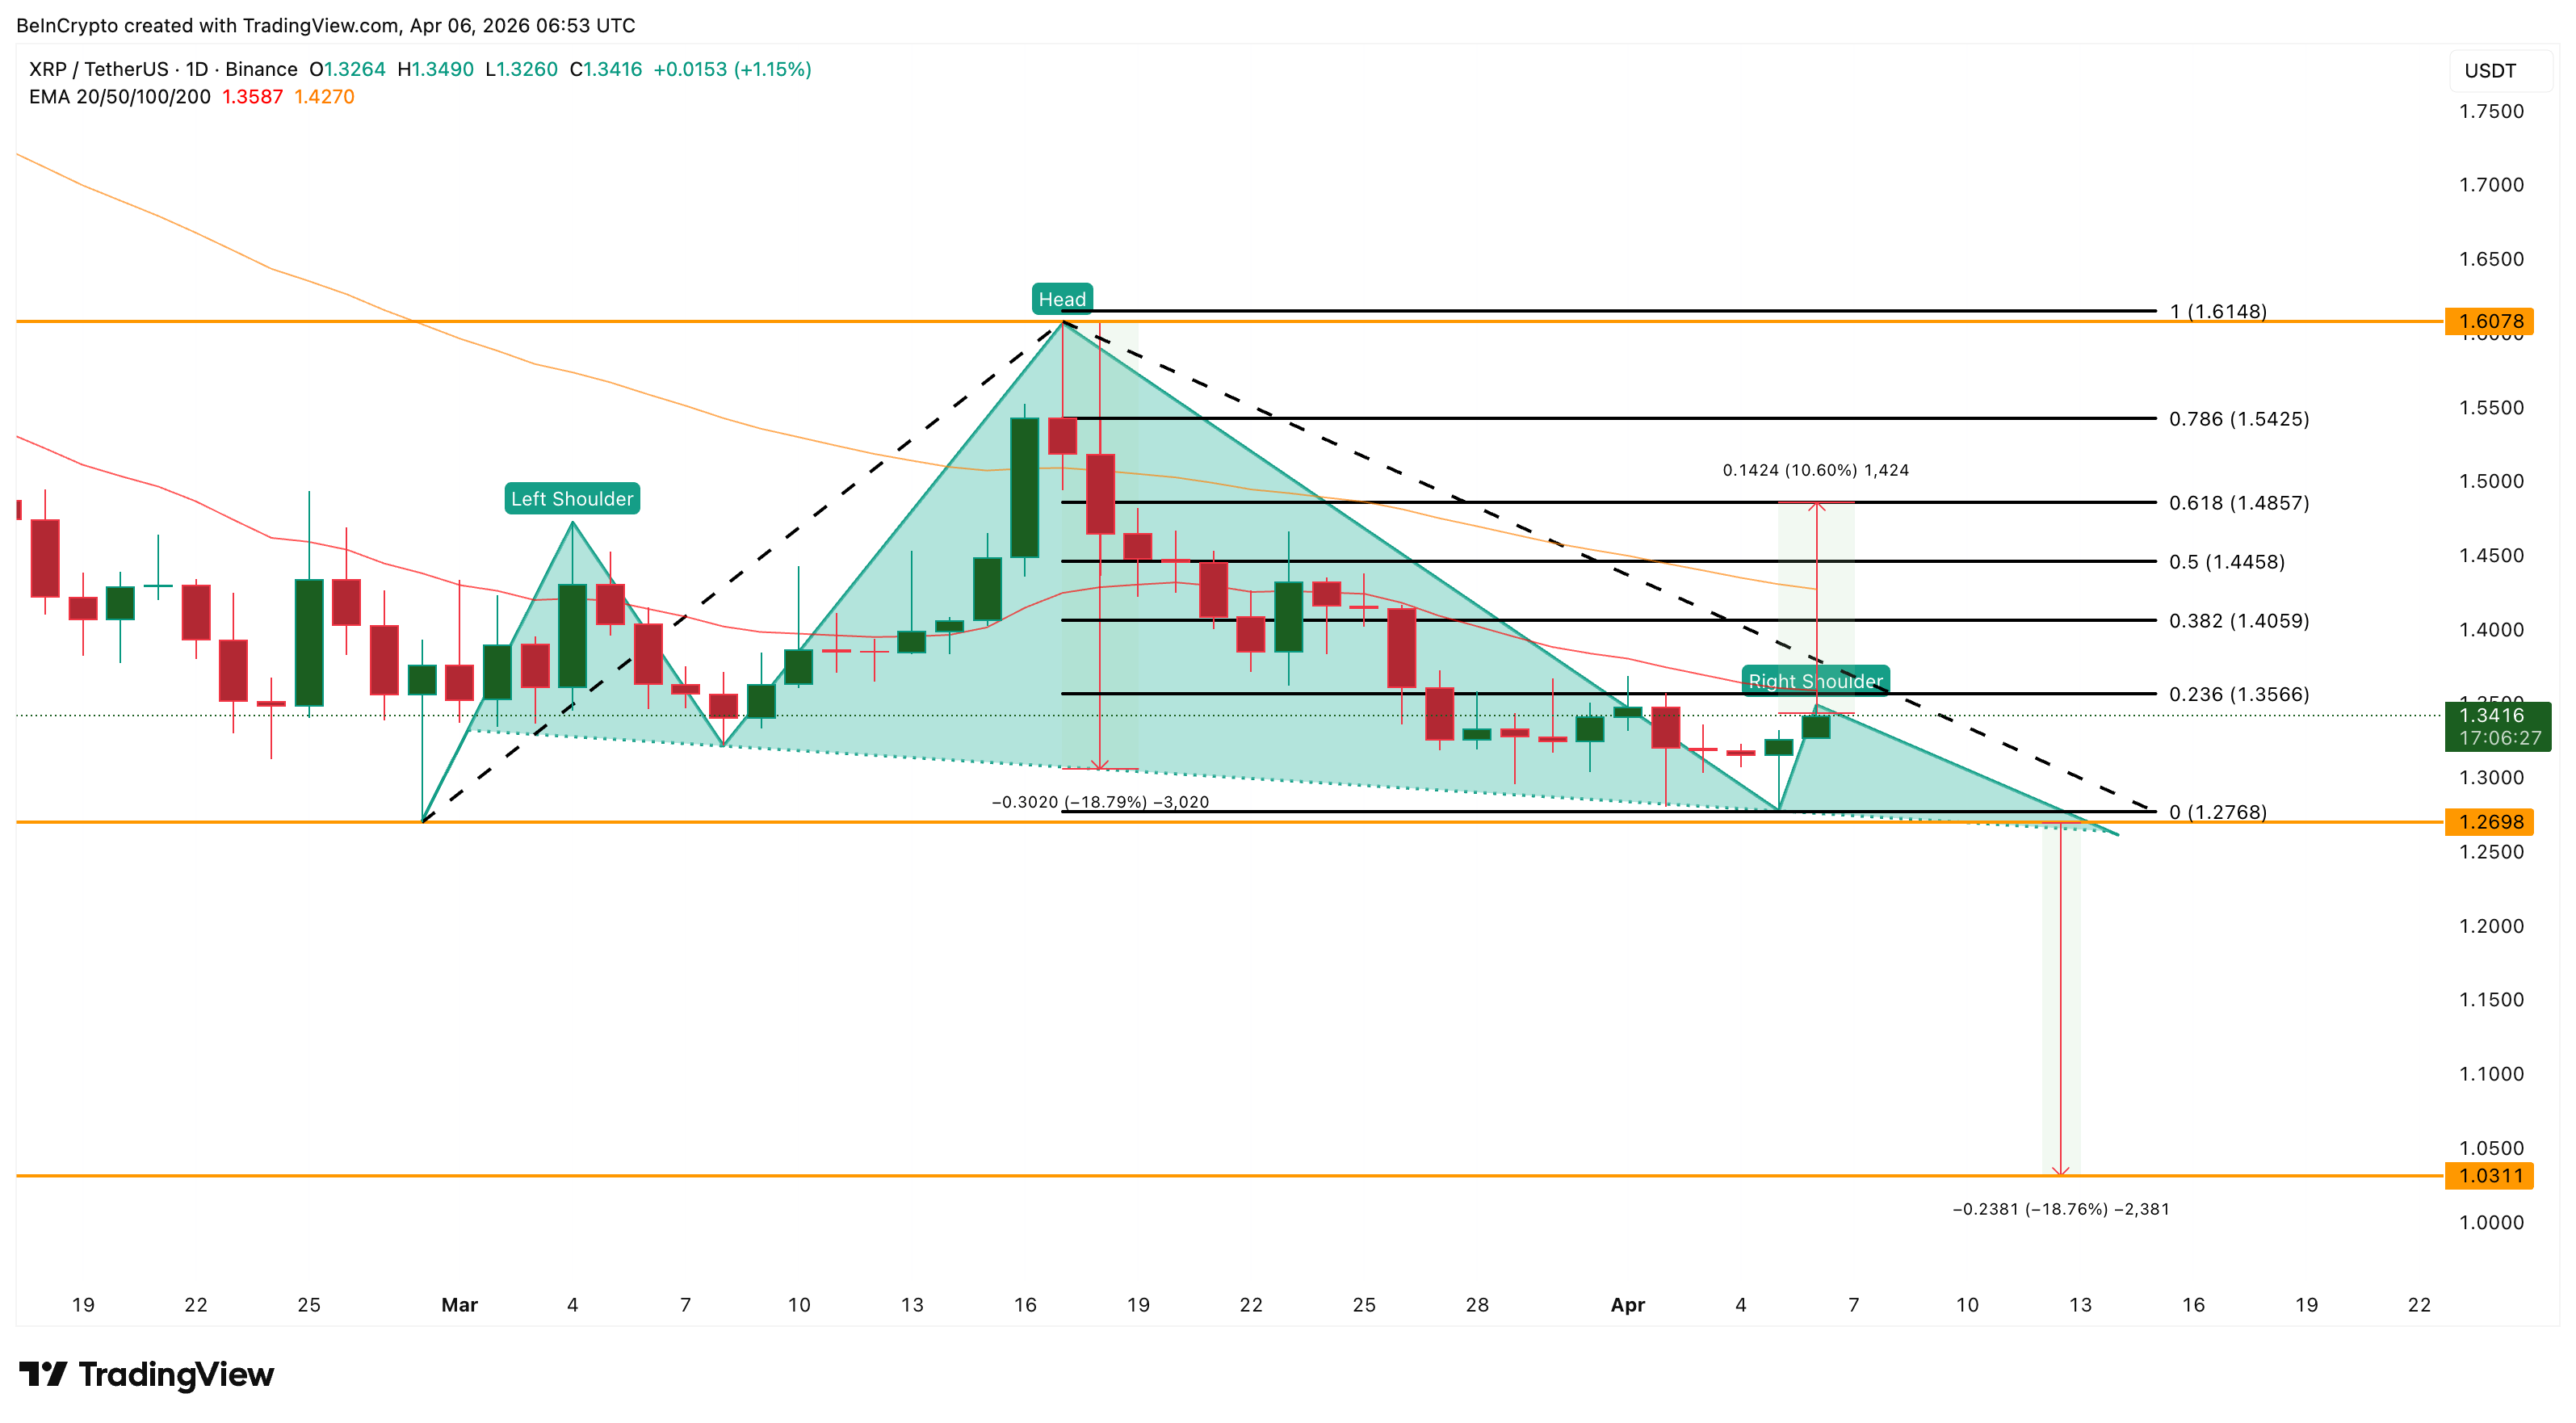
The daily chart shows a clear head and shoulders structure. The left shoulder formed in late February, the head peaked near $1.60 in mid-March, and the right shoulder is currently developing as XRP price consolidates around $1.33. The neckline sits near $1.26. A confirmed break below that level would activate a near 19% measured move.
Before the bearish pattern can be invalidated, XRP needs to reclaim two Exponential Moving Averages (EMAs), which are trend indicators that give greater weight to recent price action. The 20-day EMA sits at $1.35 and the 50-day at $1.42. The last clean reclaim of the 20-day EMA happened on March 13, after which prices rallied 15.26% and also recaptured the 50-day.
Want more token insights like this? Sign up for Editor Harsh Notariya’s Daily Crypto Newsletter here.
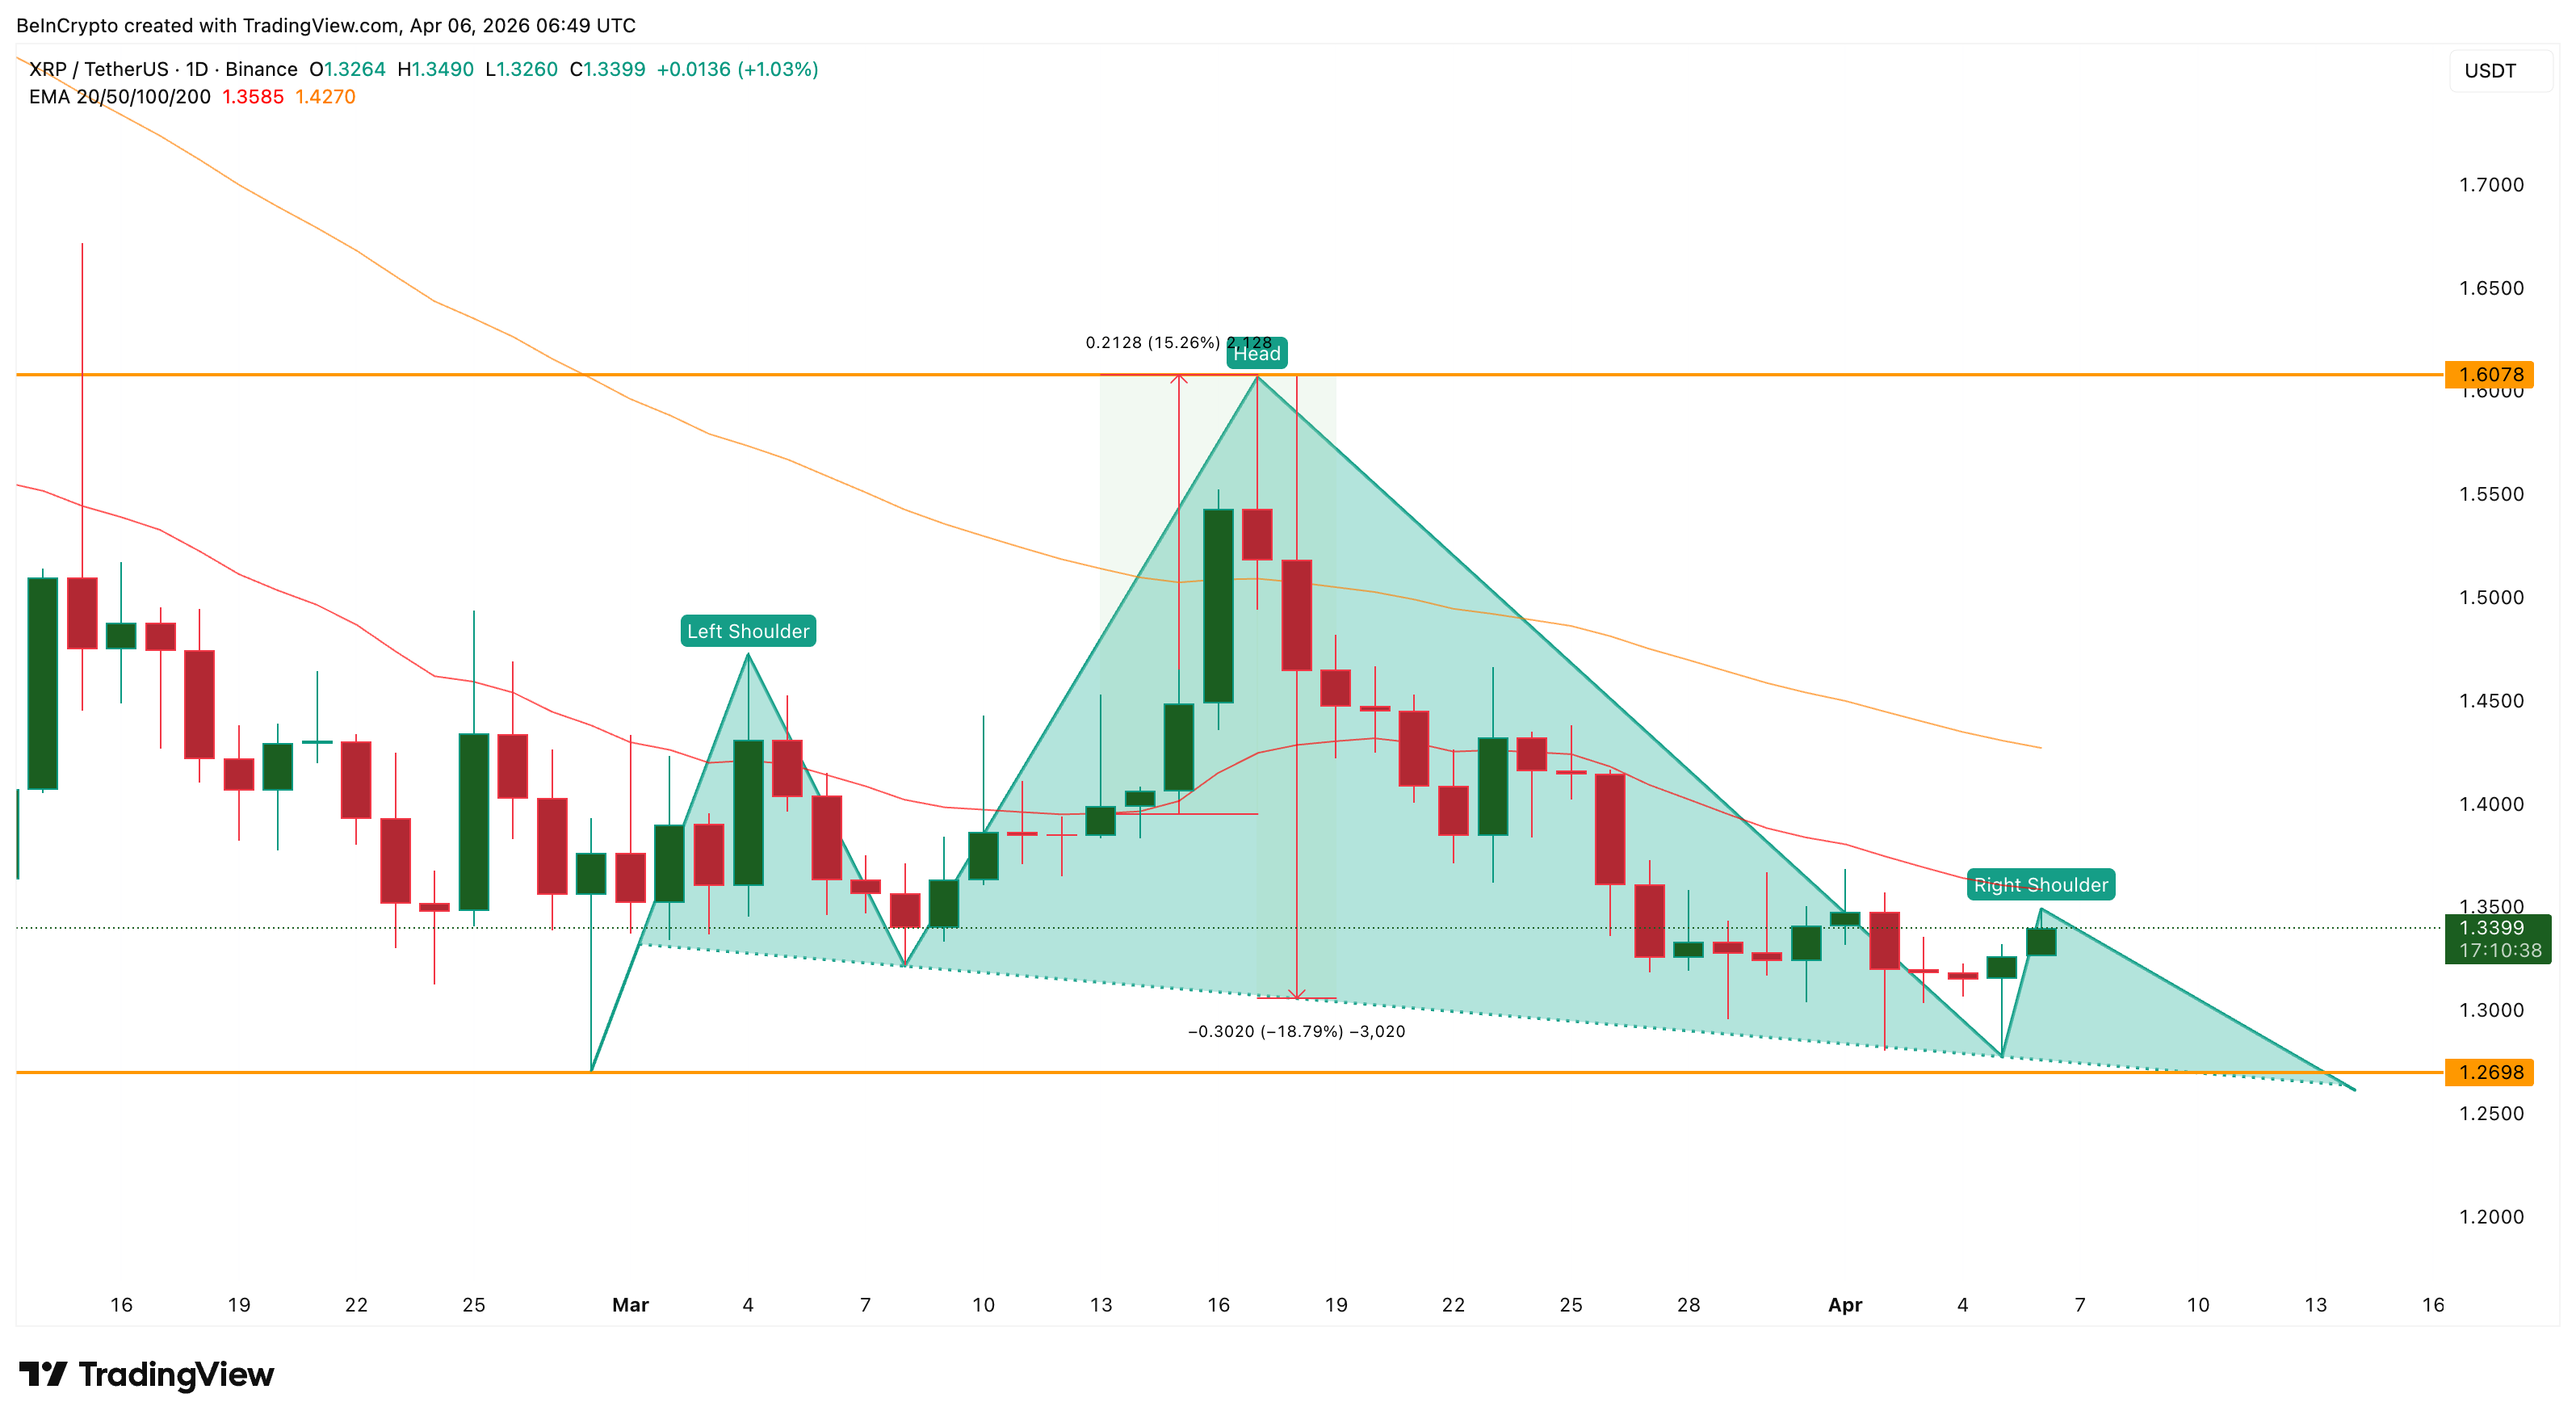
A daily close above $1.35 would reclaim the 20-day EMA and provide the first signal of short-term strength. However, any price peak that stays below the head at $1.60 remains inside the head and shoulders structure and risks forming the right shoulder rather than breaking the pattern. The supply data reveals exactly where the resistance begins (as the shoulder develops) and why absorbing it will be difficult.
1.2 Billion Tokens and Fading Conviction
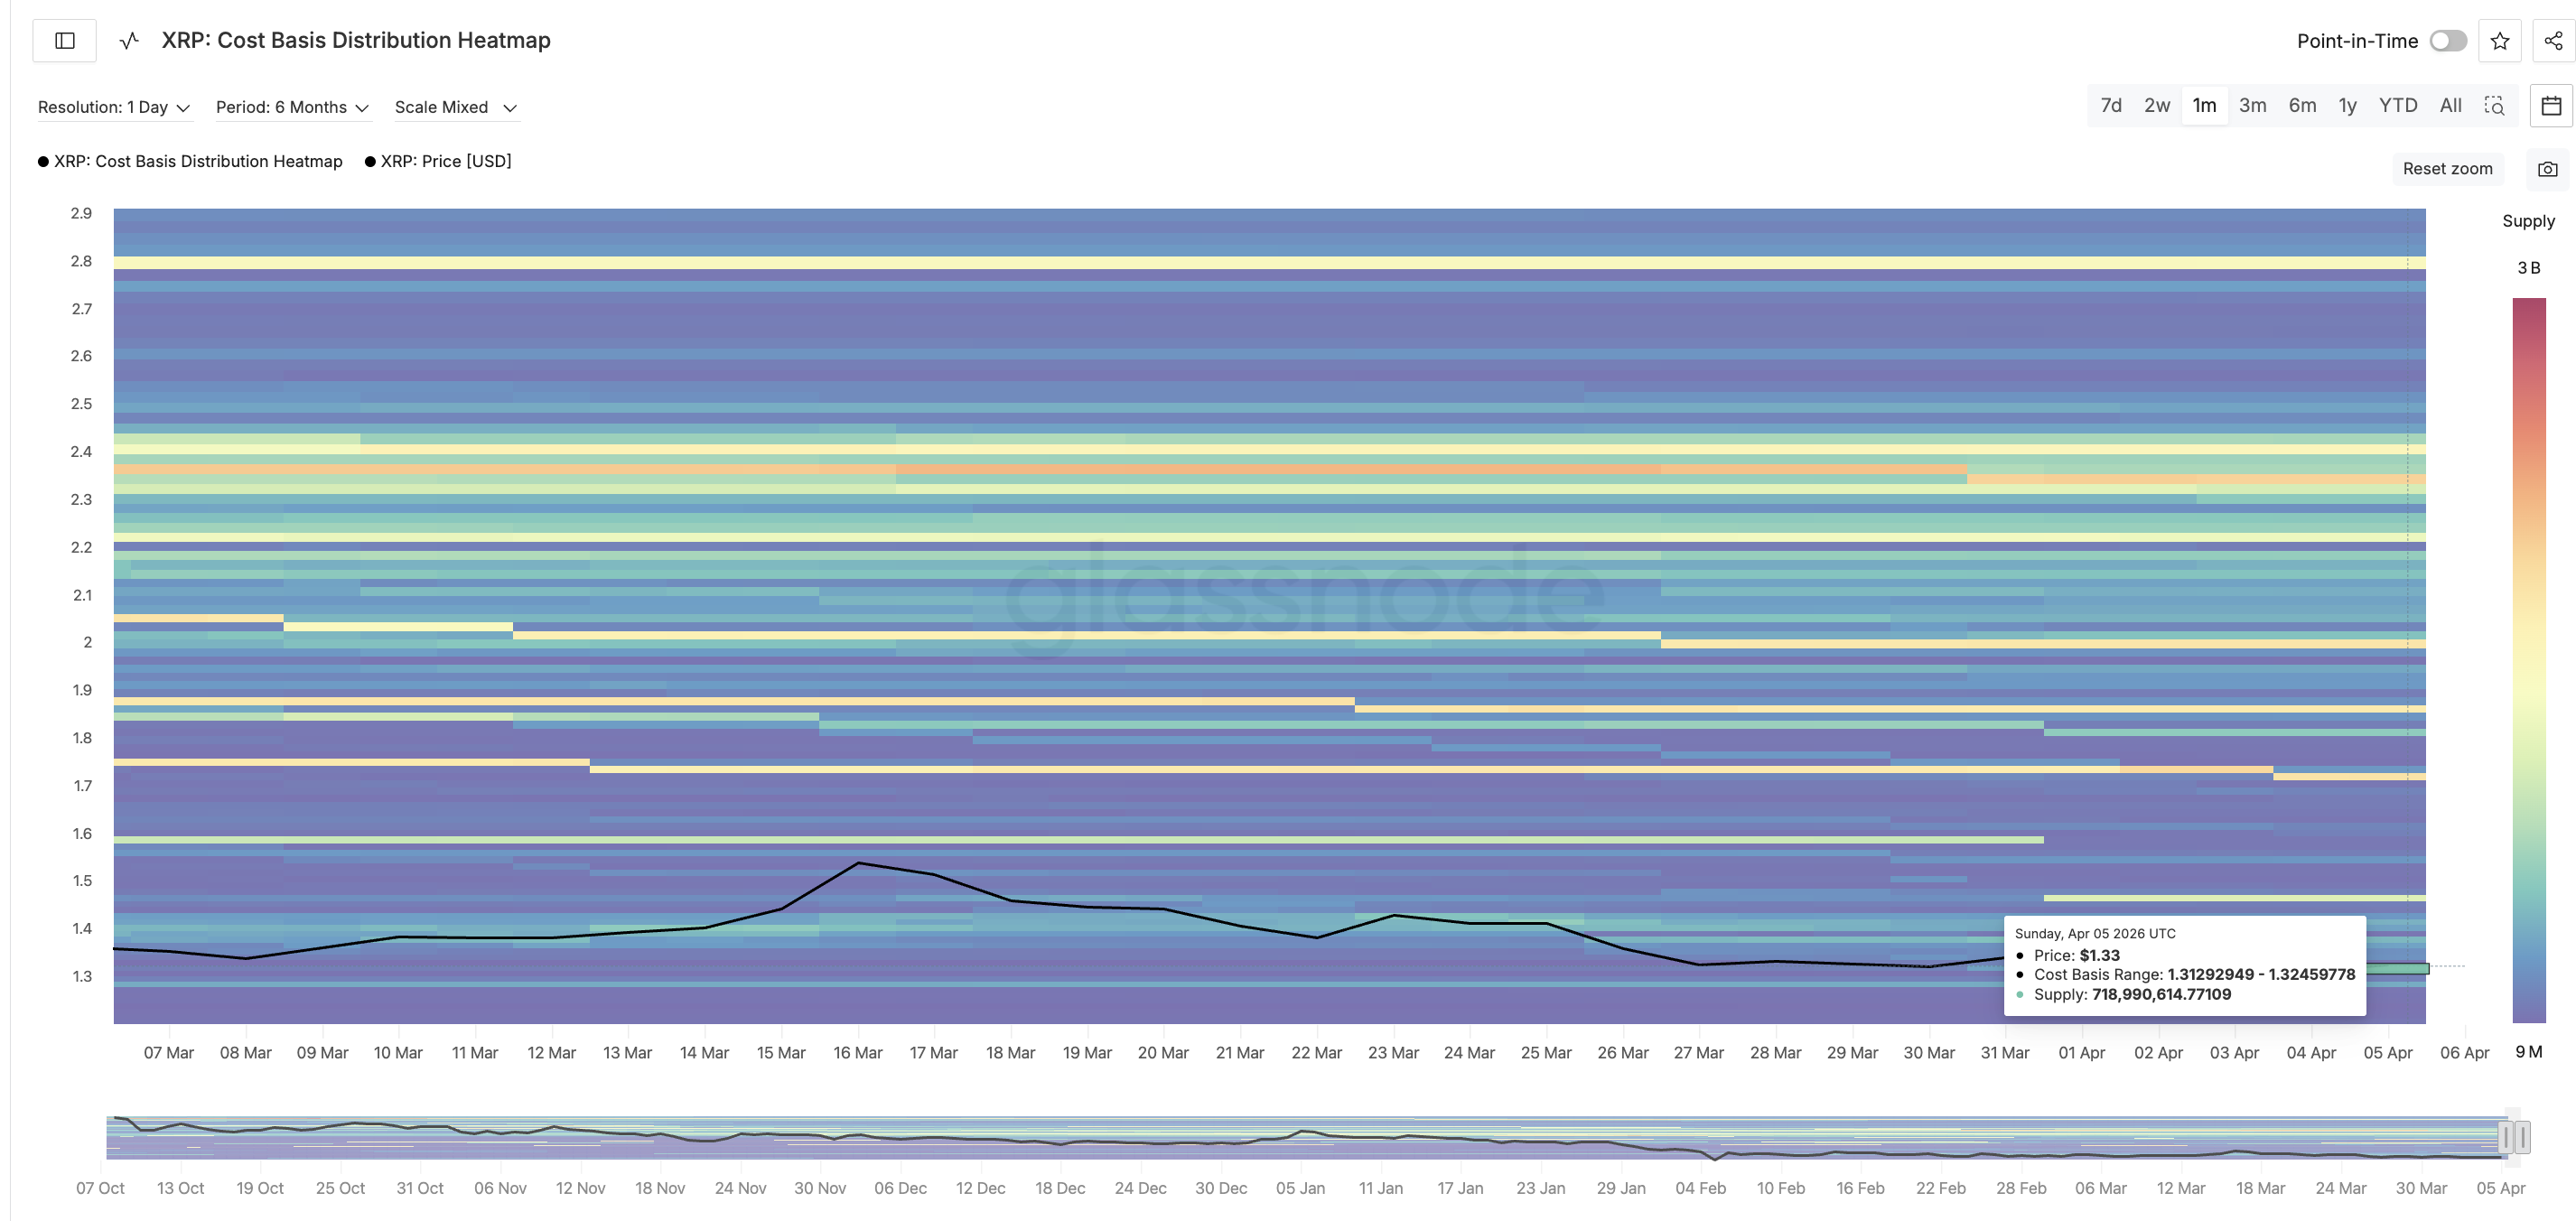
The Cost Basis Distribution Heatmap, which maps how much XRP supply was last acquired at each price level, identifies two critical clusters that frame the current setup.
The first sits between $1.31 and $1.32, where approximately 719 million XRP has its cost basis. This cluster acts as the floor supporting the right shoulder. As long as these holders remain confident and do not sell, the XRP price maintains its current level.
If this cluster begins distributing, the right shoulder would erode quickly and the neckline at $1.26 comes under direct threat.
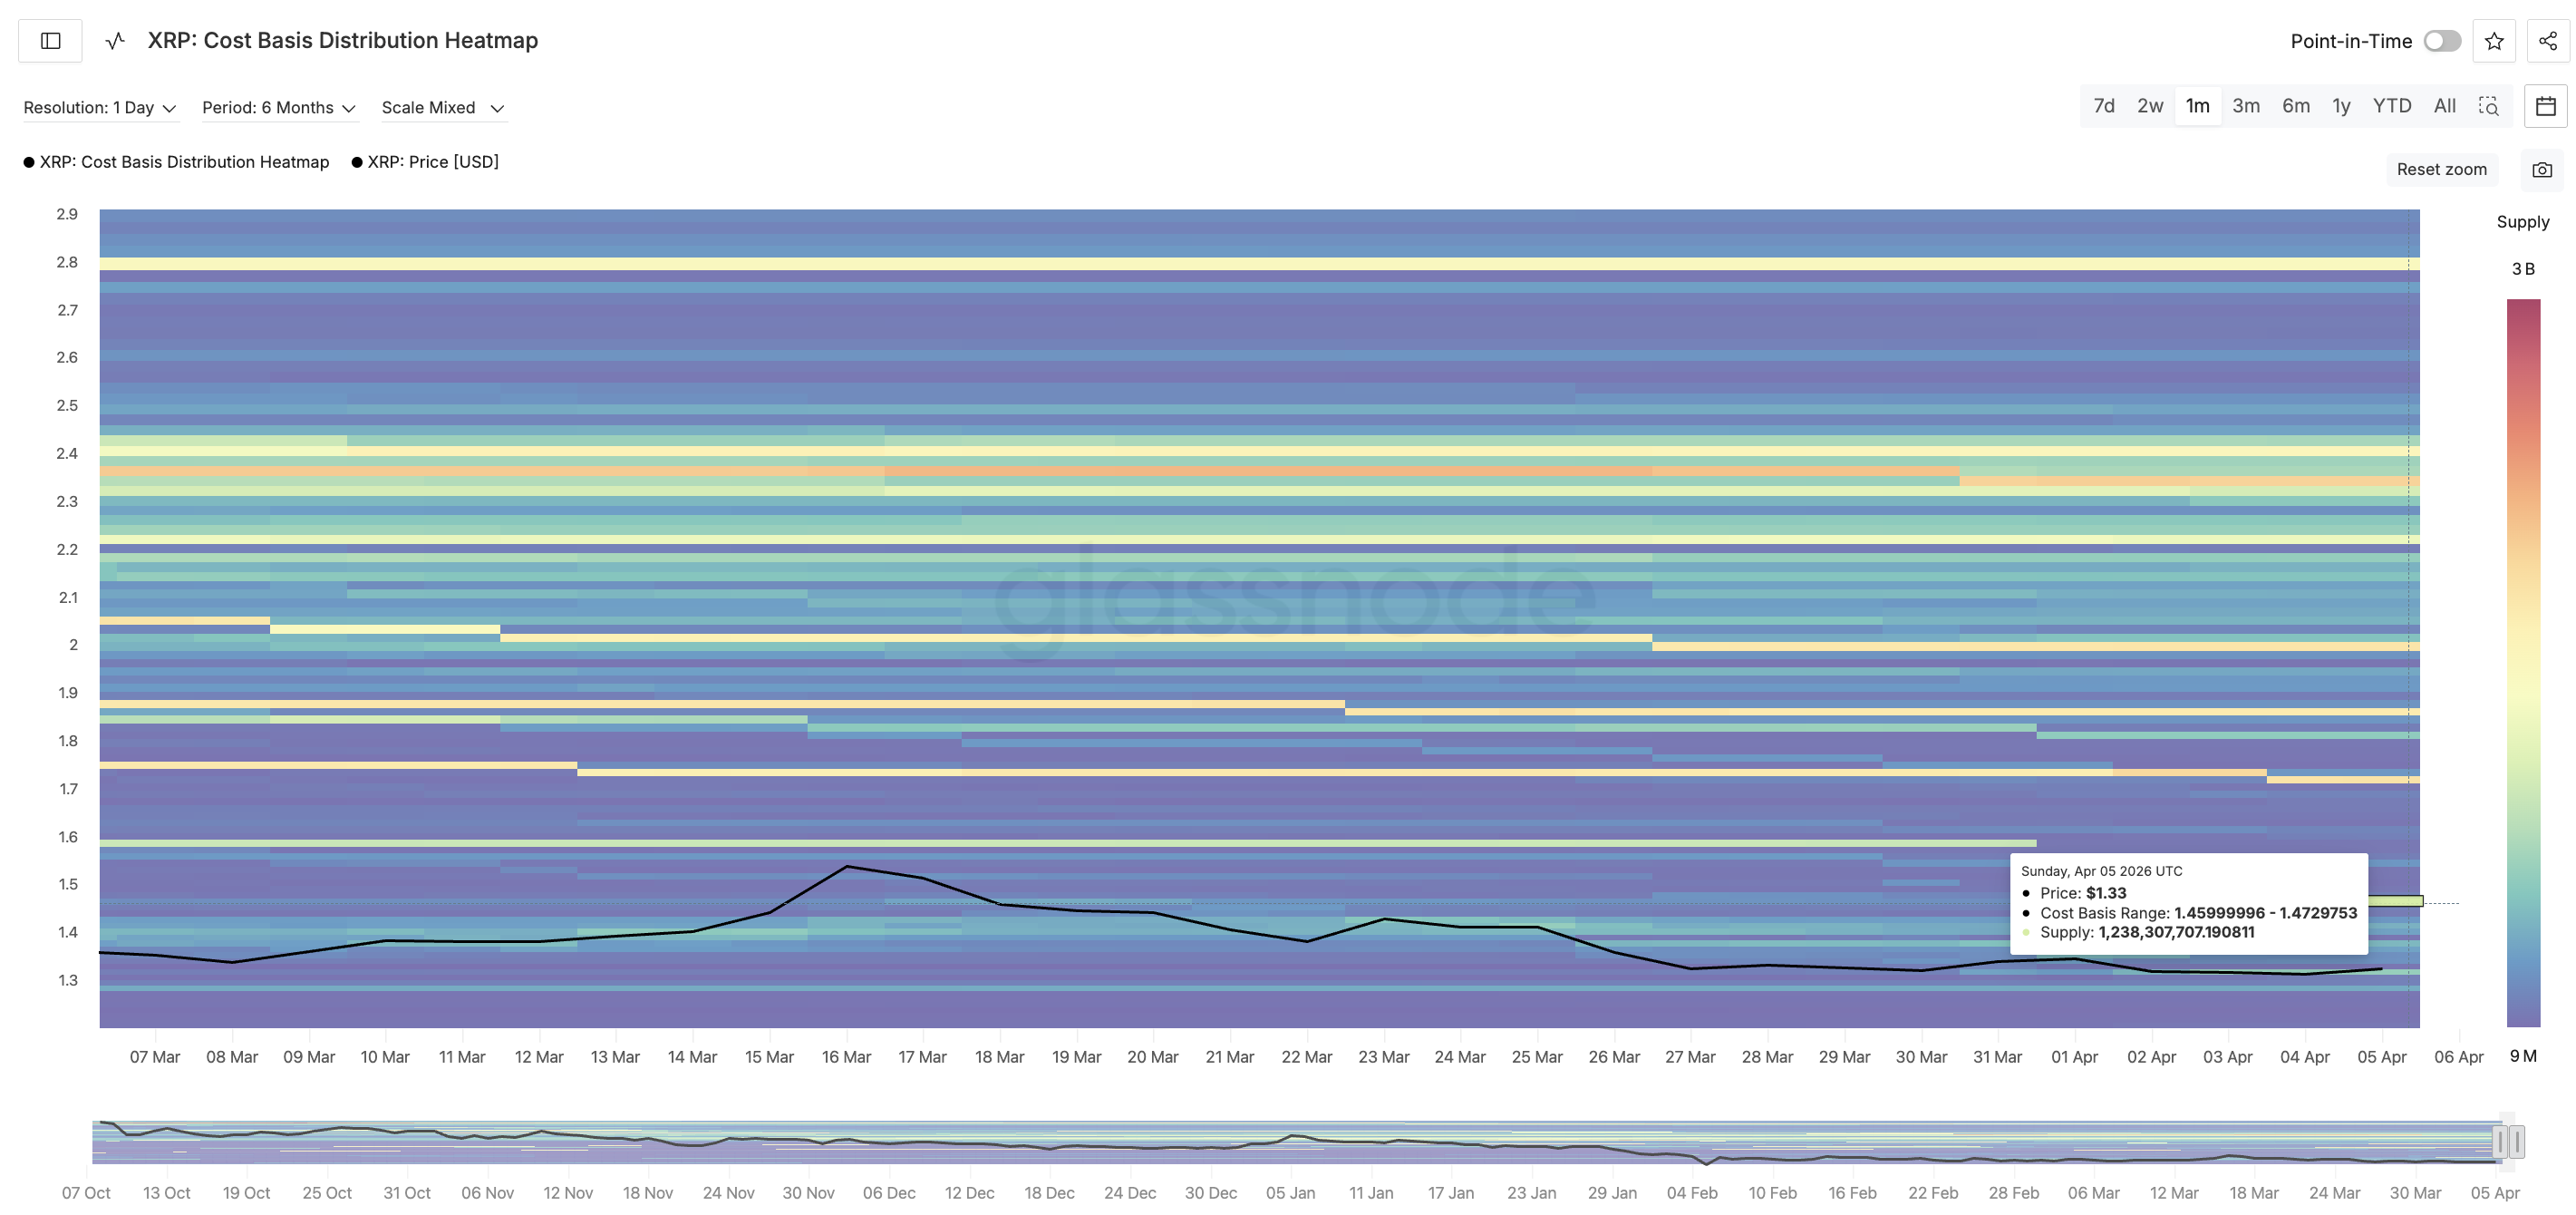
The second and larger cluster sits between $1.45 and $1.47, holding approximately 1.24 billion XRP. This is the overhead wall that any meaningful rally must absorb. These holders acquired their positions at higher prices. And they might look to exit at or near breakeven if price approaches their cost basis. Pushing through 1.24 billion tokens worth of potential selling pressure requires sustained and aggressive buying.
The Exchange Net Position Change, which tracks whether tokens are moving onto or off exchanges, reveals whether that buying power exists. A negative reading means more XRP is leaving exchanges than entering, which signals accumulation. The metric peaked at approximately -117 million XRP around late March, indicating strong buying conviction. By April 5, it had dropped to -57 million XRP, a decline of roughly 51%.
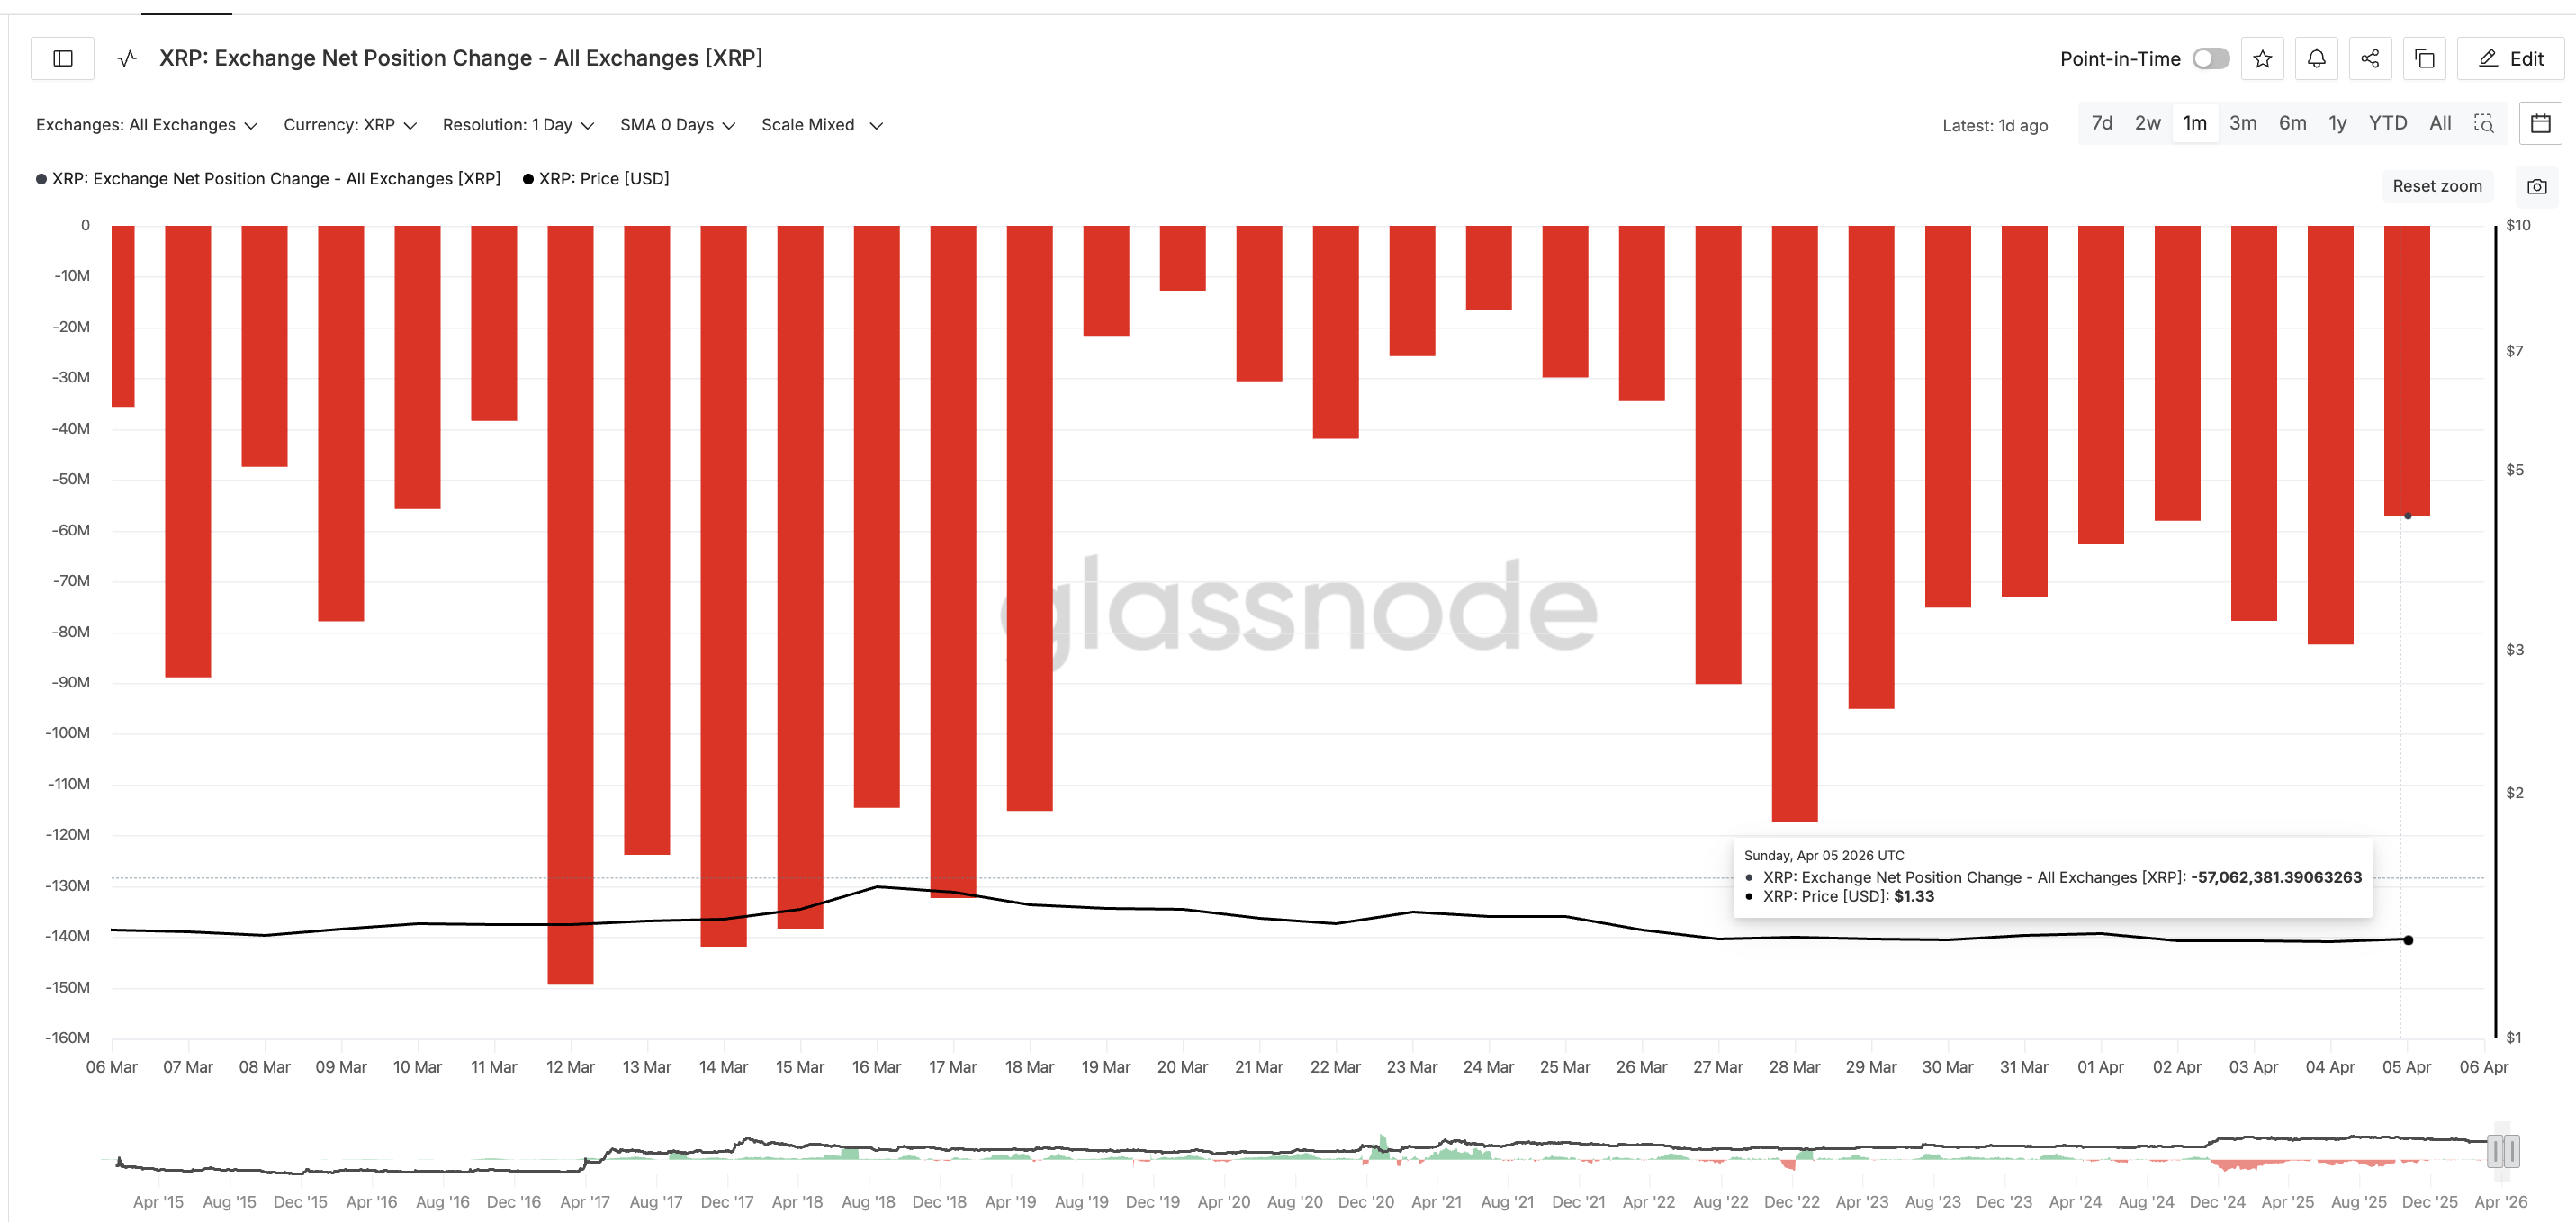
The buying pressure that supported the mid-March rally has halved. With 1.24 billion tokens sitting overhead and only half the exchange conviction remaining, the math for absorbing the supply wall becomes significantly harder. If no fresh buying power arrives, the right shoulder could finalize near this $1.45-$1.47 supply cluster zone.
XRP Price Levels Between a Breakout and a Breakdown
The daily price chart with technical levels from the completed swing frames every critical level.
The first hurdle is $1.35, the 0.236 level that closely aligns with the 20-day EMA. A daily close above this would mirror the March 13 reclaim that preceded a 15% rally. Above that, $1.40 and $1.44 come into focus, with $1.48 at the 0.618 level acting as the key confirmation. A close above $1.48 would mean that the 1.24 billion token cluster between $1.45 and $1.47 did not sell or that their selling pressure was absorbed by new demand.
The XRP price would only show genuine strength above $1.60, the head of the pattern. A reclaim of the head would fully invalidate the head and shoulders and shift the structure from bearish to bullish.
On the downside, a failure to reclaim $1.35 keeps the right shoulder intact and $1.26-$1.27 remains directly at risk. A confirmed break below the neckline at $1.26 would activate the 19% measured move and project a drop toward $1.03.
A daily close above $1.48 confirms the rally absorbed the 1.2 billion token wall. That shifts XRP price toward a potential head invalidation. However, a break below $1.26 confirms the pattern and opens a path toward $1.03.
The post XRP Price Rally Needs to Absorb 1.2 Billion Tokens, but Buying Power Is Fading appeared first on BeInCrypto.