
Siren (SIREN), the AI-powered DeFi agent token on BNB Chain, surged 156% on March 22 to an all-time high of $2.57. Two on-chain signals explain this move and where the price might be heading.
The rally extends a broader run that has seen SIREN gain over 630% in 30 days, fueled by renewed interest in AI-narrative tokens and the launch of perpetual futures, which amplified buying through short squeezes.
Overbought Conditions at Every Prior SIREN Top
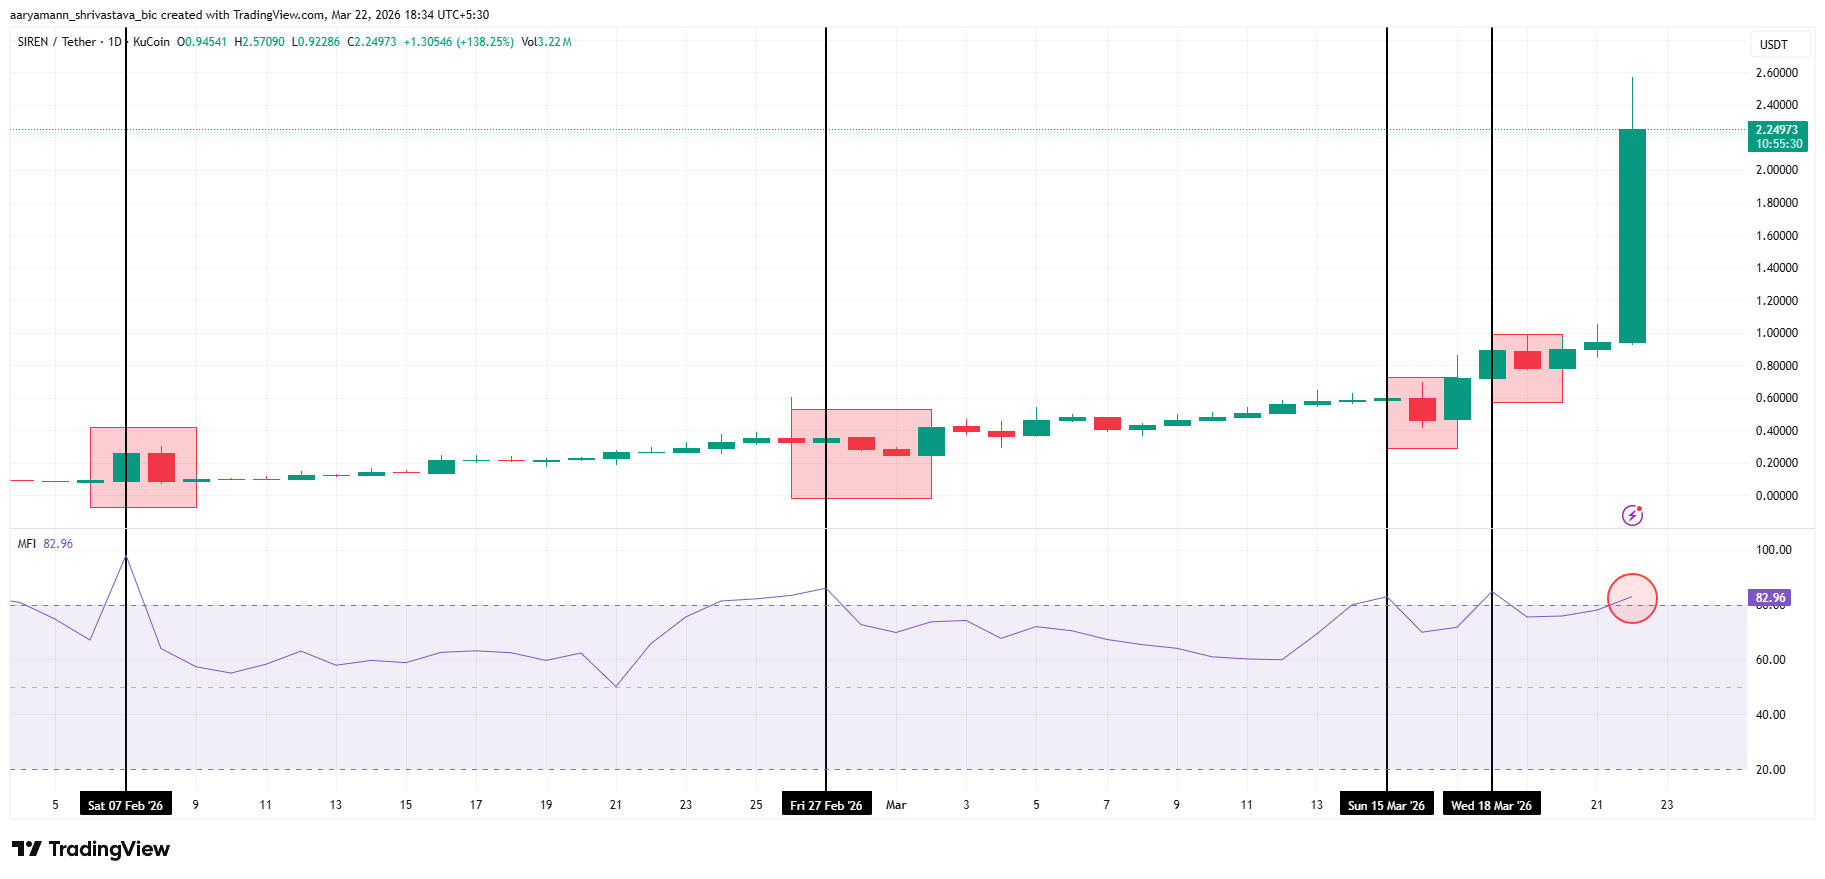
The Money Flow Index (MFI) is at 82.96 — well above the 80-level threshold that defines overbought territory. A circle is drawn on the indicator at the current reading, highlighting the signal.
Critically, the chart shows vertical black lines marking three prior turning points: February 7, February 27, and March 15. The MFI spiked sharply at each of those dates before the price sold off. In each case, the MFI spike preceded a multi-day correction.
The current MFI reading of 82.96 on March 22 mirrors the pattern at those three prior tops — elevated money flow coinciding with a price spike and large-body candle — raising the question of whether this is a fourth turning point rather than the start of sustained price discovery.
Want more token insights like this? Sign up for Editor Harsh Notariya’s Daily Crypto Newsletter here.
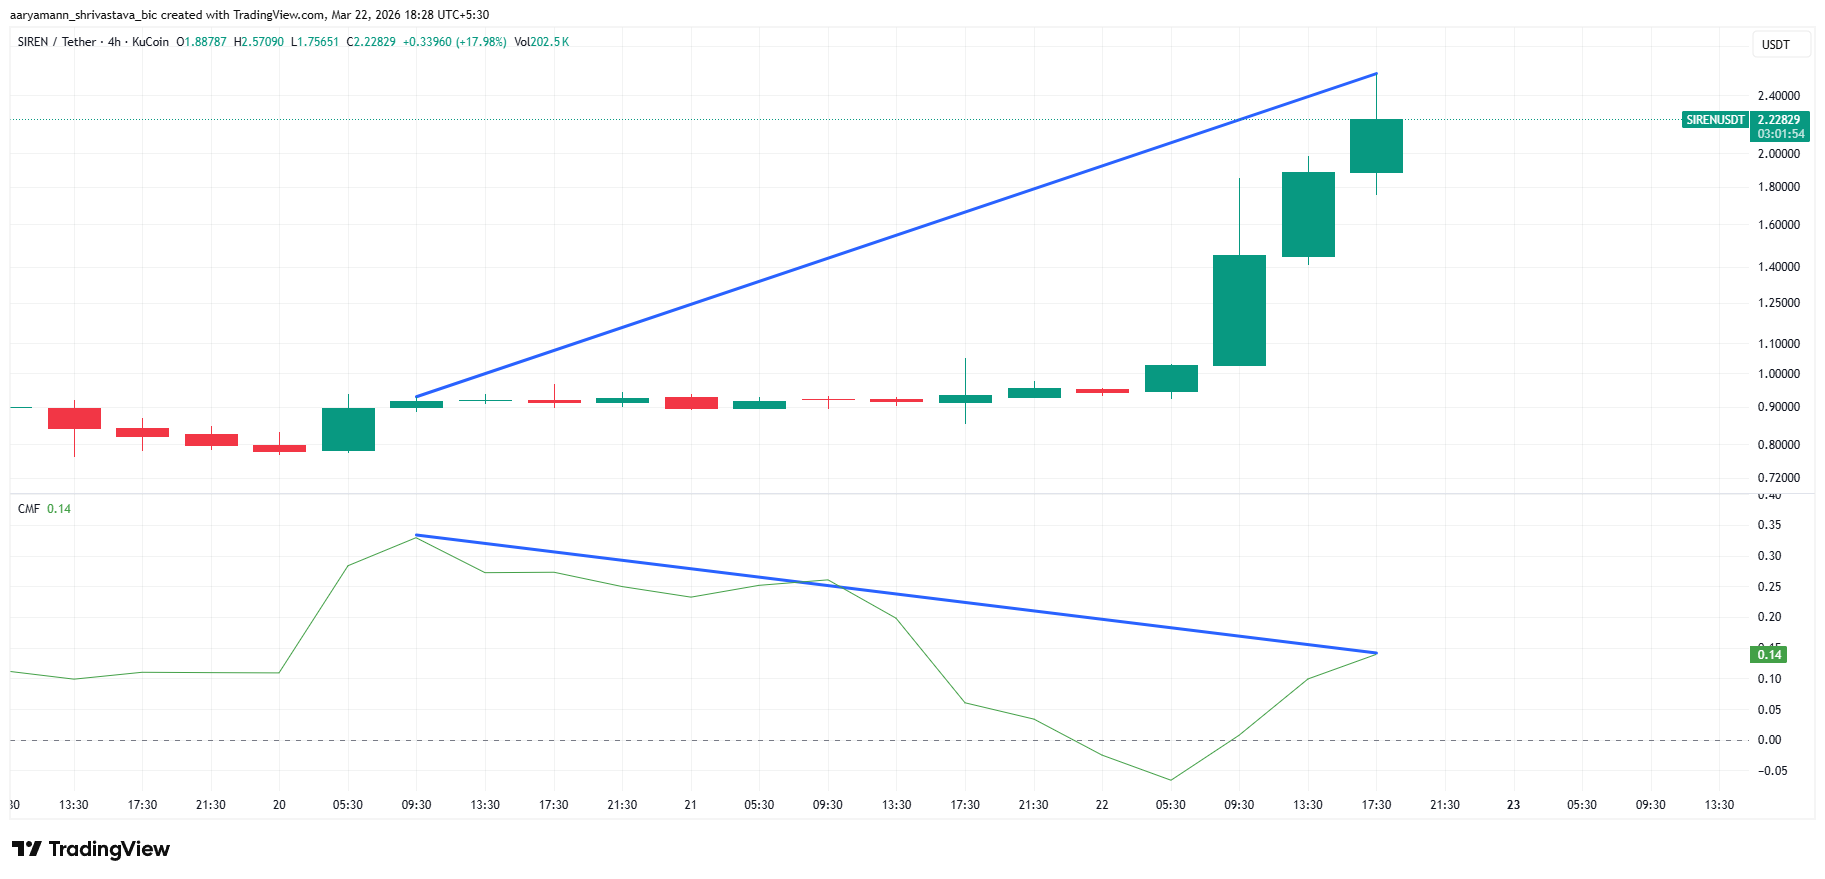
The Chaikin Money Flow (CMF) indicator tells a similar story. A descending blue trendline on the CMF panel connects the indicator’s high near 0.35 around March 20 to its current reading of 0.14 on March 22. As price made new highs, CMF made lower highs — a textbook bearish divergence.
CMF at 0.14 remains positive, indicating net buying pressure still exceeds selling pressure. However, the deteriorating trend in money flow during the sharpest phase of the rally suggests that each successive price candle required less genuine capital inflow.
This is a sign of thinning buying conviction rather than accelerating demand. Bearish CMF divergence during a parabolic move frequently precedes a sharp mean-reversion once momentum exhausts.
SIREN Price Hits $2.50
SIREN’s 156% rally over the last 24 hours was driven by speculation, as no solid inflows are supporting the rise.
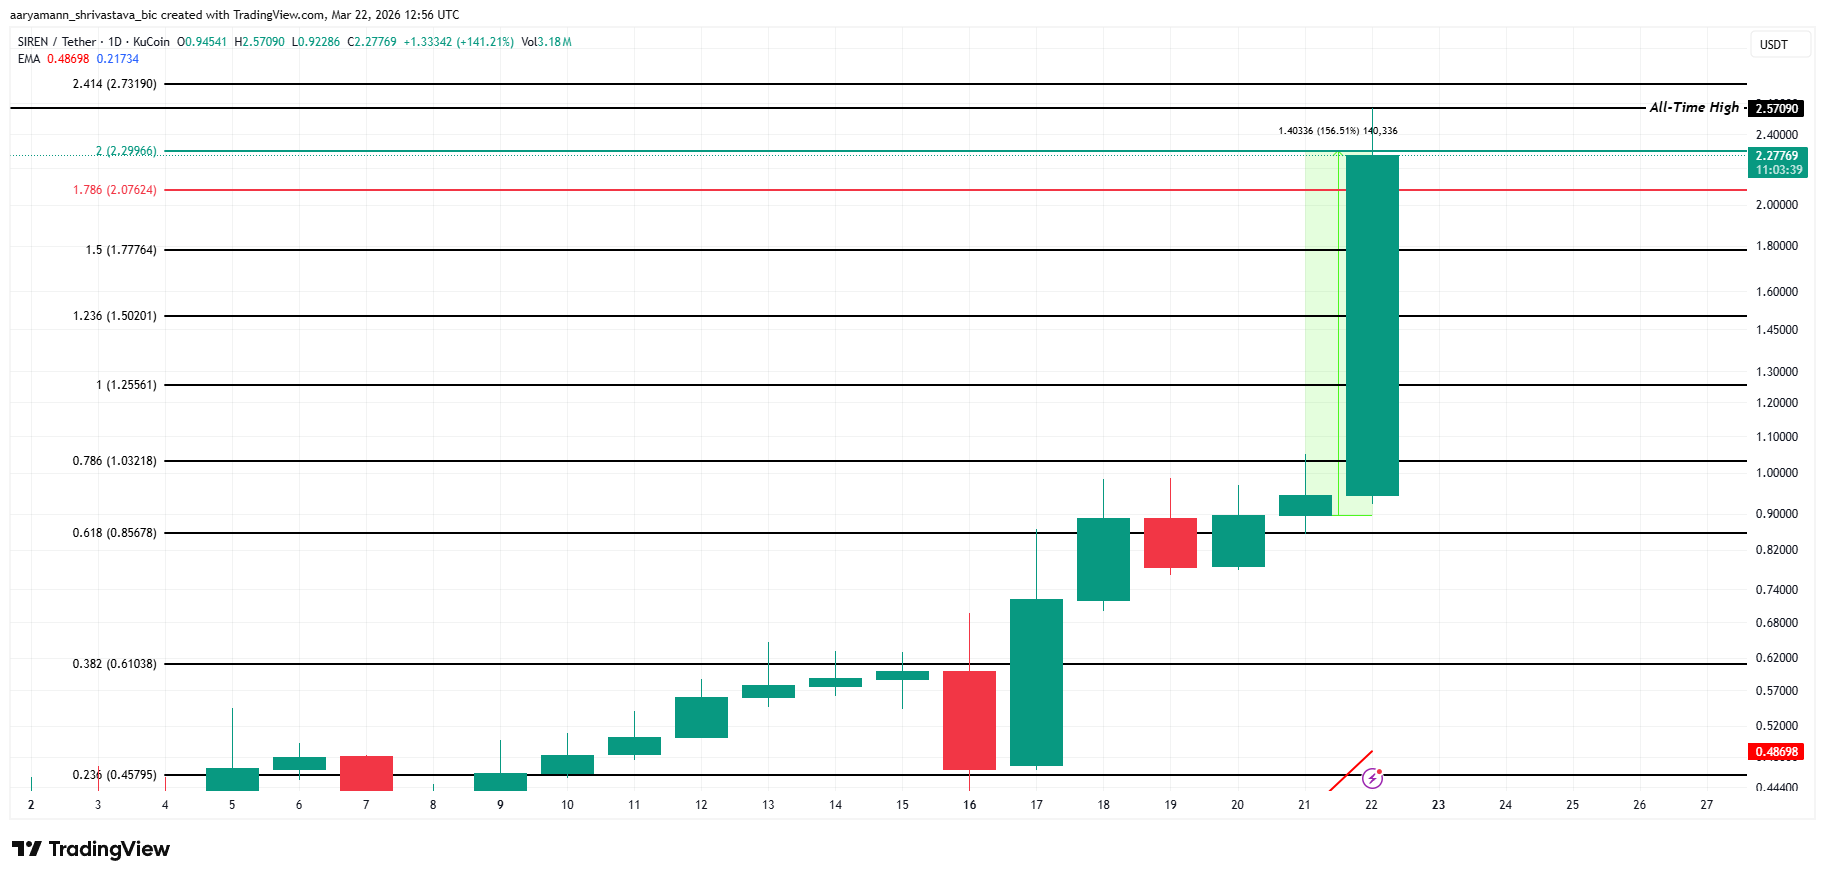
The Fibonacci extension chart places the 1.786 level at $2.07 — the first meaningful retracement support after the spike to $2.57 exceeded the 2.0 extension at $2.29.
Failure to hold $2.07 opens the path toward $1.77 and then $1.50.
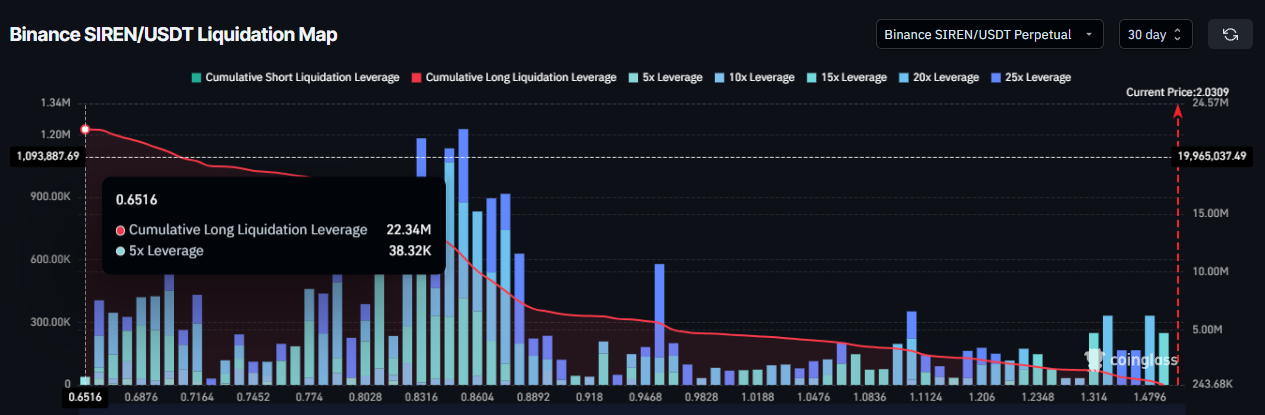
The Coinglass liquidation map shows $22.34 million in cumulative long liquidations stacked at $0.65.
Between $1.31 and $0.65, there is virtually no long liquidation resistance — meaning any breakdown through $1.31 would likely accelerate toward that zone with little structural support to slow it.
On the other hand, MFI at 82.96 and CMF divergence have preceded every prior correction in this token’s history. Holding above $2.07 keeps the bullish structure intact.
Losing it points to $1.50, while the liquidation map points to $0.65.
The post Why is SIREN Price Suddenly Up More Than 150%, and Will It Last? appeared first on BeInCrypto.