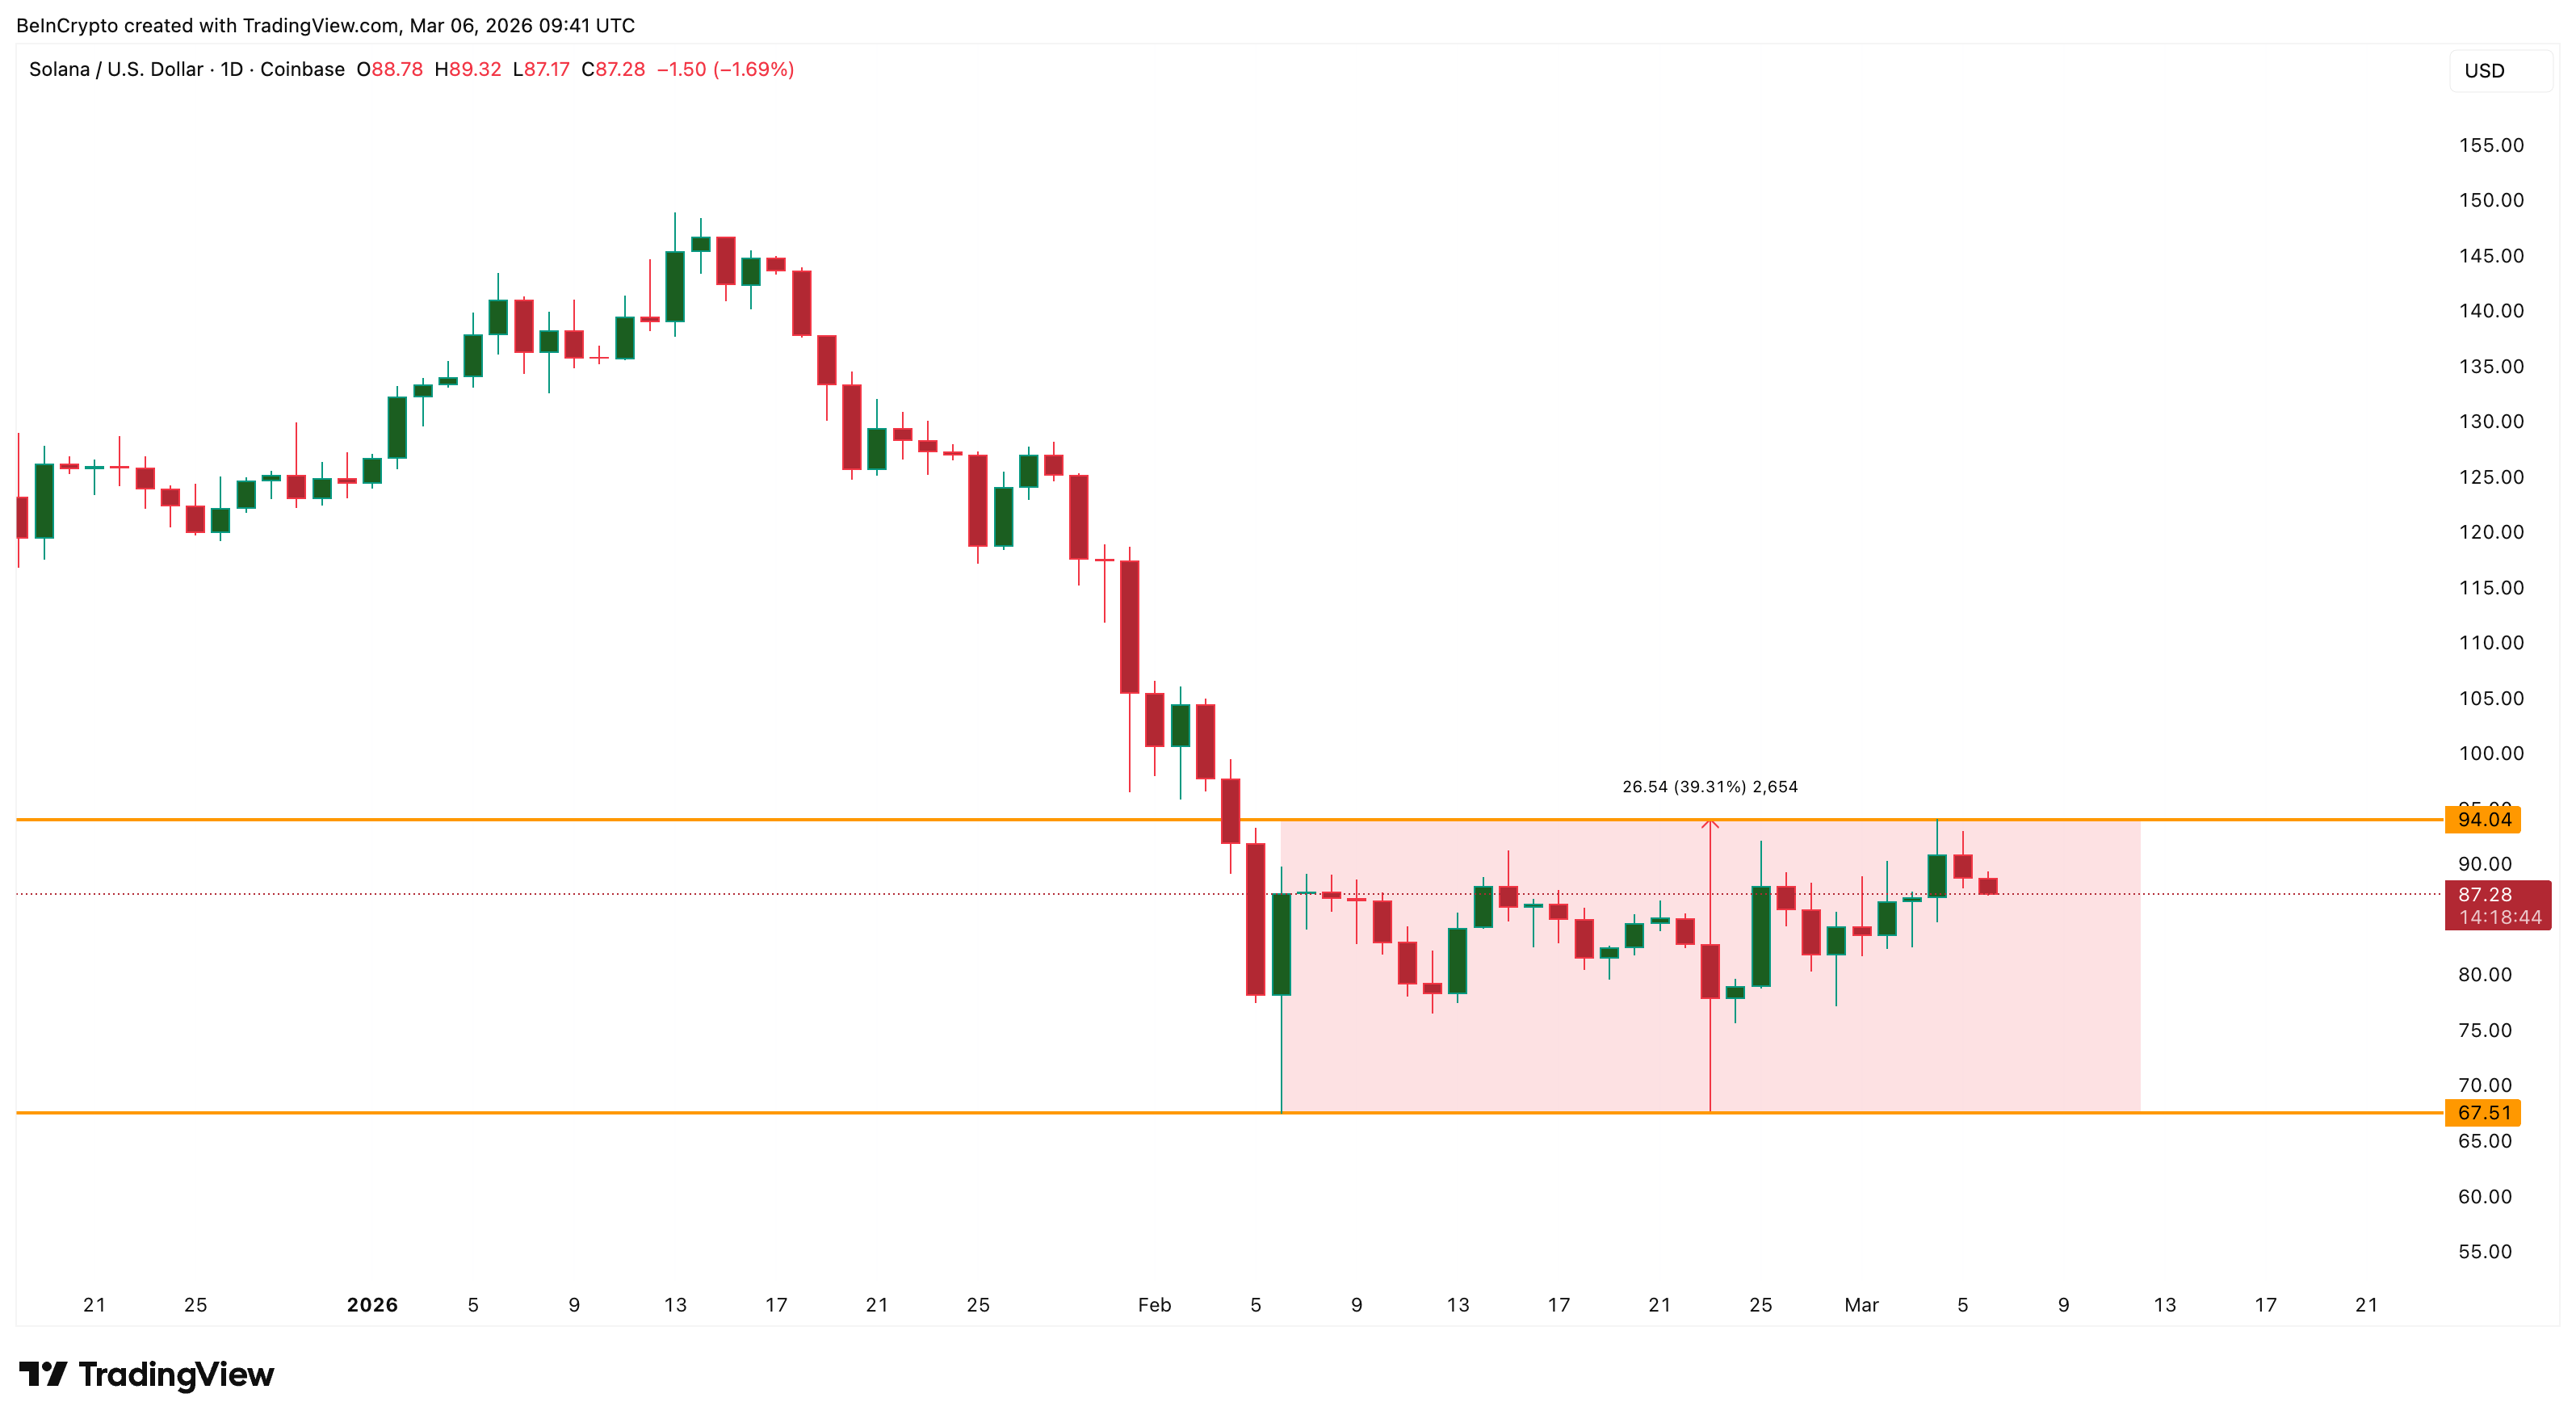
The Solana price chart suggests weakness at first glance. The token remains down roughly 10% month-on-month, reflecting the broader cooling in the crypto market. However, that headline number hides an important detail. Between February 6 and March 4, Solana staged a sharp recovery. The asset rallied from nearly $67 to $94, marking a surge of almost 40% in less than a month.
Yet the rally carried a warning sign. Some of Solana’s most committed investors did not appear convinced by the move. That lack of conviction now intersects with a fresh technical signal, creating a setup where a pullback could follow.
The Rally to $94 Failed to Convince Its Oldest Holders
Long-term holders often provide the strongest support during rallies. When these investors accumulate as prices rise, it usually signals deep confidence in the trend. But Solana’s recent rally tells a different story.
Data from HODL Waves, a metric segregating cohorts by time held, shows that holders who have held SOL for three years or longer controlled about 9.77% of the supply on February 3. As the rally began on February 6, these investors started reducing their holdings from February 8 onward.
Want more token insights like this? Sign up for Editor Harsh Notariya’s Daily Crypto Newsletter here.
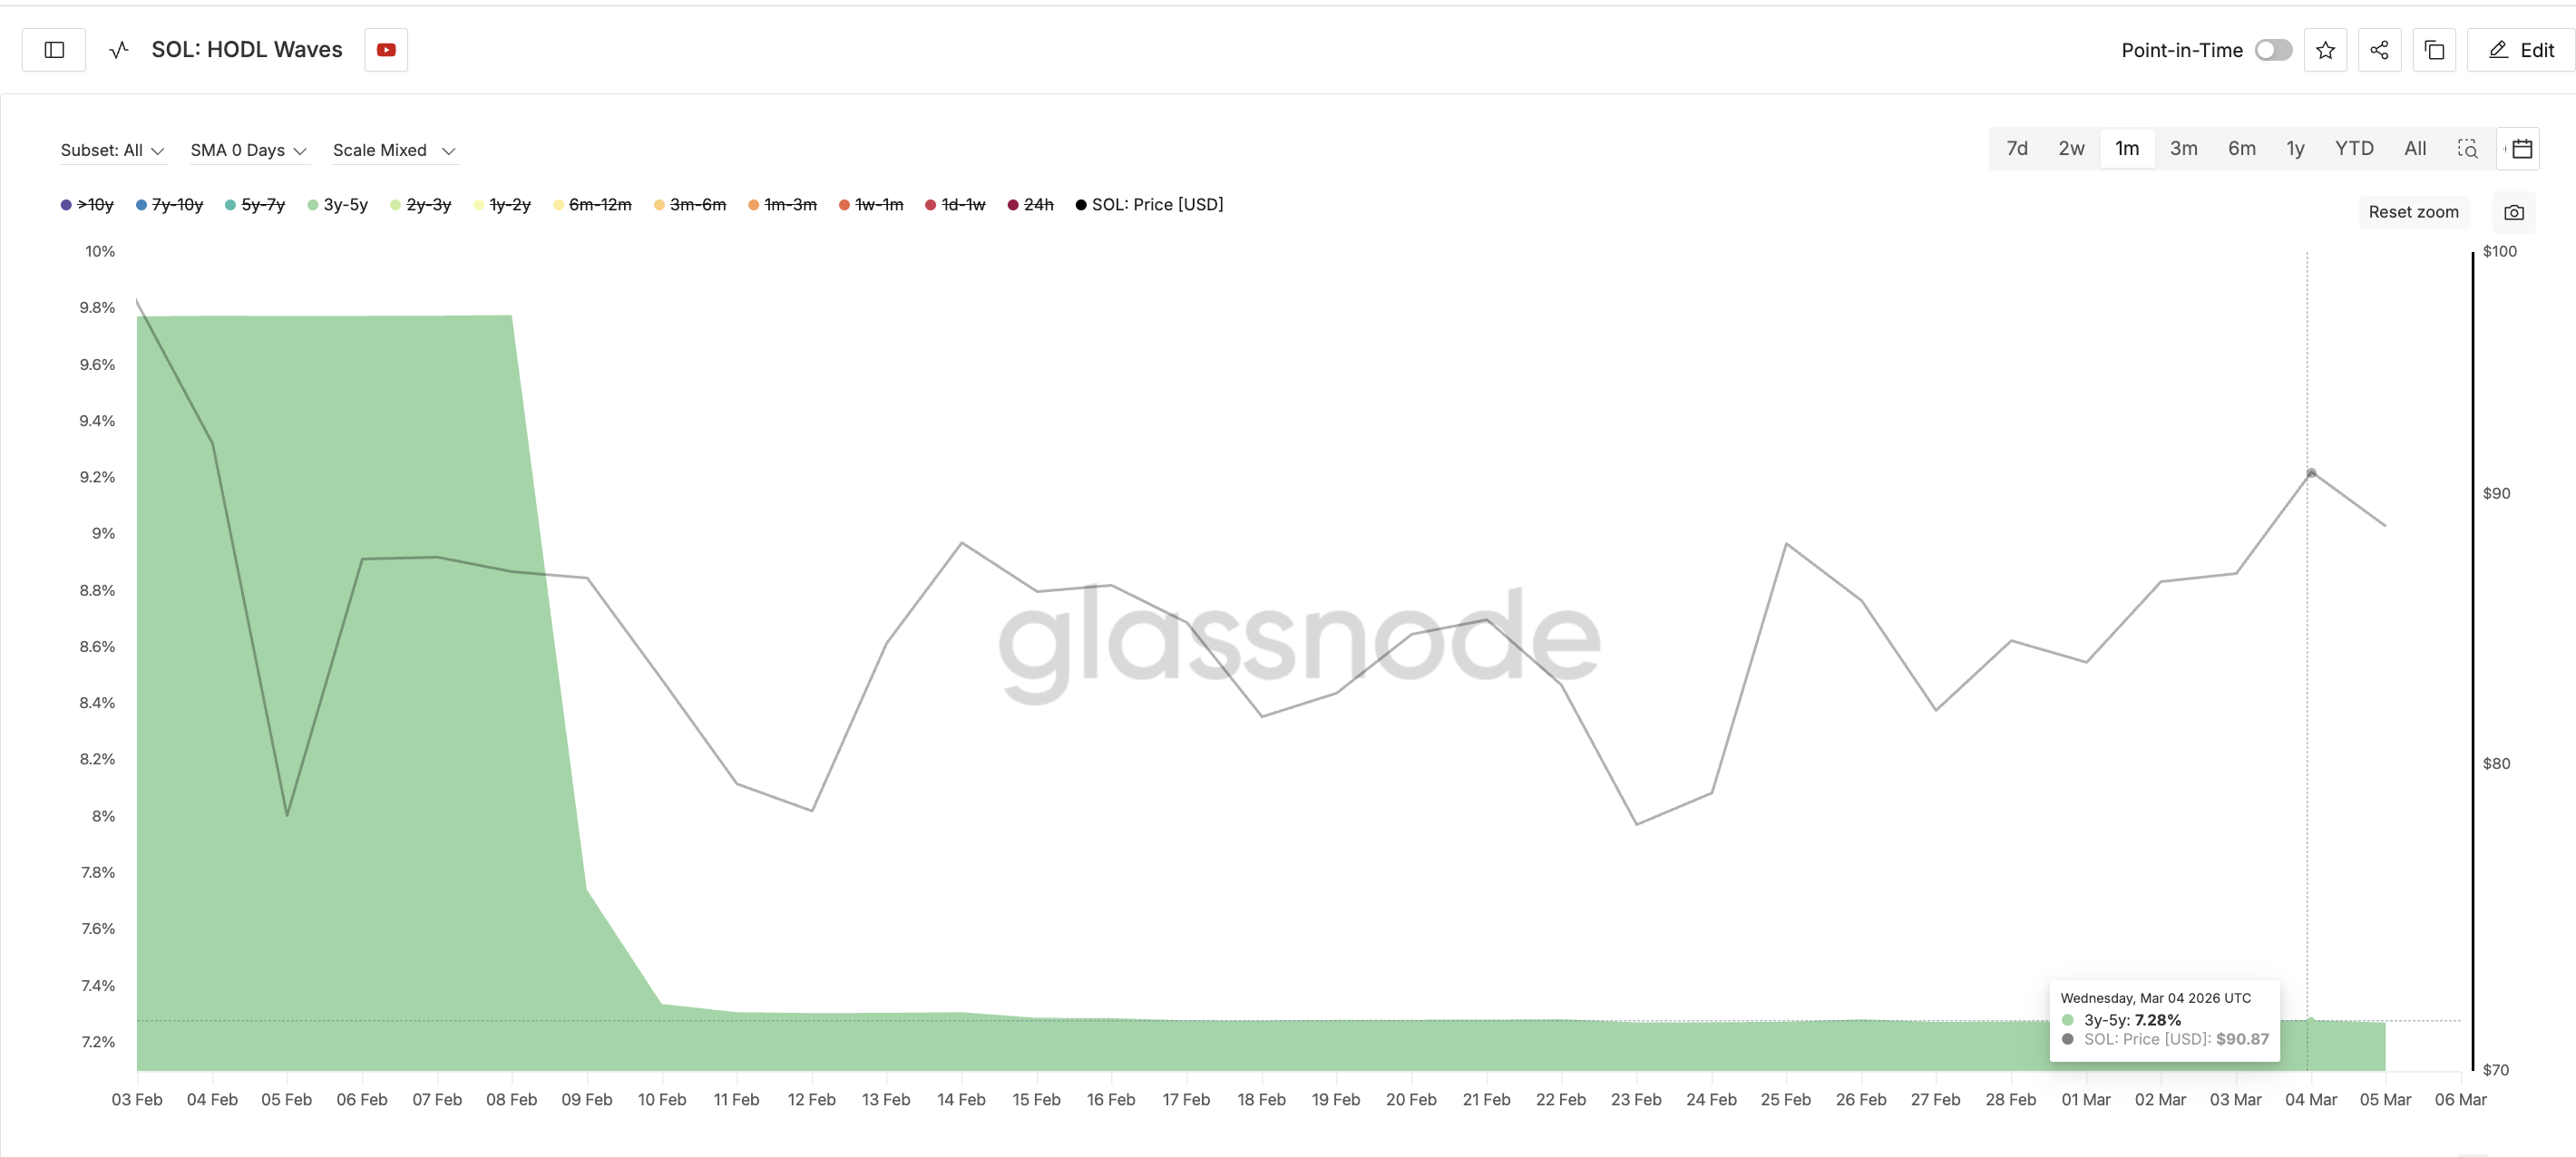
Most of the selling happened quickly during the early phase of the rally. By the time Solana eventually reached its $94 peak on March 4, these oldest holders had barely added back exposure. Their share of the supply had fallen to roughly 7.28%.
In other words, Solana’s strongest believers did not return to support the rally. That absence of long-term conviction becomes particularly important when technical momentum begins to weaken.
Hidden Bearish Divergence Suggests Momentum Is Fading, But a Bigger Risk Looms
That momentum warning has already surfaced on the chart. Between November 26 and March 4, Solana formed a hidden bearish divergence on the daily timeframe. This pattern appears when the price makes a lower high while the Relative Strength Index (RSI) forms a higher high.
Hidden bearish divergences often appear during broader downtrends and typically signal continuation of the existing trend.
Solana still fits that context. Despite the recent recovery, the token remains down roughly 34% over the past three months, meaning the broader trend is still bearish.
The divergence began to play out soon after the Solana price reached its $94 high on March 4. Since then, the price has already pulled back about 7%, suggesting that sellers may be regaining control. However, one key technical level still stands between Solana and a deeper decline.
Despite the pullback, Solana remains above its 20-day exponential moving average (EMA). The 20-day (EMA) is a trend line that tracks the average price of the last 20 days, giving more weight to recent prices.
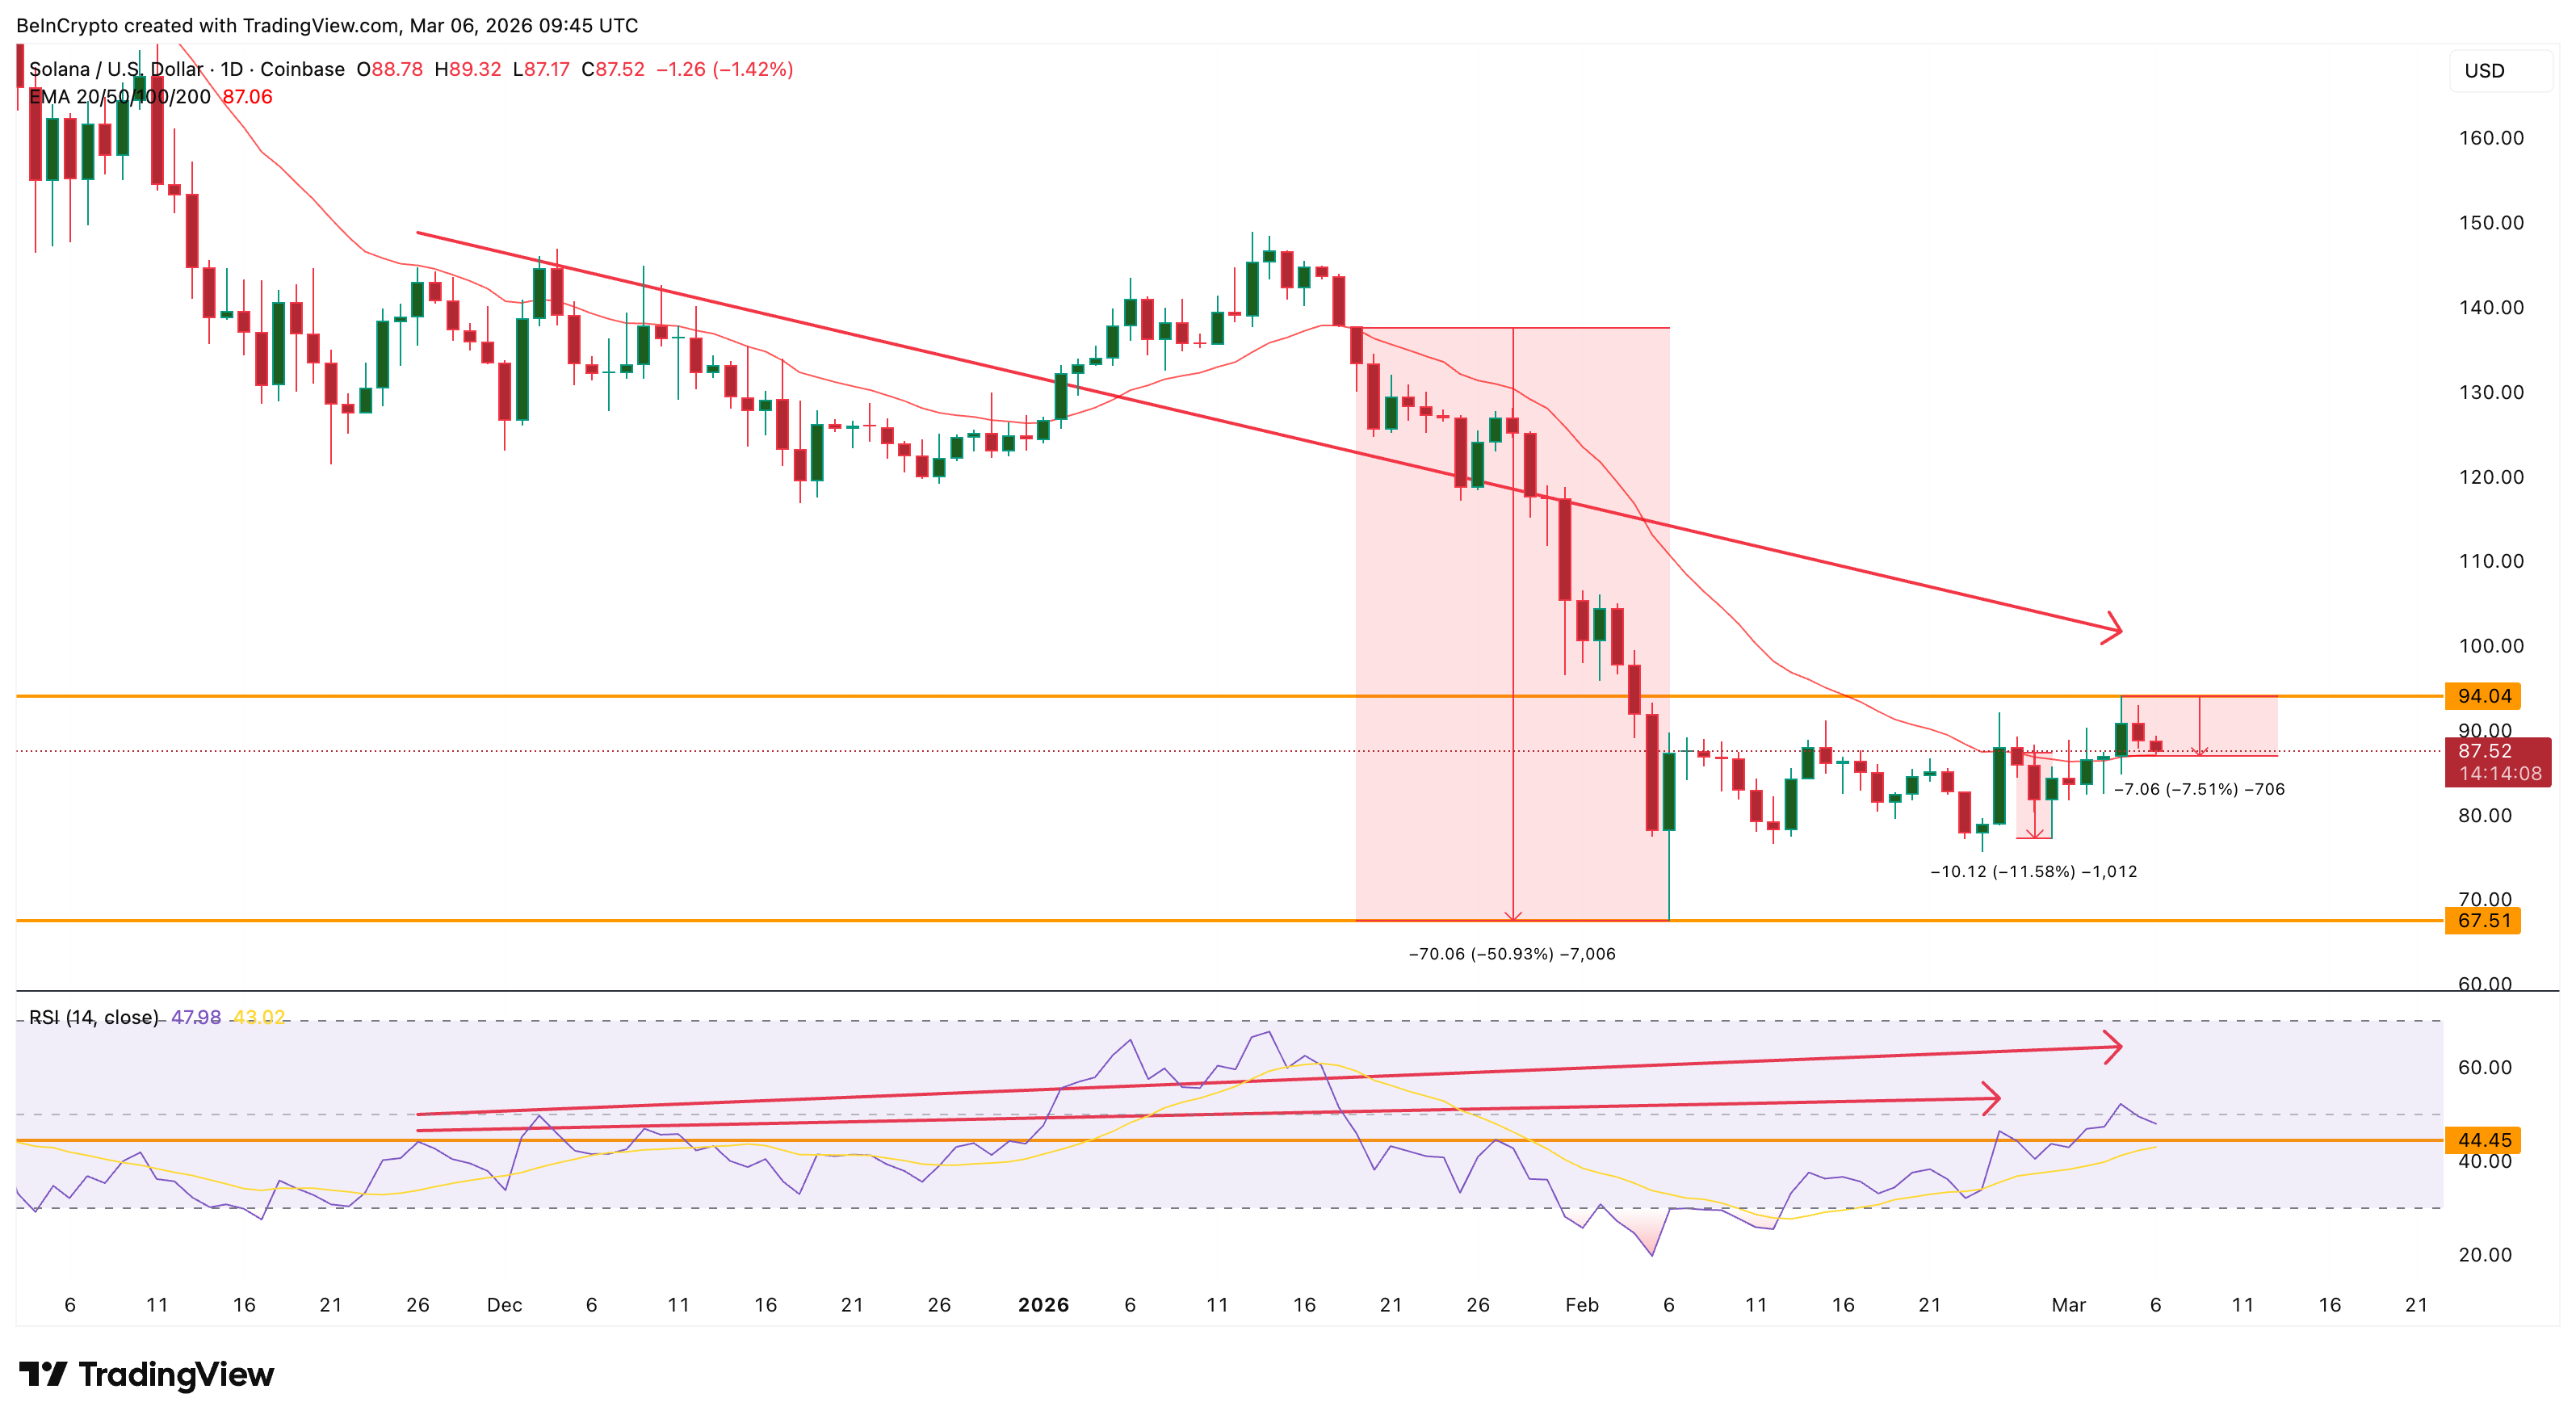
This level has repeatedly acted as a decisive trend line for the asset. When Solana loses the 20-day EMA, declines tend to accelerate quickly. For instance, when Solana lost this level around January 18 near $137, the decline eventually extended to roughly $67 by February 6.
Another example appeared earlier this year when a similar momentum signal pushed Solana below the same EMA and triggered an 11% decline.
The difference this time is that the market may lack a strong buyer group to defend the level. The oldest holders already reduced exposure during the rally, and now another group of investors appears to be selling as well.
Long-Term Holders Are Now Selling as Solana Price Tests Its Cost Basis
While the oldest holders reduced exposure early in the rally, mid-to-long-term holders continued accumulating. The Hodler Net Position Change metric showed that these investors, ones holding for more than 155 days, had been steadily adding to their positions since December 24, 2025. For weeks, the data recorded consistent accumulation.
But that trend has now reversed sharply.
The metric recently flipped negative to roughly –635,750 SOL, indicating that recent selling has now outweighed the steady accumulation seen over the past month.
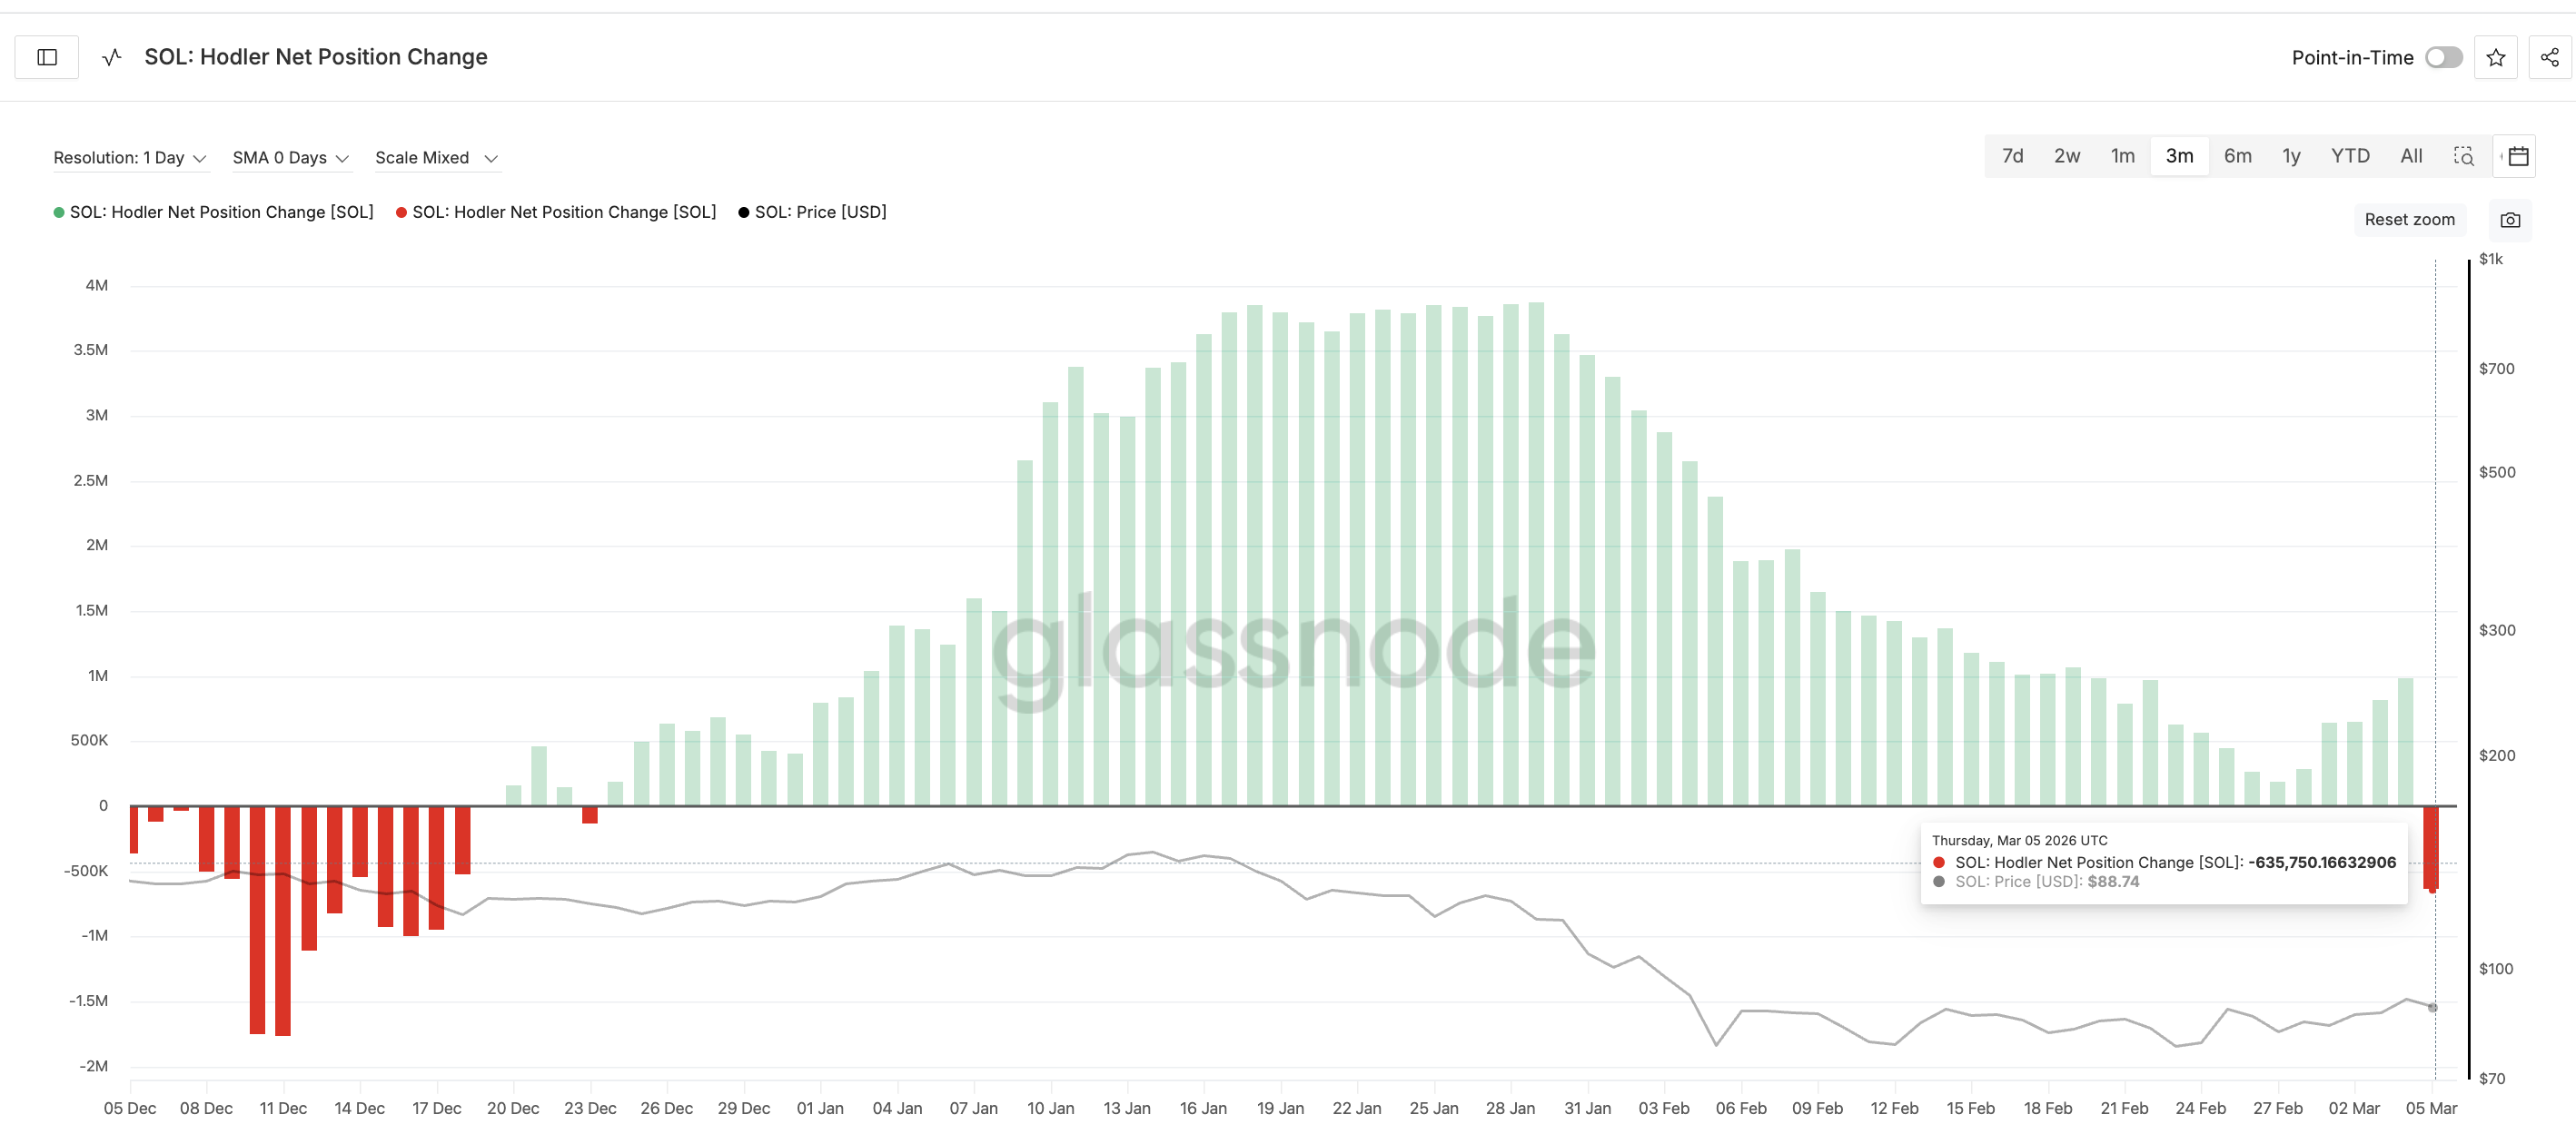
This shift comes at a critical moment because Solana is currently trading directly within a major cost-basis cluster between $86.80 and $87.82. Roughly 13.1 million SOL were accumulated in this range, making it one of the strongest support zones on the chart.
These cost-basis levels often act as support because investors tend to defend the prices where they originally bought.
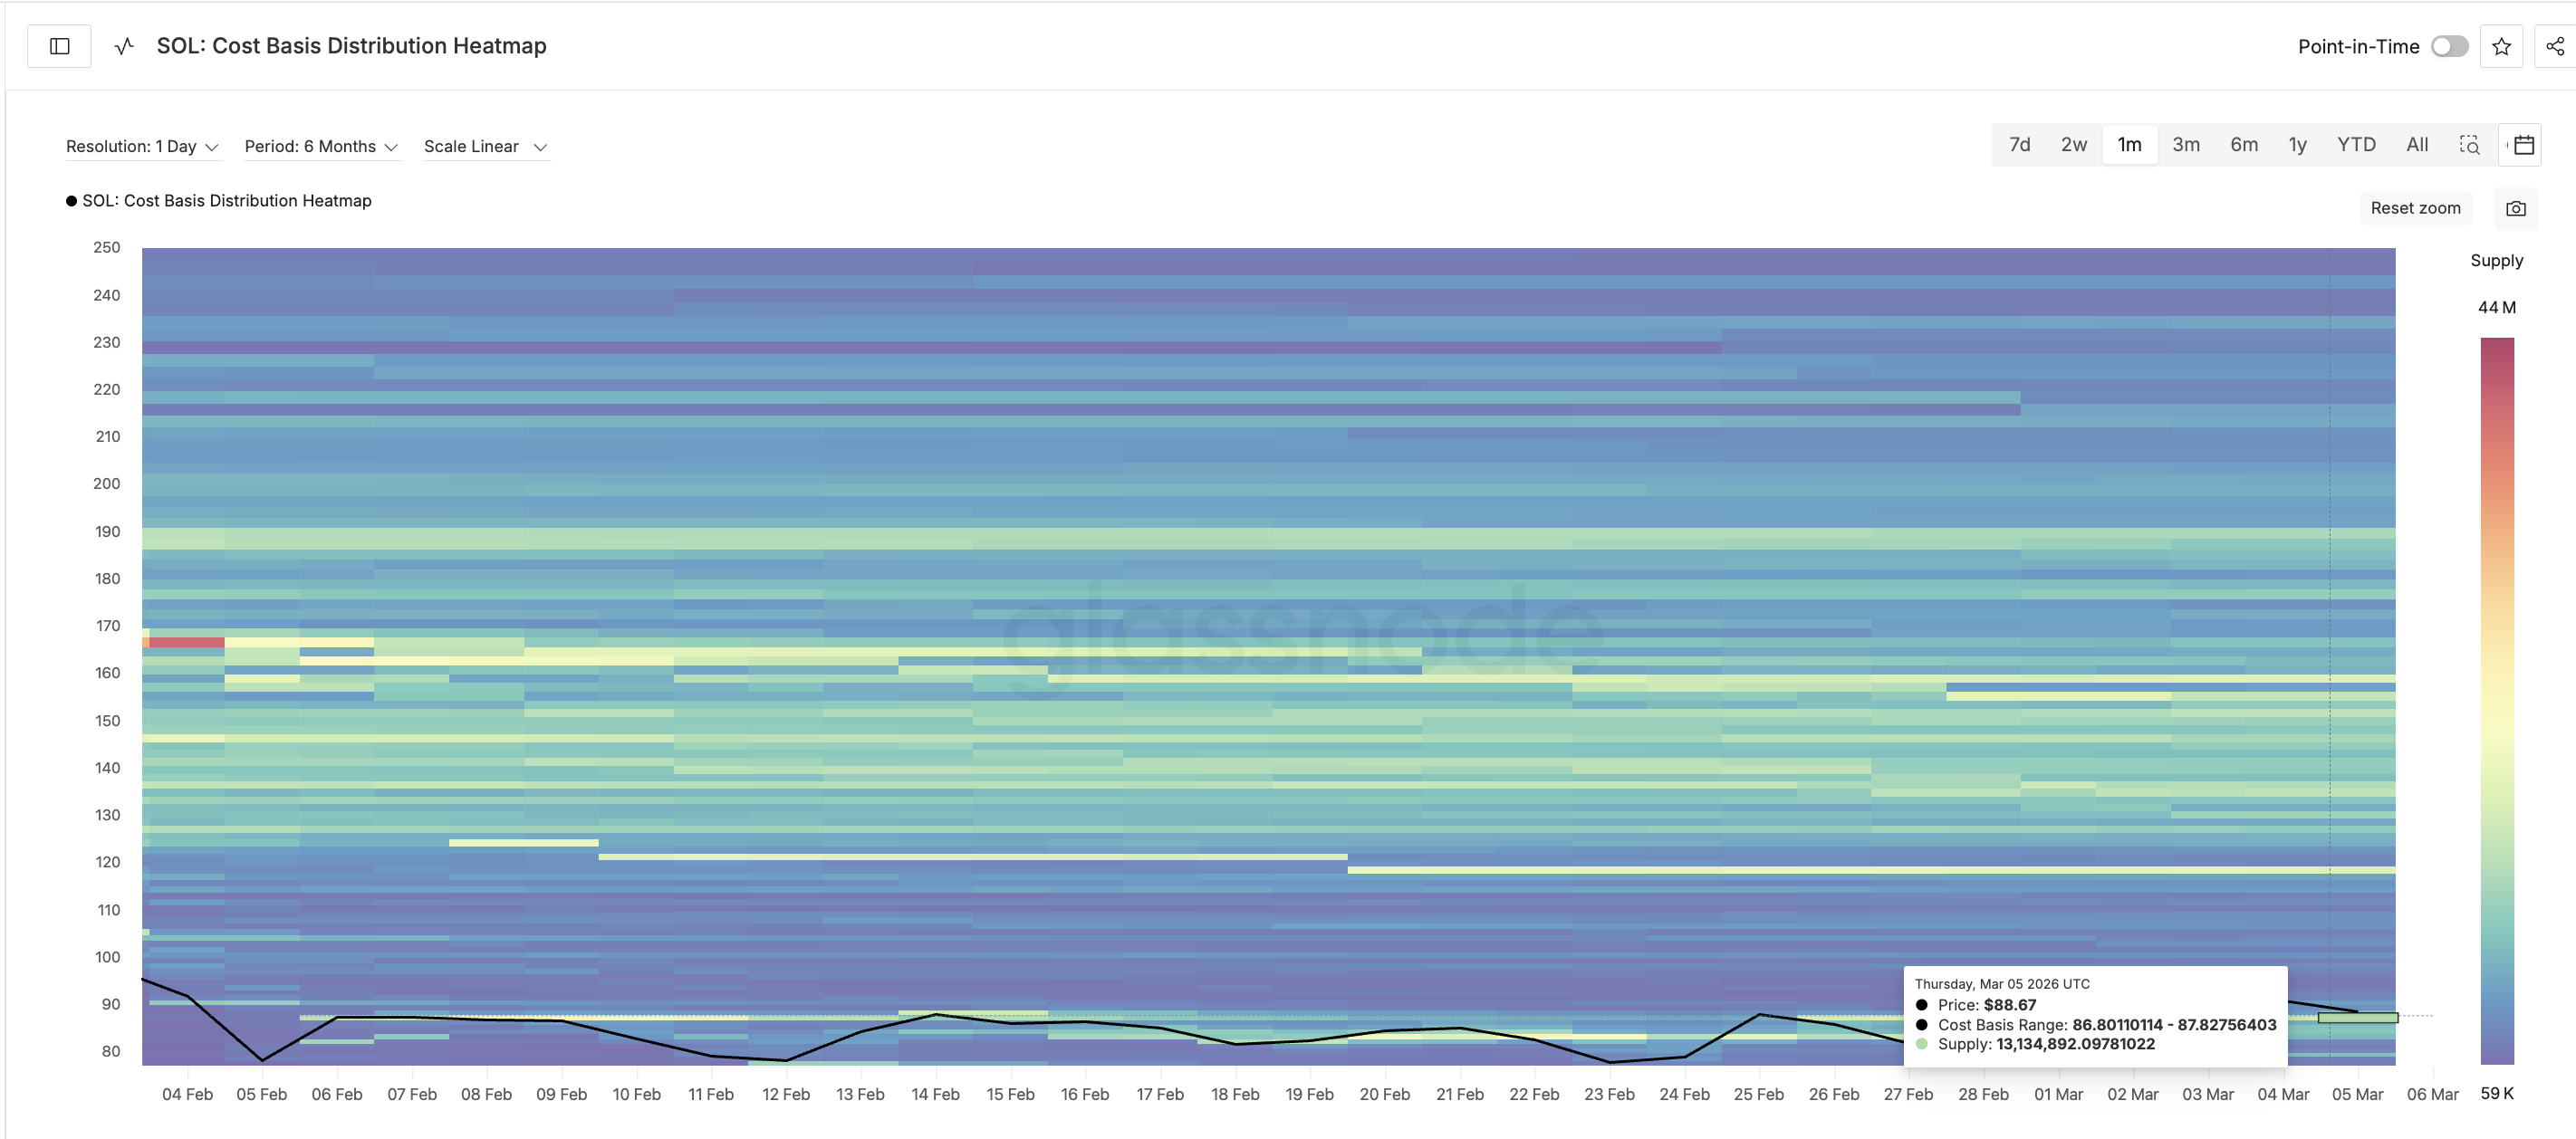
But if the level breaks, the reaction can be swift.
Inability to reclaim the $87.82 (common level between price and cluster chart) level can push the Solana price beneath both its 20-day EMA and its strongest cost-basis support cluster. That scenario could open the path toward $77.67, which aligns with the 0.618 Fibonacci retracement level. Further weakness could extend the drop toward $73.21 or even $67.52, the level from which the February rally began.
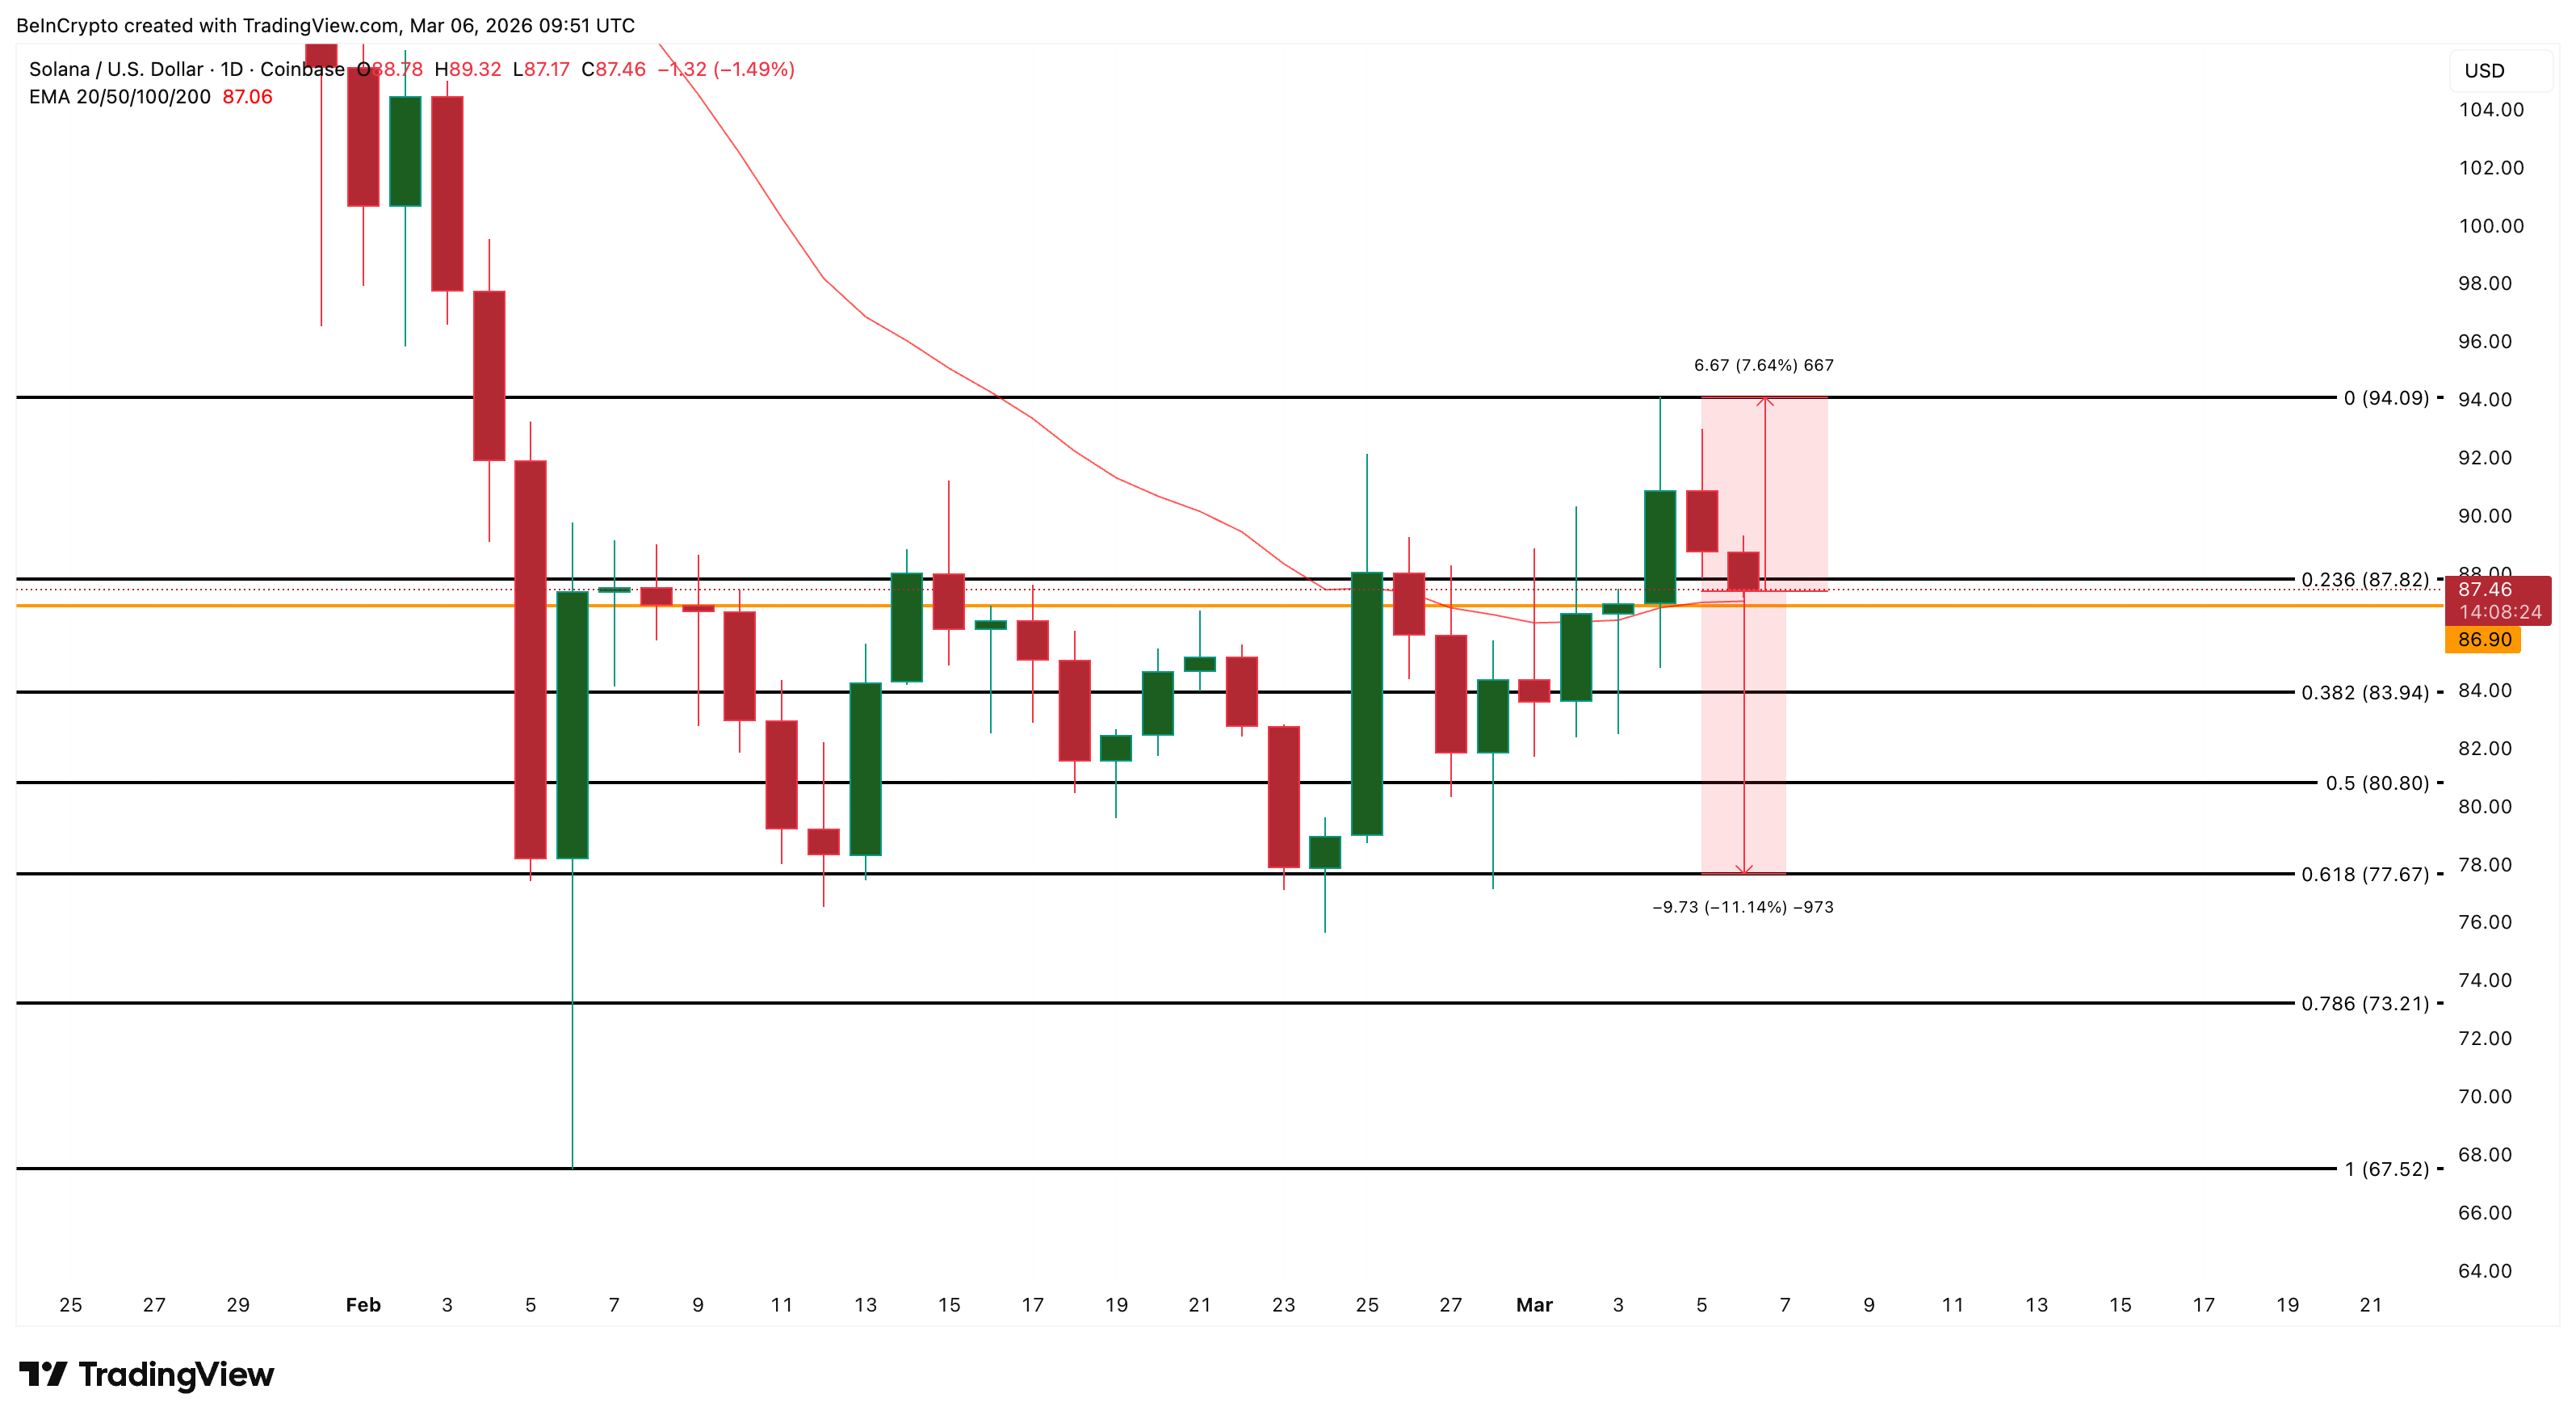
On the other hand, the bearish outlook would weaken if buyers regain control. For momentum to recover, Solana would need to reclaim $94.09, the level that previously marked the peak of the rally.
For now, Solana sits at a critical decision point. The rally to $94 showed strong short-term demand, but without the backing of its oldest holders, the move may struggle to hold if selling pressure continues around the $86-$87 support zone.
The post Solana’s Rally to $94 Failed to Convince Its Oldest Holders — Why a Pullback May Follow appeared first on BeInCrypto.