Silver just posted its sharpest single-day reversal in weeks. After rallying over 50% from early February’s crash lows to touch $96 on March 2, XAG/USD gave back more than 14%.
The technical structure that has guided silver since February remains intact — but three signals that supported the rally have quietly flipped. Here is what changed, what held, and what it means for the path ahead.
Cup-And-Handle Intact, Hidden Bullish Divergence Forming At Support
The spot Silver price continues to trade inside a developing cup-and-handle pattern on the daily chart.
The cup’s neckline is upsloping, running through the $96 zone, the latest local top. A daily close above this level would increase the chances of a breakout. For now, the handle must hold above $82, which served as the intraday wick low on March 3.
Supporting the structure is a forming hidden bullish divergence on the Relative Strength Index (RSI), a momentum oscillator that tracks the speed of price changes. Between January 8 and March 3, the Silver price is printing a higher low while RSI is making a lower low; a continuation signal suggesting the underlying trend remains upward despite the surface-level correction.
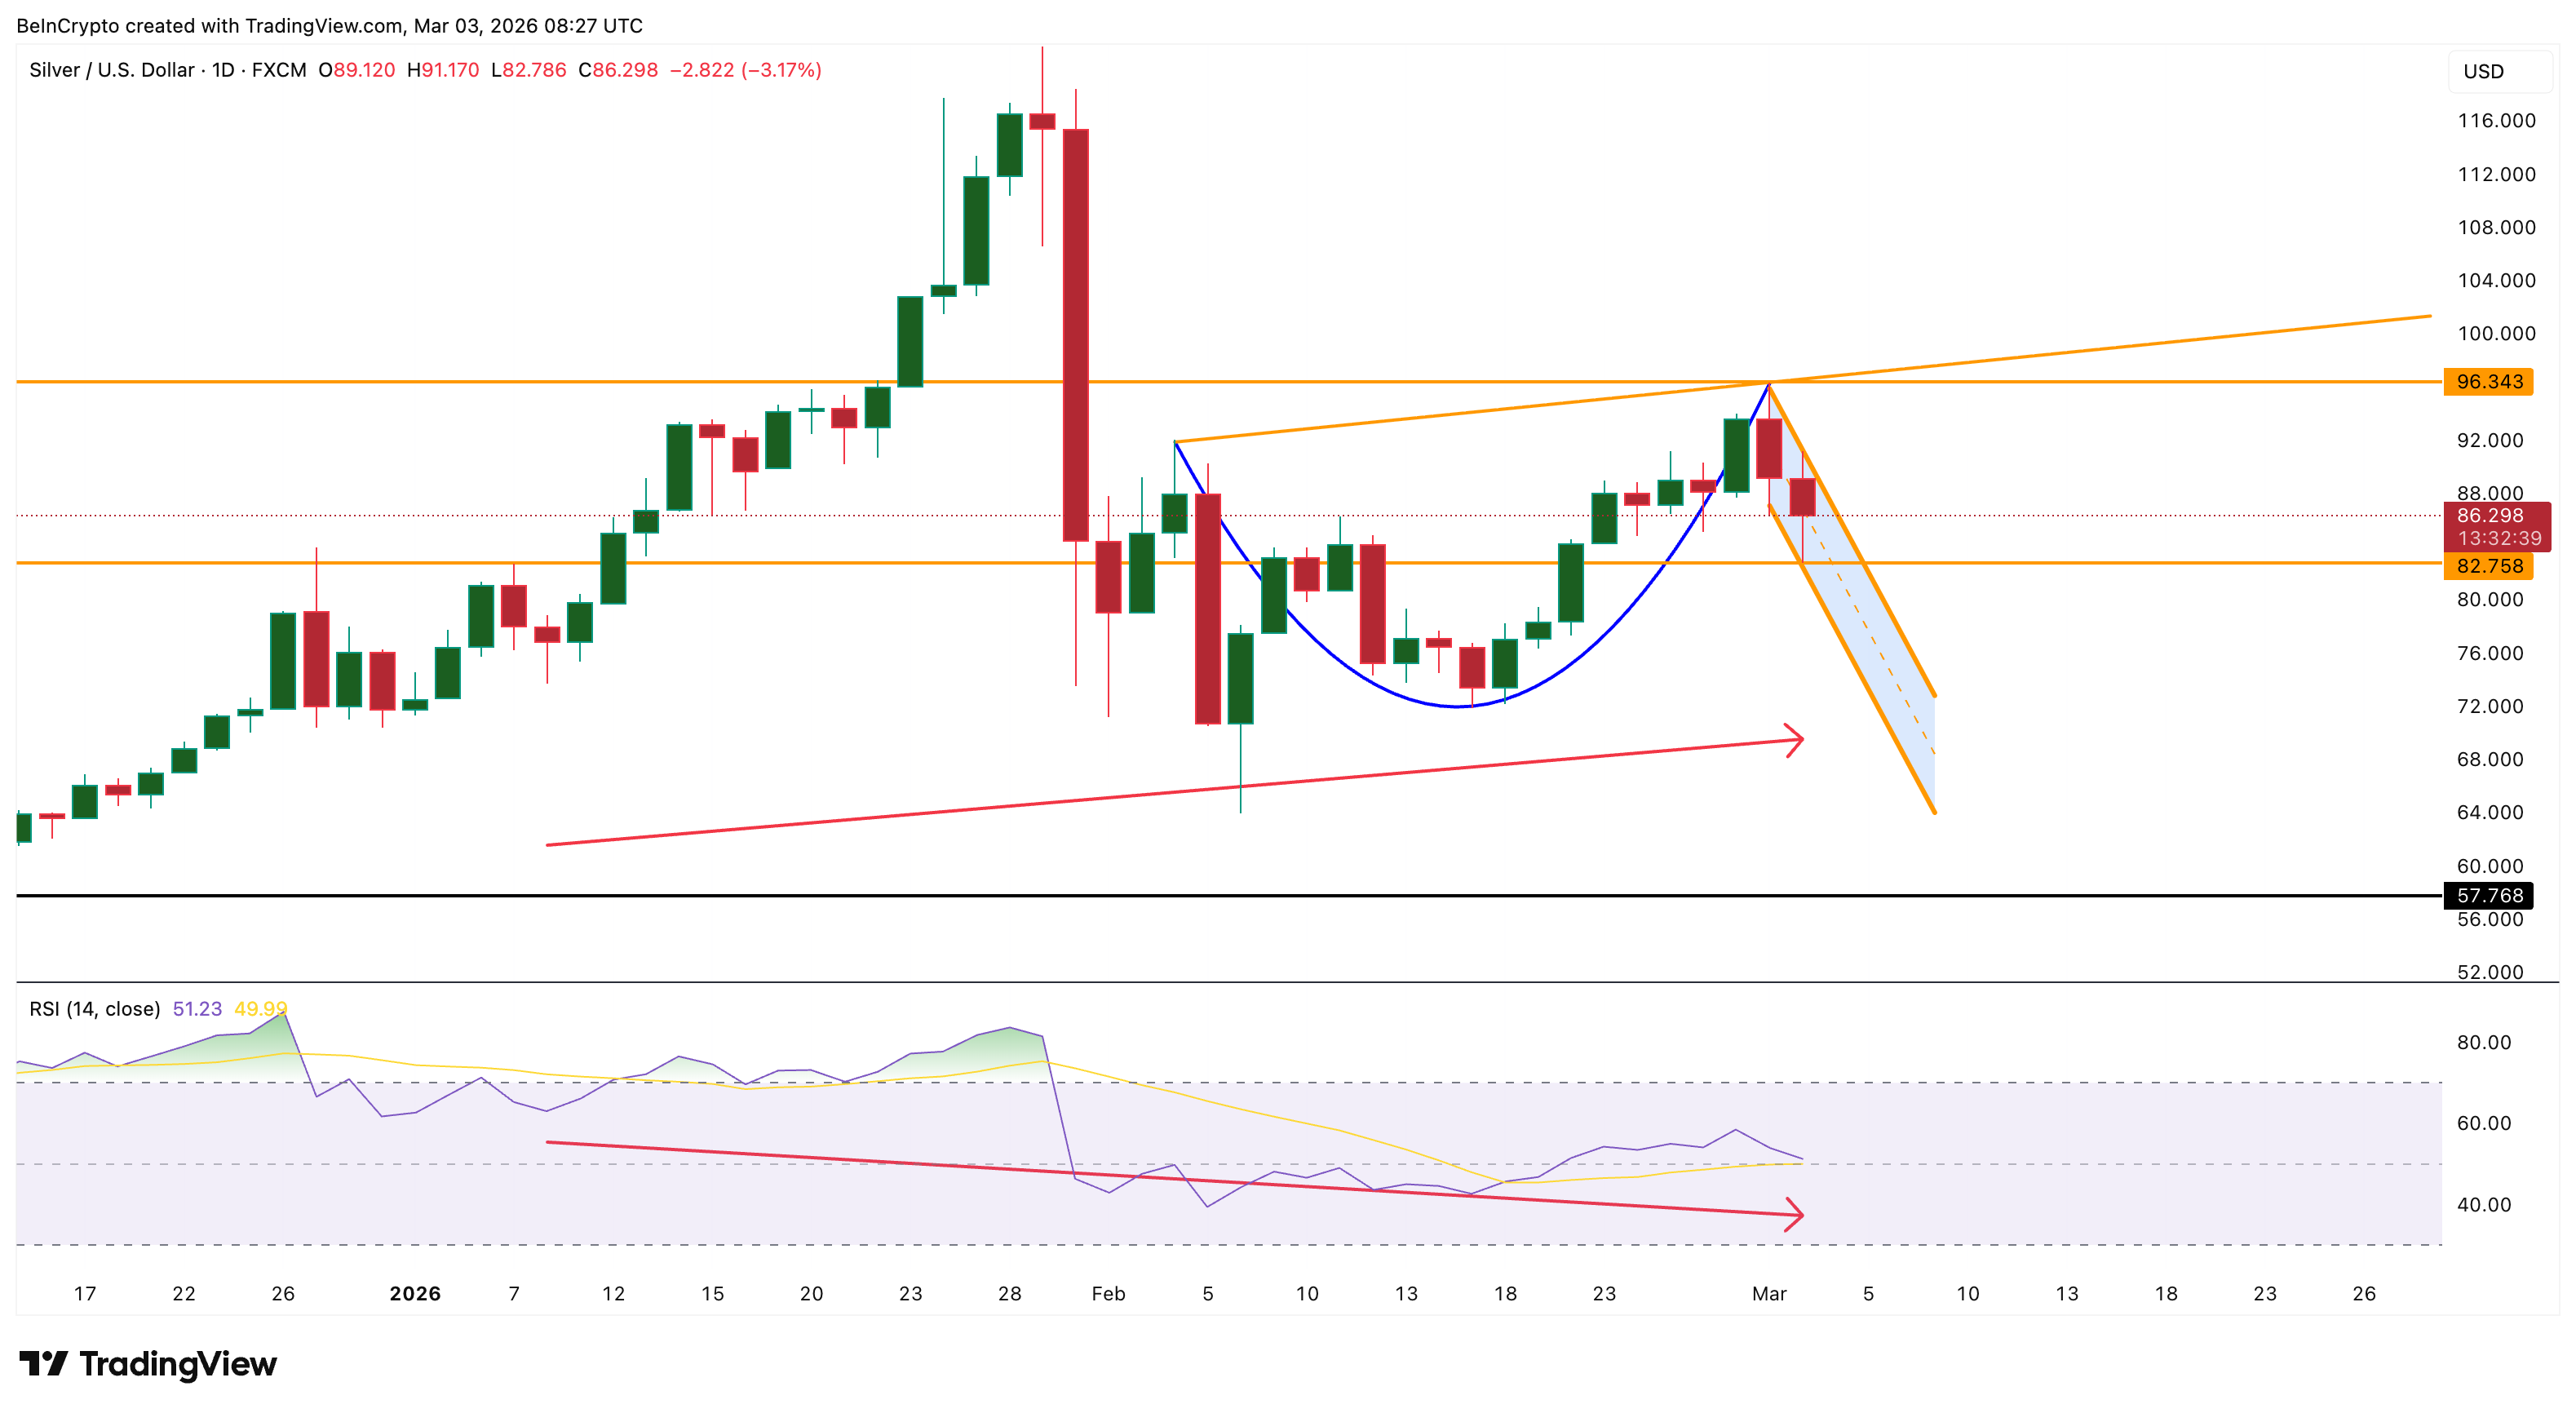
The long lower wick on March 3, touching $82 before bouncing to $86 (at press time), shows XAG buyers defending this zone. A daily close below $82 would invalidate the divergence for now, but would still keep the higher-low structure intact. The higher-low structure holds as long as the price stays above the January 8 level.
The structure says bullish. But structure alone does not move price — capital does. And three signals are now working against it.
Gold-Silver Ratio Breaks Out As Backwardation Vanishes
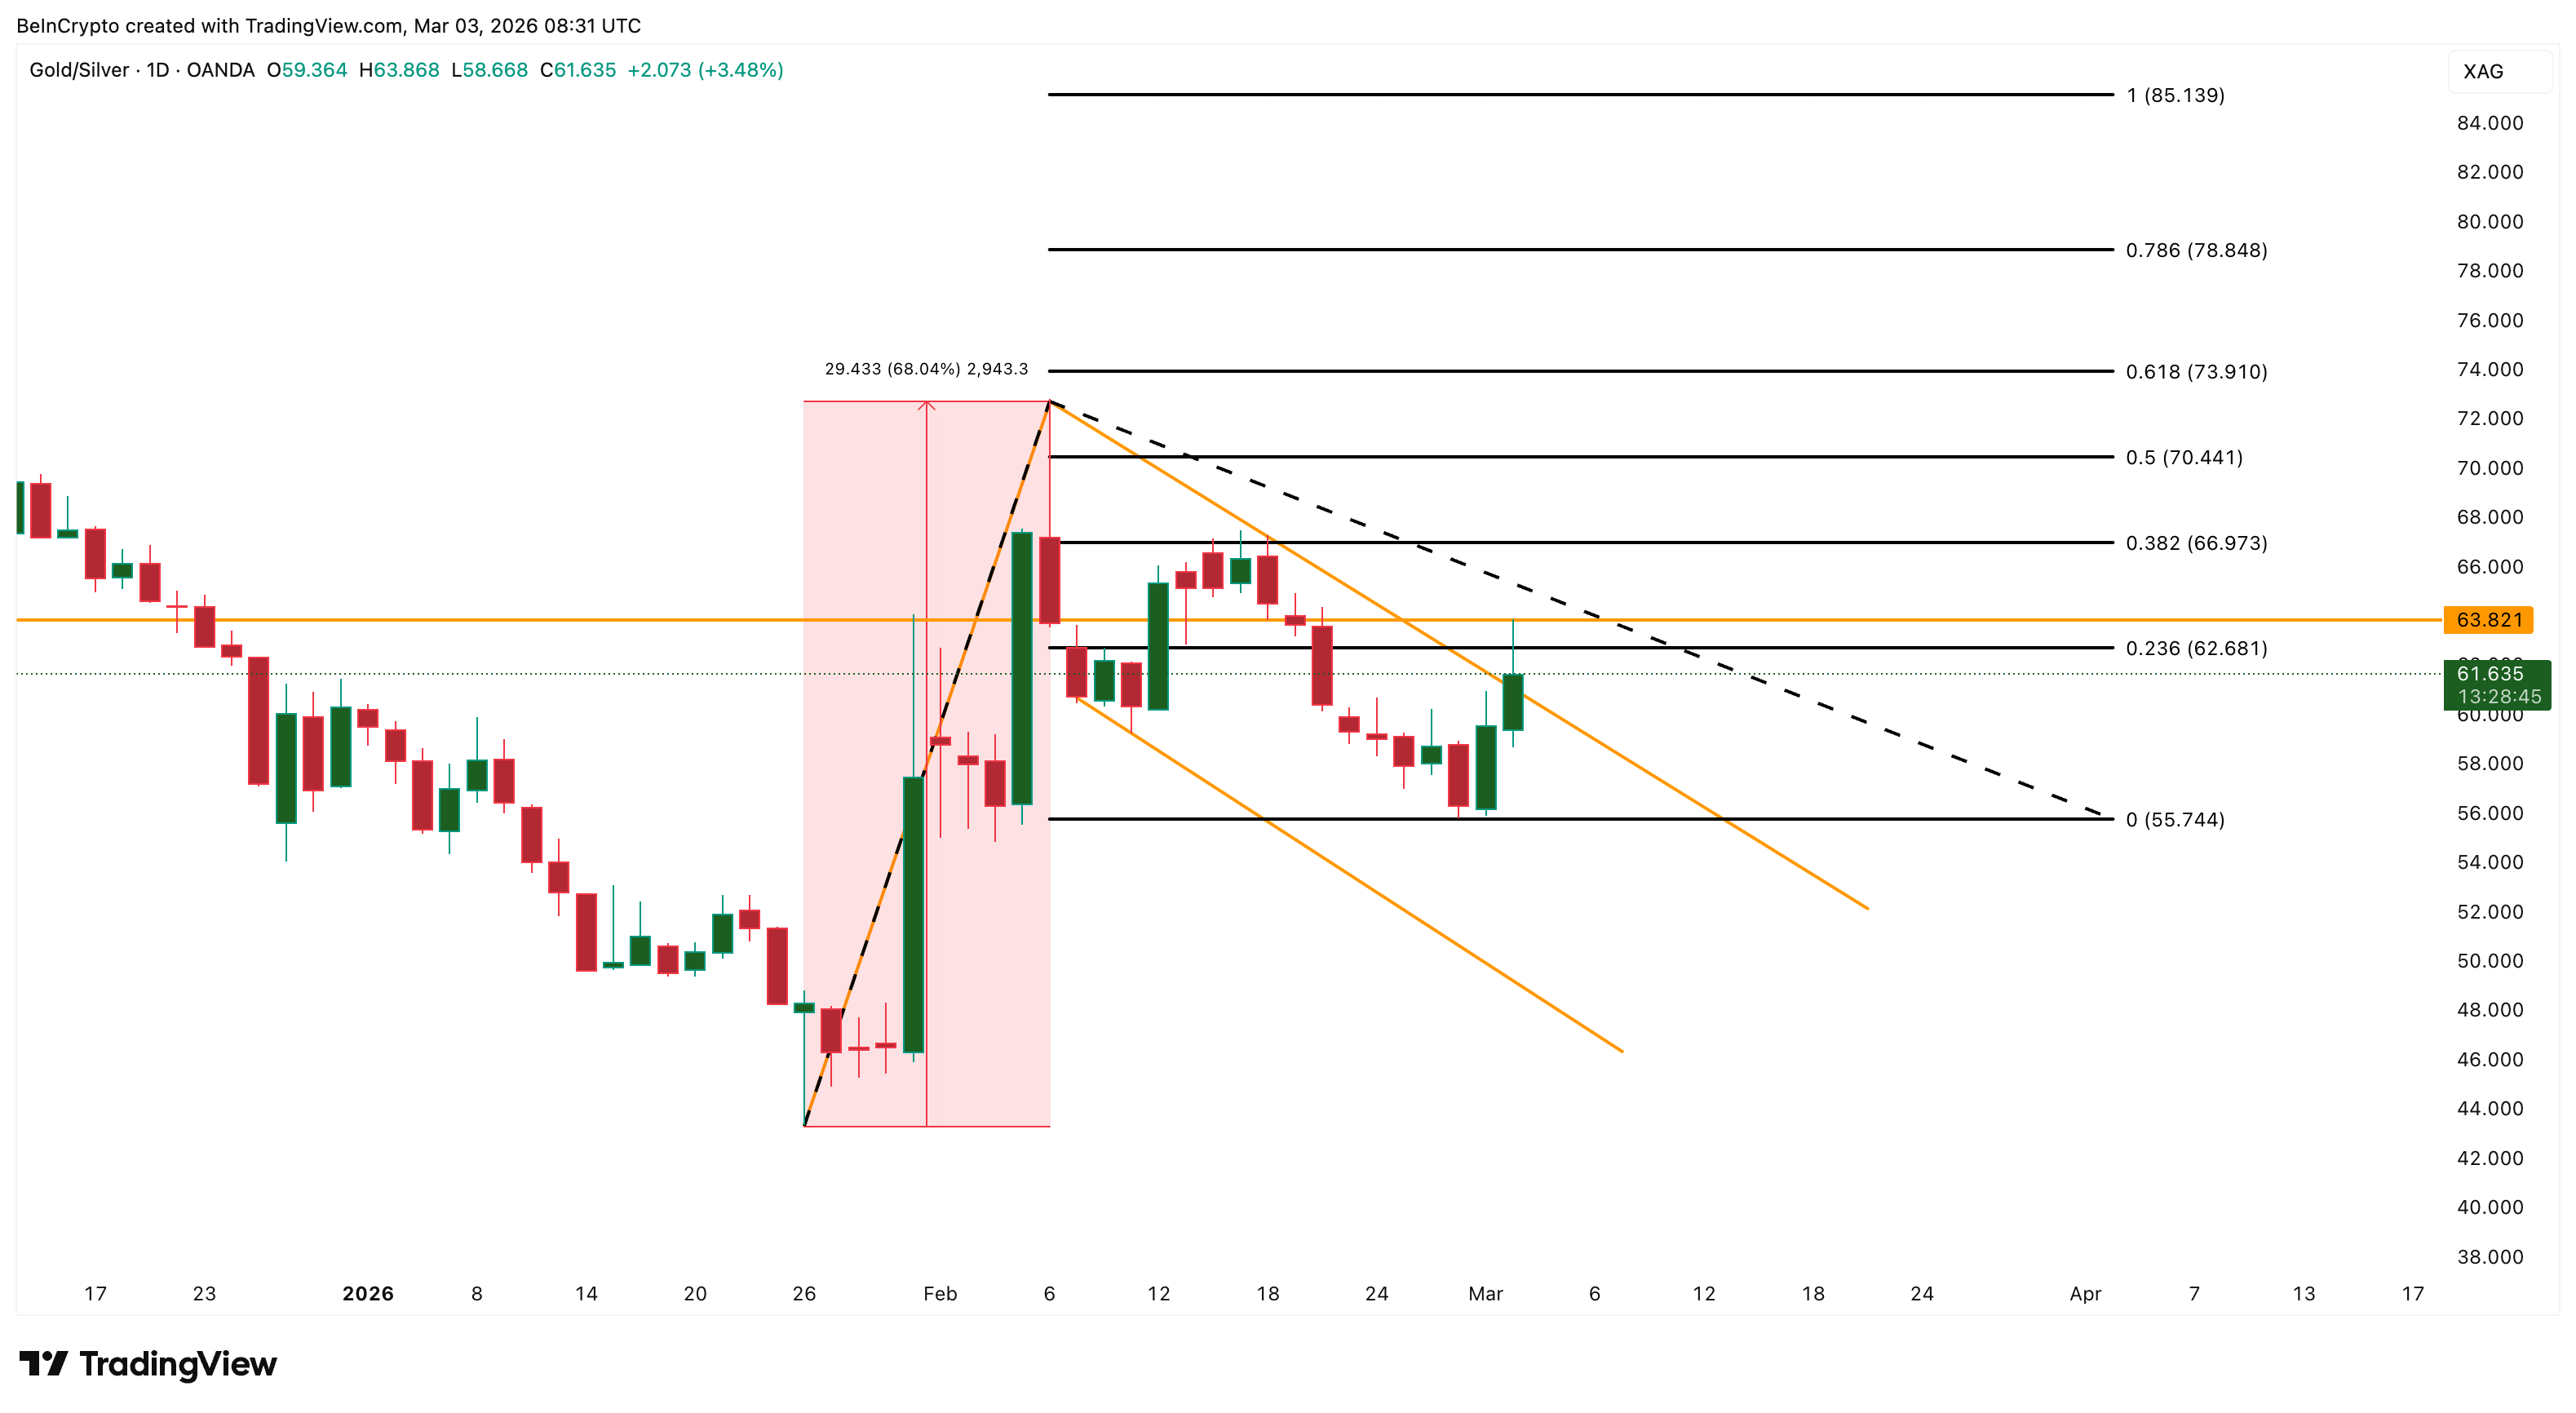
The Gold-Silver Ratio (XAUXAG), which measures how many ounces of silver it takes to buy one ounce of gold, has broken out of the bullish flag that was flagged as a risk in the February 21 analysis. The ratio spiked to nearly 64 on March 3, then pulled back to around 62.
A sustained move above 64 opens targets toward 67 and 70 — territory where gold decisively outperforms silver, and the cup-and-handle timeline extends.
This shift is not necessarily a flaw in silver’s price structure. Gold functions primarily as a store of value and hedge against uncertainty, while roughly 60% of silver’s annual consumption comes from industrial applications. With escalating geopolitical tensions, trade war fears, and recession anxiety weighing on industrial sentiment, institutional capital is gravitating toward gold’s safe-haven appeal over silver’s industrial sensitivity.
Compounding the shift, backwardation on COMEX Silver Futures (SI1!) has vanished. Backwardation is a rare condition where the spot price trades above the futures price, signaling that buyers are willing to pay a premium for immediate physical delivery — a sign of genuine supply tightness. In mid-February, spot silver held a clear $2 premium over SI1!.
As of March 3, that gap has closed to near zero, with spot and futures both trading around $85 to $86.
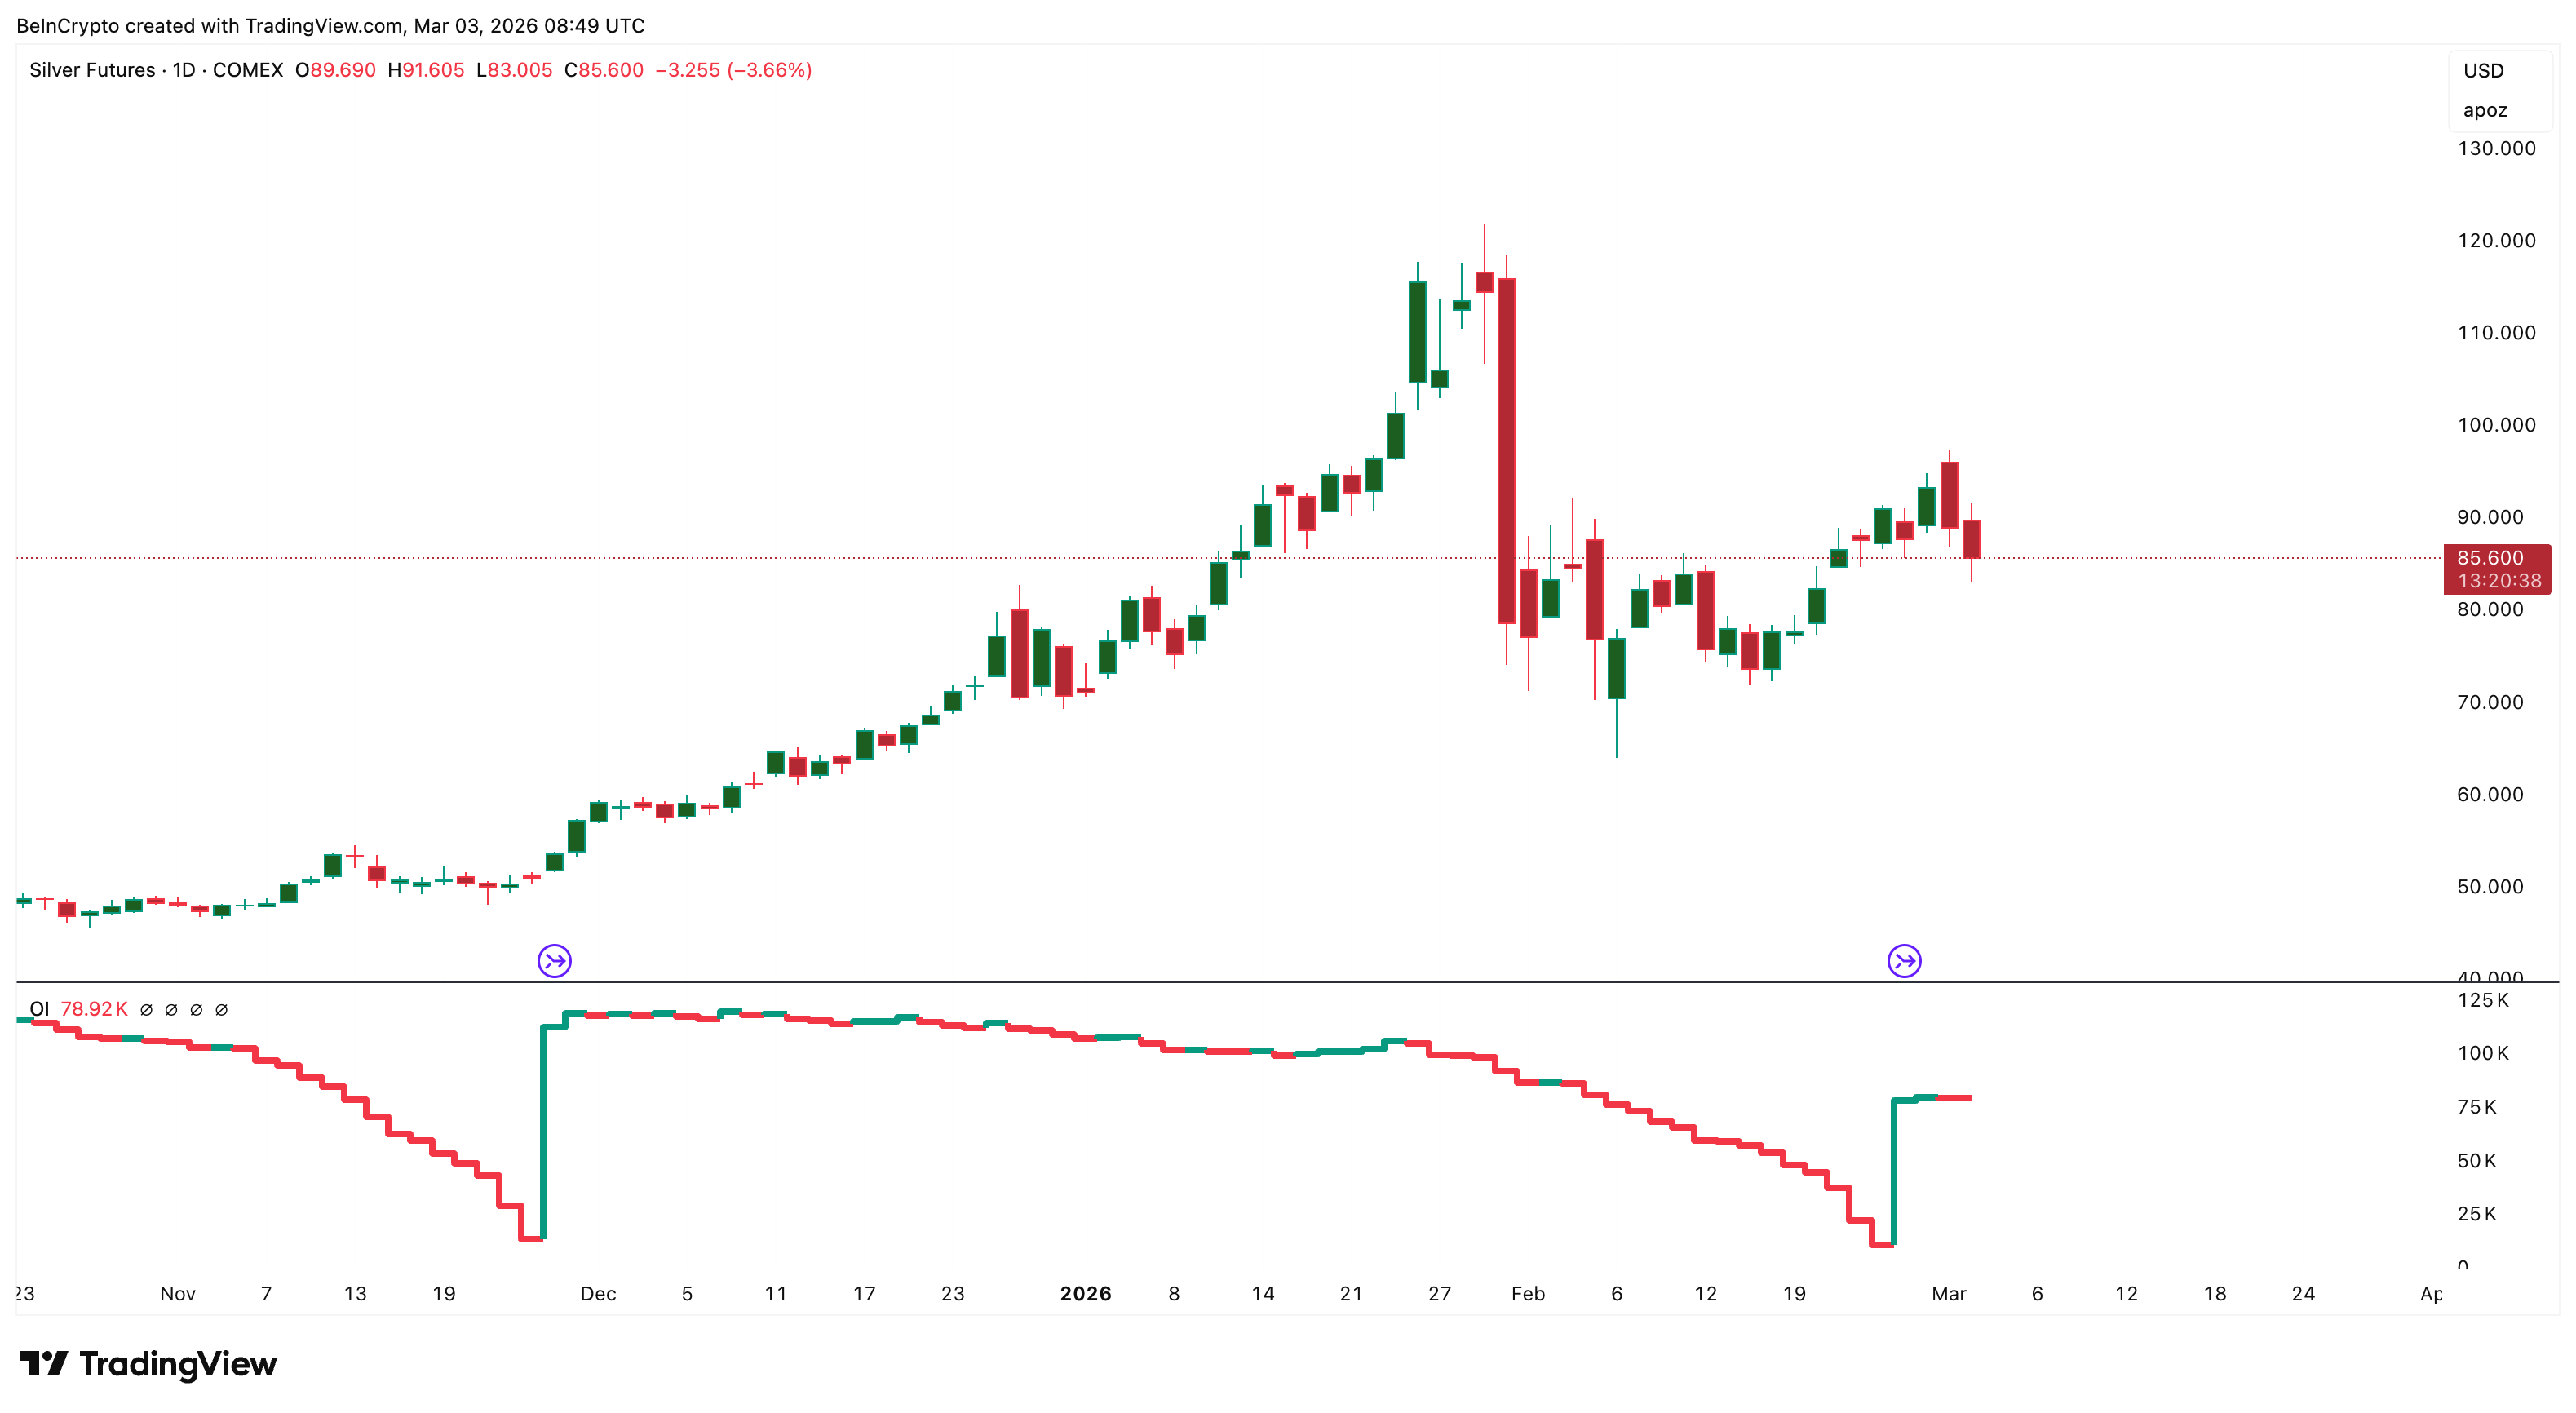
Adding to the concern, open interest on SI1! surged briefly after March 2 but has since flatlined and turned red — meaning participation is not growing even as prices touched $96.
This is key because backwardation was the signal that allowed silver to defy dollar strength in February. Without that physical premium and with futures participation stalling, the traditional inverse correlation has reasserted itself, and the dollar is literally surging, highlighted in our oil price analysis from earlier.
DXY At 99 Is The Dominant Headwind, But COT Shows Possibilities
The US Dollar Index (DXY), which tracks the dollar’s strength, has climbed from 97 in mid-February to above 99. It is now moving inside a well-defined ascending channel. The index is pressing toward its 1.618 Fibonacci extension near 100.50. Silver’s reversal from $96 to $83 directly coincided with this move. Without backwardation to buffer it, silver is fully exposed to dollar pressure.
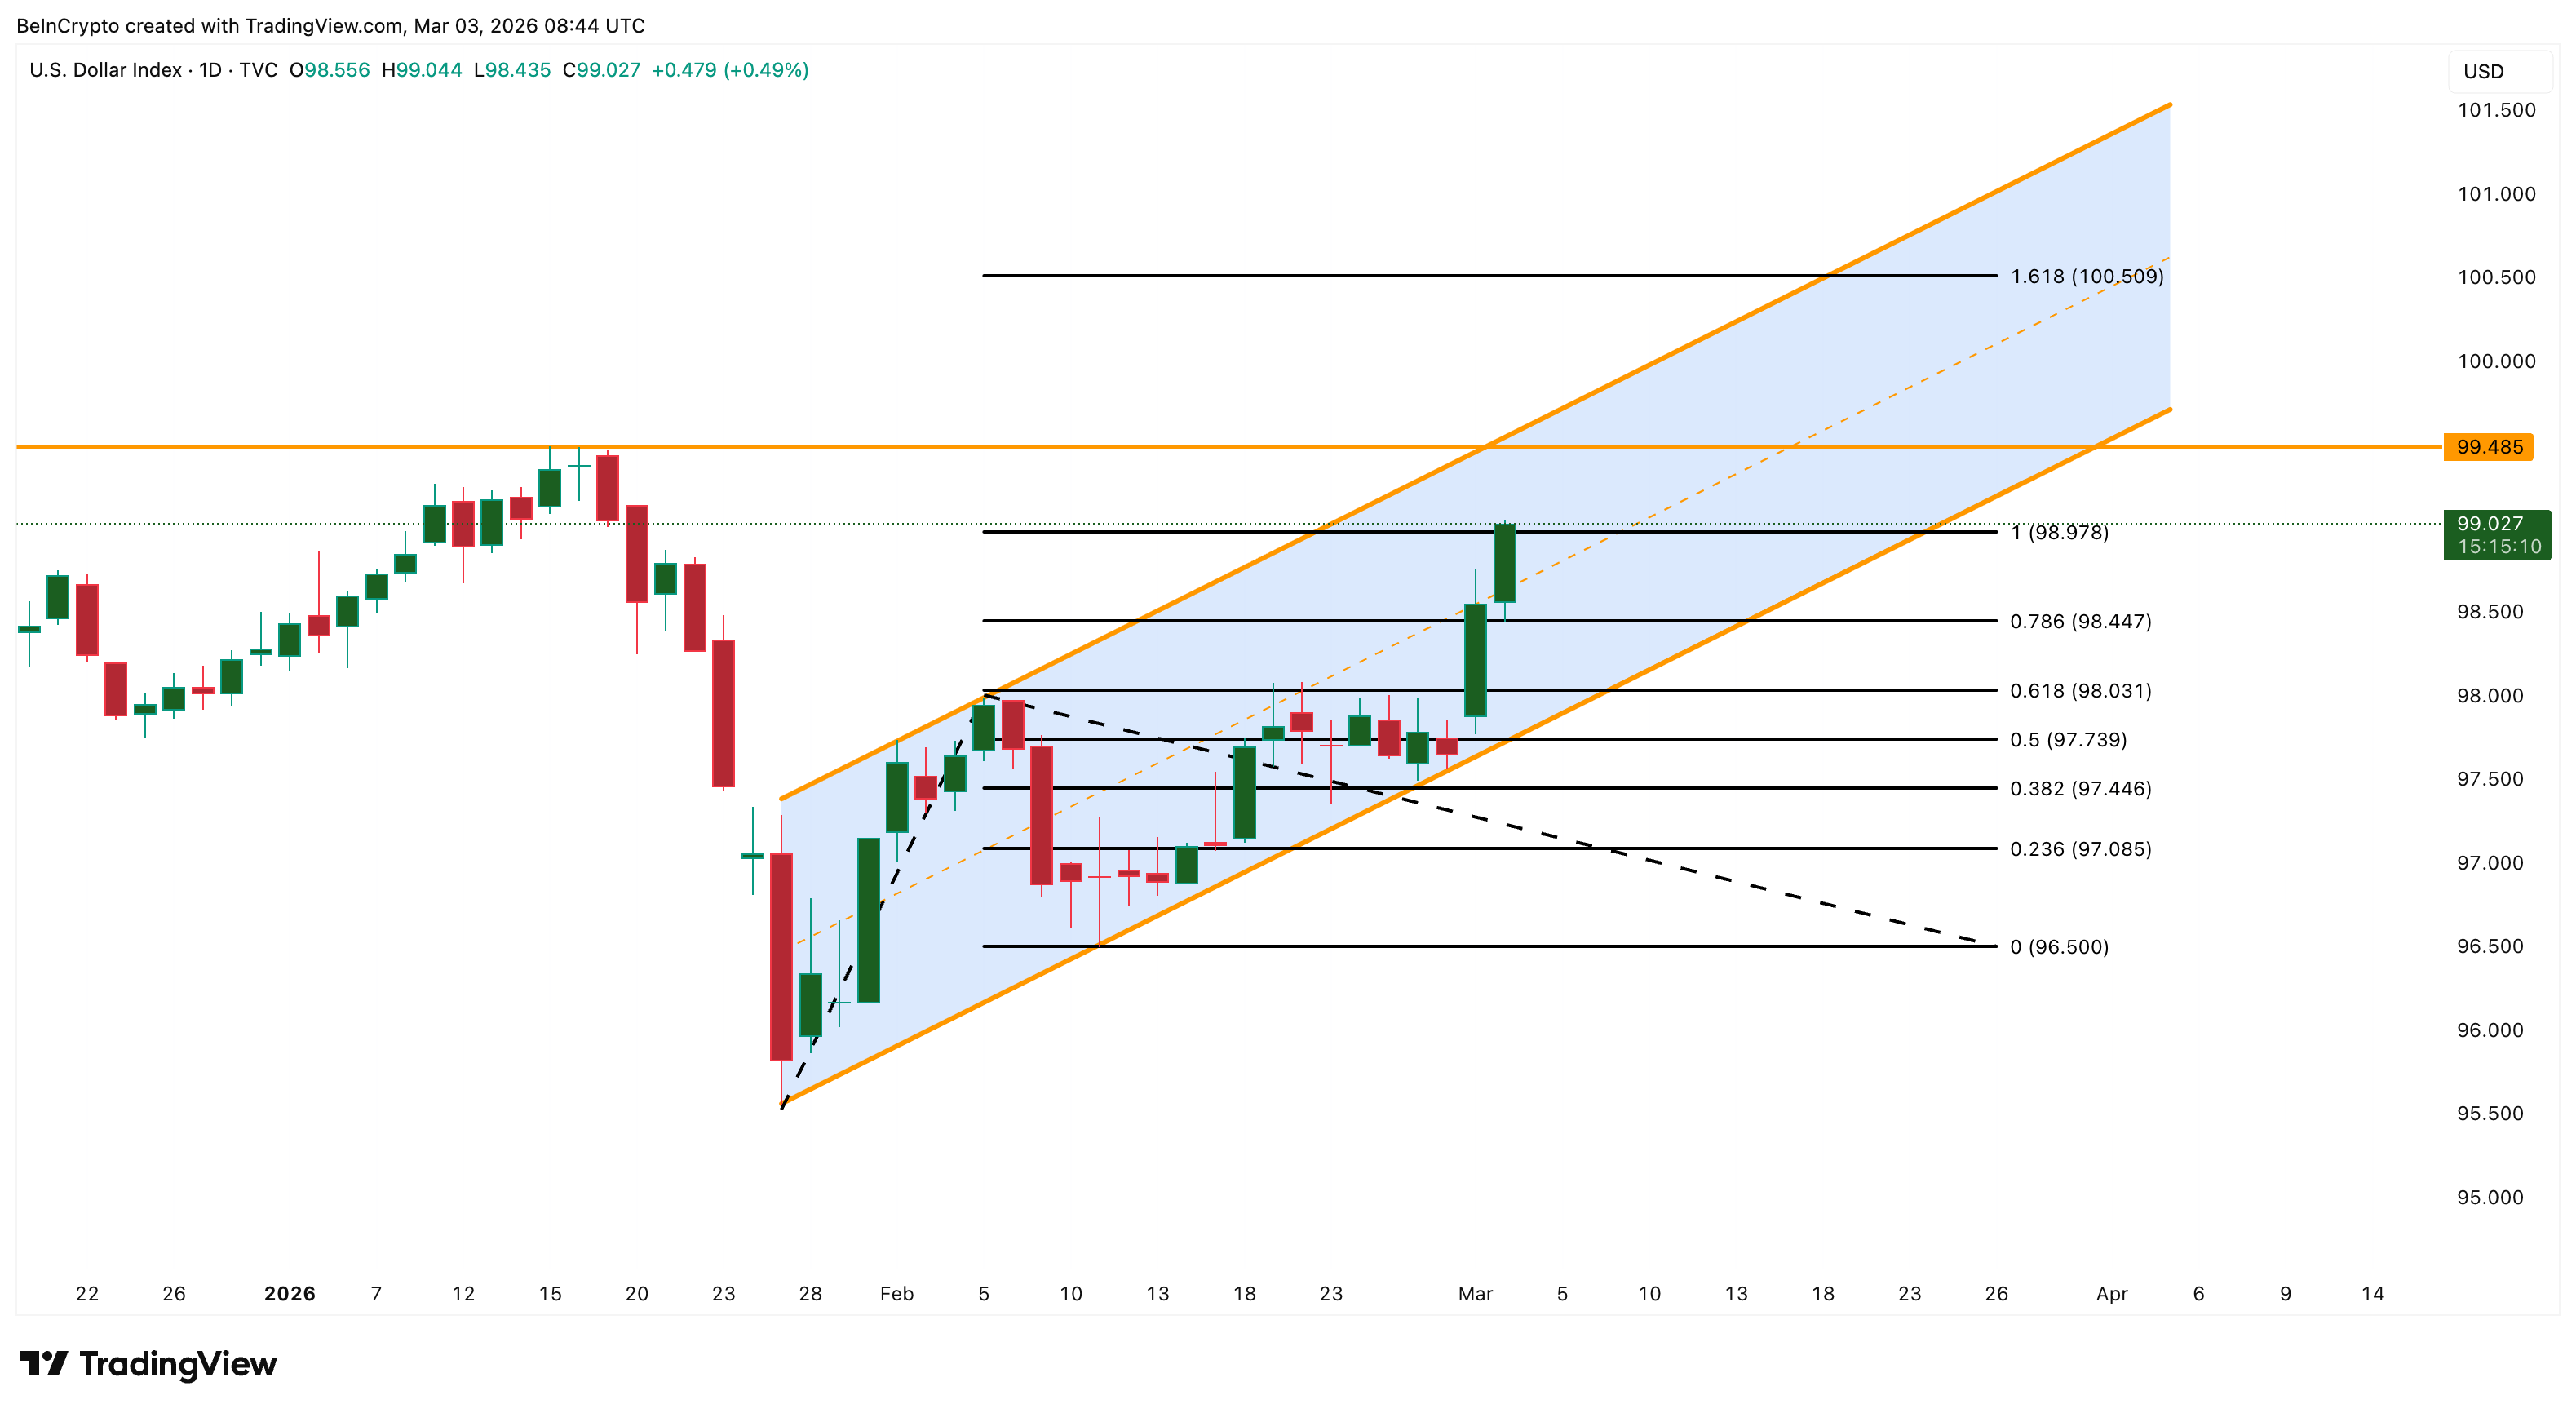
For silver bulls, the key watch is DXY pulling back toward 97 to 98 — the lower trendline of its channel. A retreat to this zone would relieve macro pressure and create conditions for the handle to complete.
The positioning data, however, offers a medium-term reason for optimism. The Commitment of Traders (COT) report, published weekly by the Commodity Futures Trading Commission (CFTC), shows Managed Money, usually hedge funds and Commodity Trading Advisors, holding a net long position of roughly 8,500 contracts as of February 24 (the last COT release). This has nearly doubled from around 4,500 in early February, signaling early institutional re-engagement.
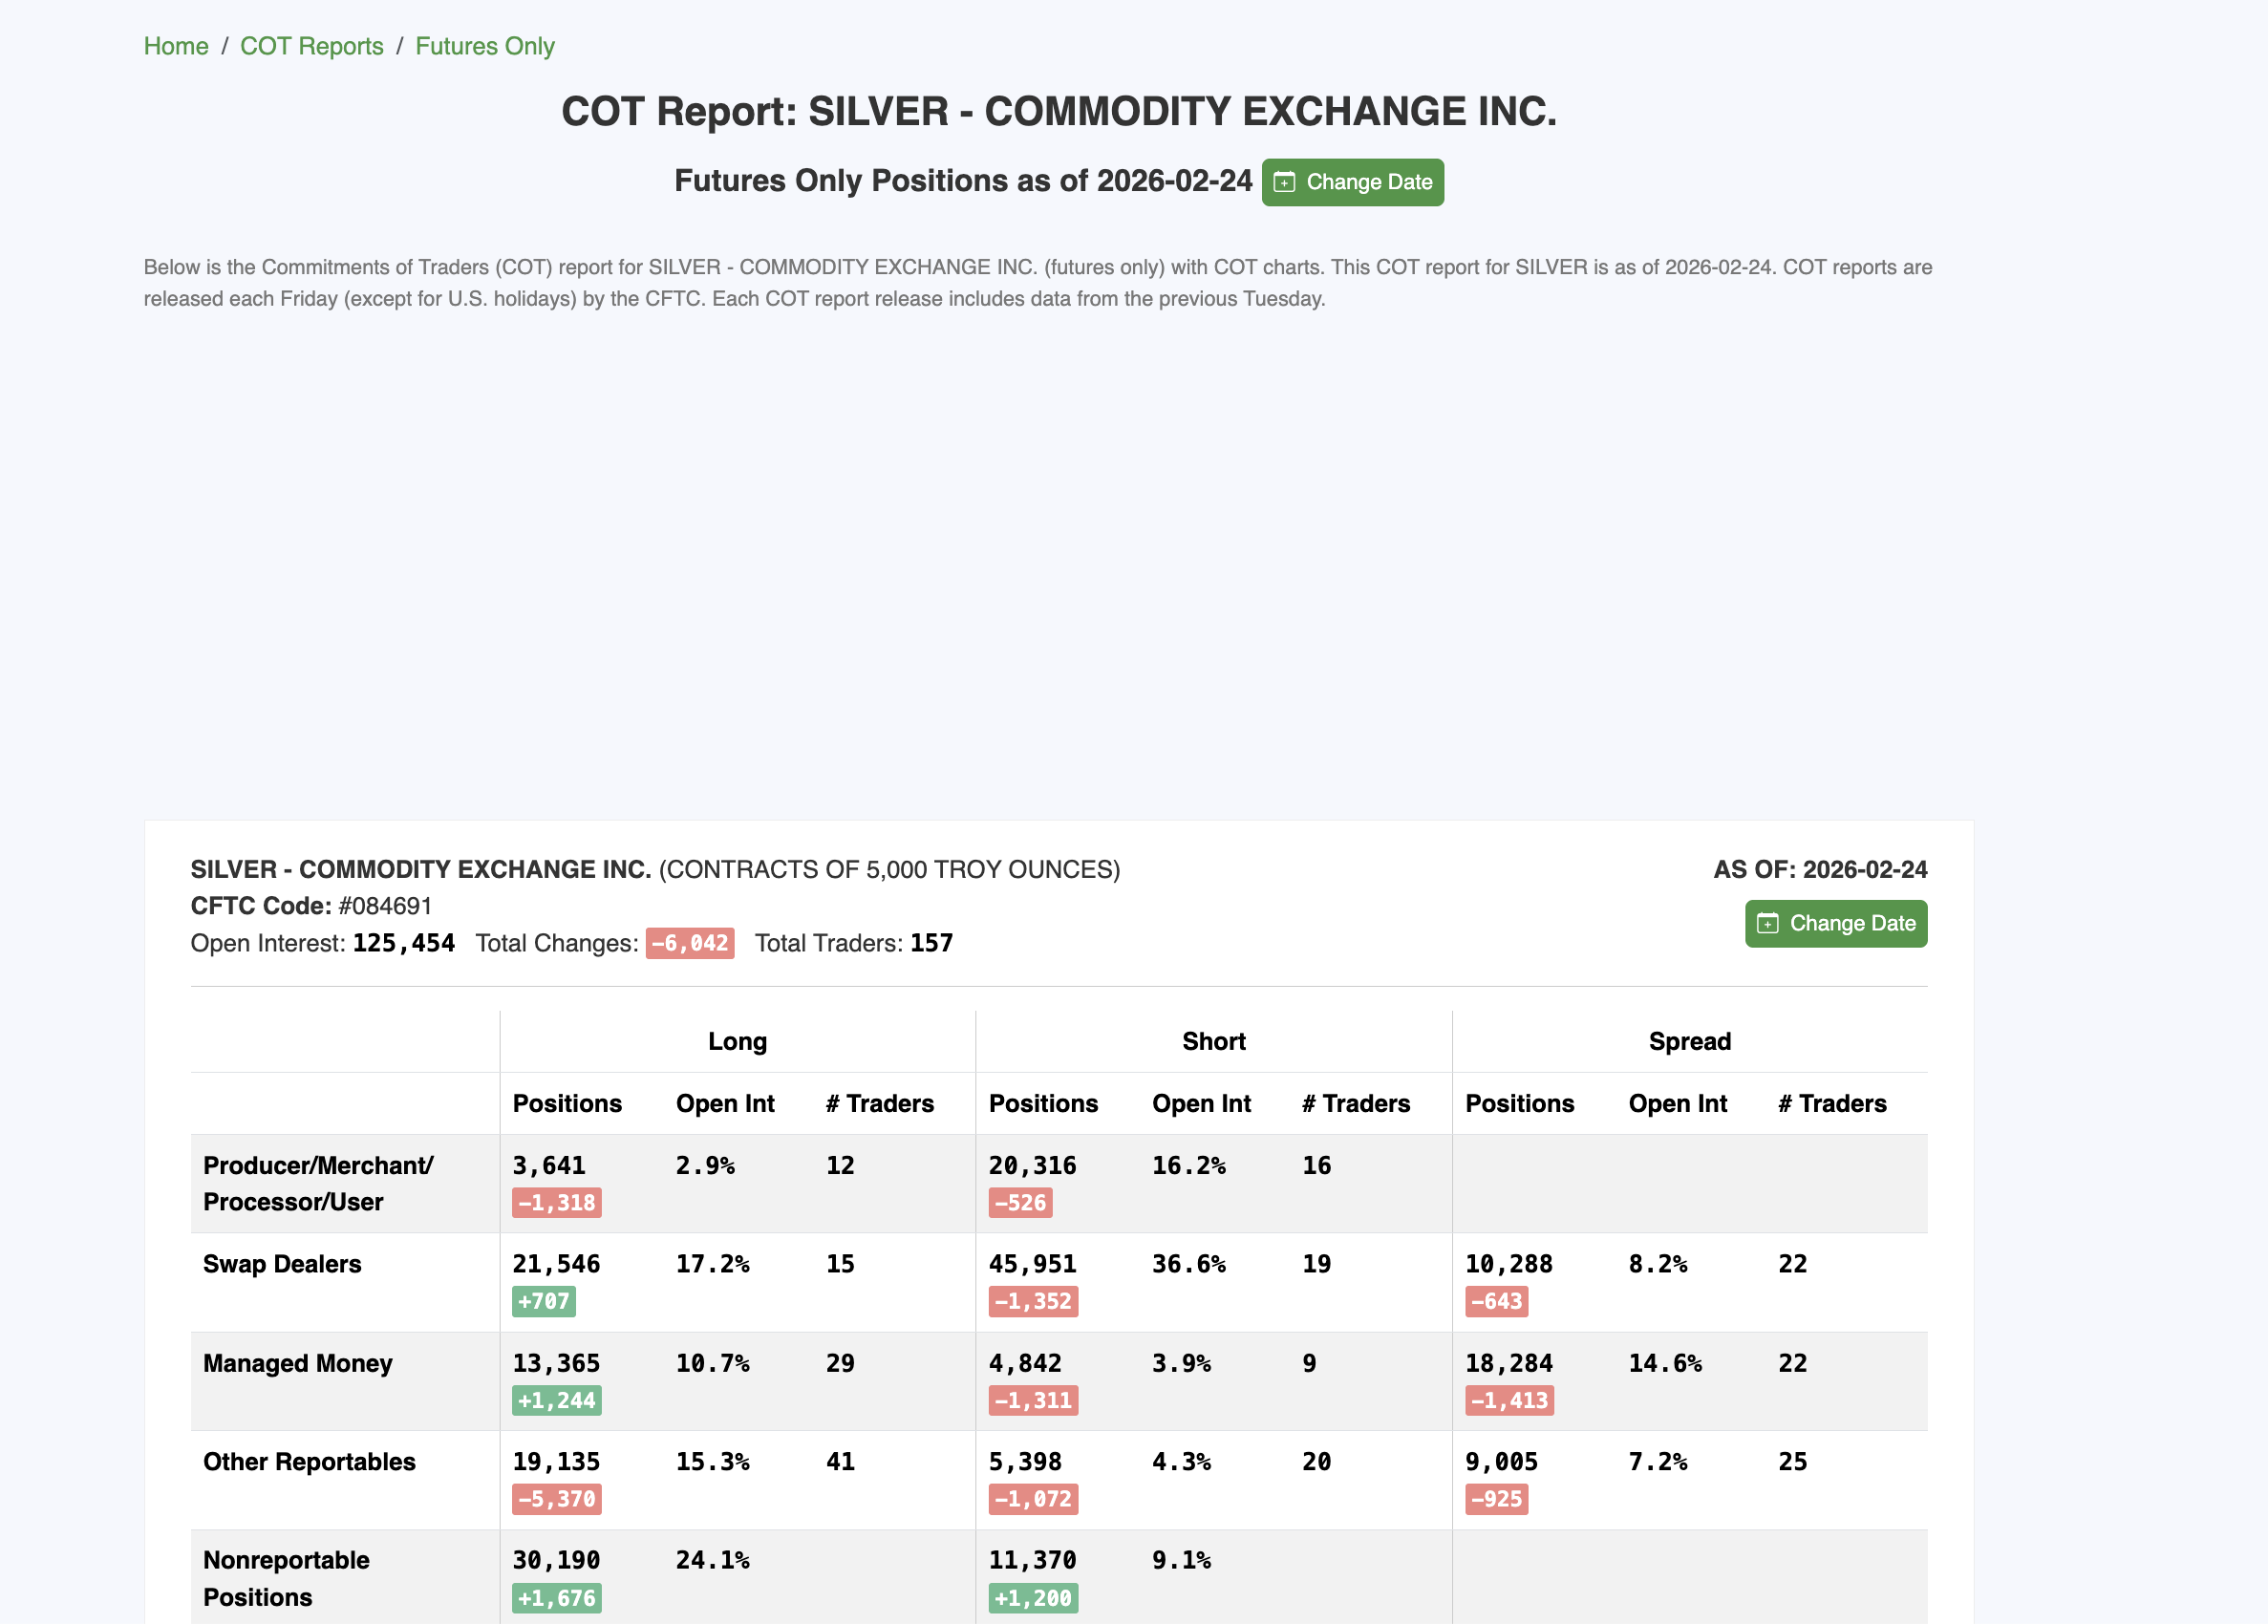
But context matters. Managed Money net longs peaked near 45,000 contracts in July 2025 and have since declined by over 80%.
At 8,500, hedge funds are barely back in. The gap between current positioning and mid-2025 levels represents massive dry powder for a sustained Silver price rally once a confirmed base forms. Total open interest continues to decline (relative to the data released on February 17), confirming the rally to $96 was largely short-covering rather than fresh institutional buying. New longs need to enter for the breakout to sustain.
Silver Price Levels And Targets to Track
Three of four signals from the February 21 analysis have weakened — backwardation gone, dollar surging, gold-silver ratio breaking out. Only the technical structure remains firmly bullish.
The most probable path is consolidation between $82 and $90 in early-to-mid March. A reclaim above $90 signals the handle is resolving higher. A daily close above $96-$99 confirms the cup-and-handle breakout. That is exactly why the $100 zone remains critical. It now acts both as a technical ($99.01) and a psychological resistance.
The extended targets project to $108, $115, and the full measured move at $129 to $135.
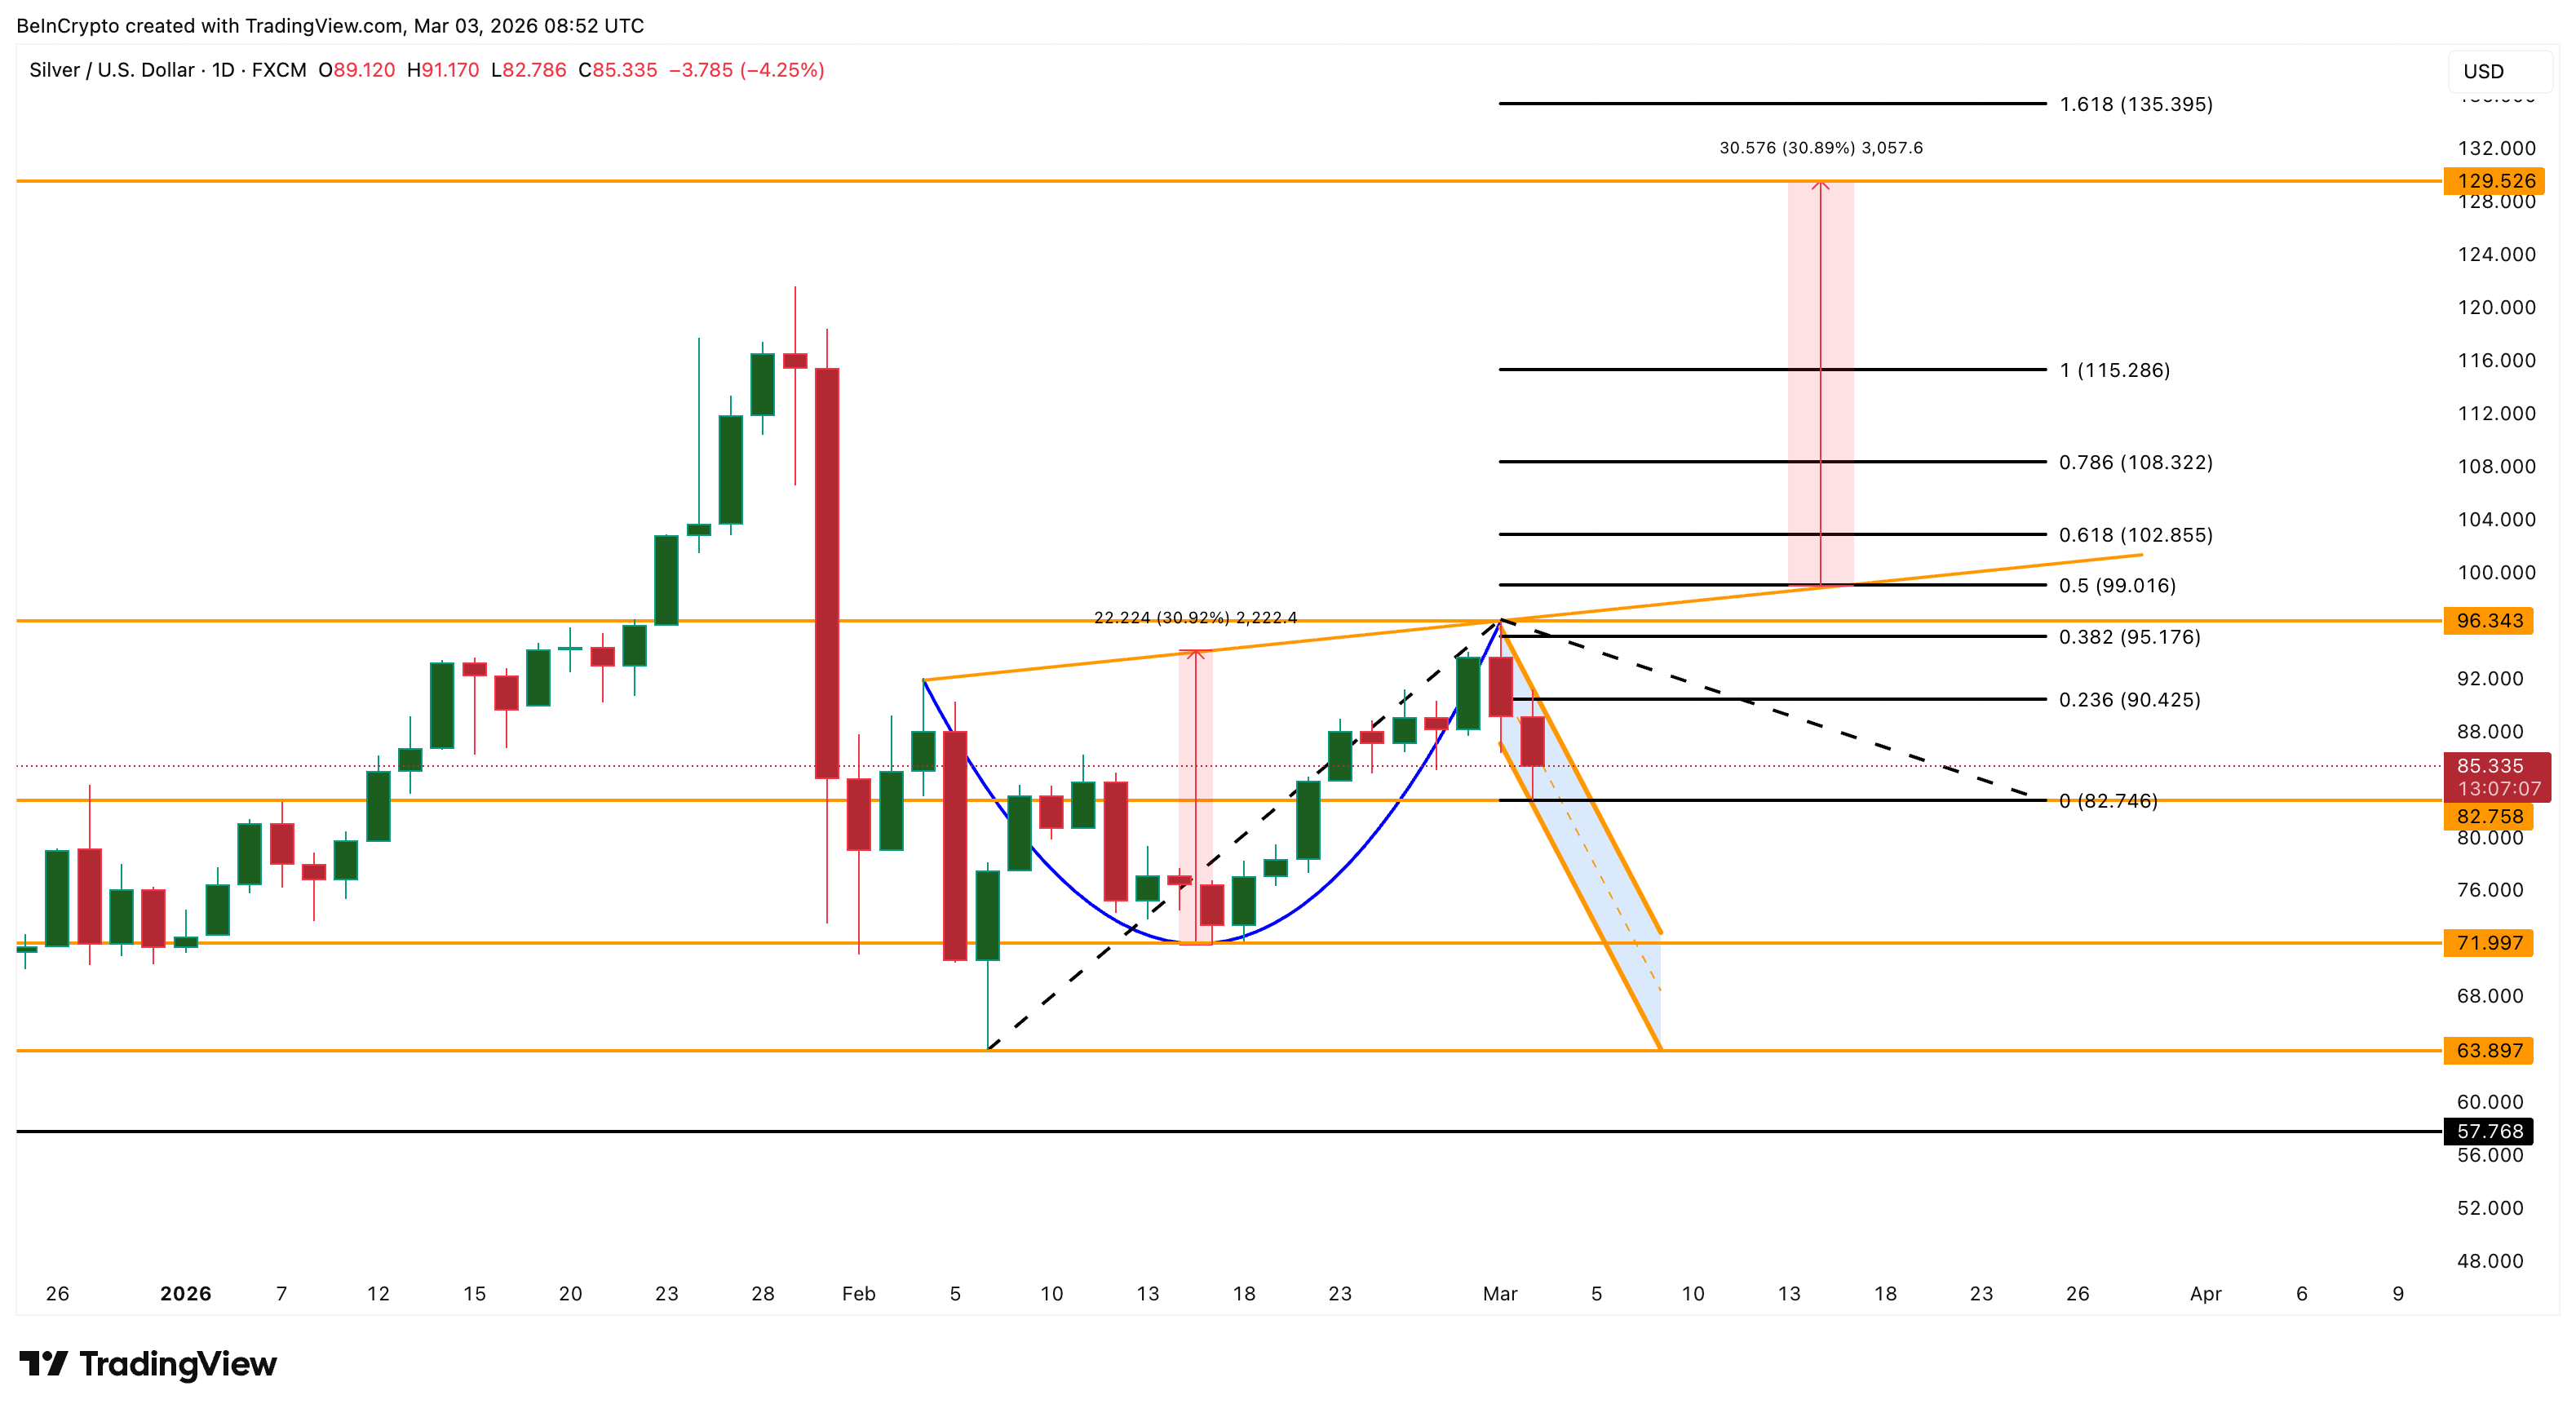
On the downside, $82 is the line in the sand for Silver. A close below invalidates the immediate divergence. Below that, $71 is the next structural support — losing it invalidates the cup entirely.
The bullish case accelerates if DXY retreats toward 97 to 98. And if the gold-silver ratio fails back below 60, and backwardation re-emerges on COMEX. Until at least two of these converge, the road to $100 stays open. However, the market is making bulls earn it.
The post Silver Price Analysis: Road To $100 Stays Open, But Macro Headwinds Build appeared first on BeInCrypto.