Pump.fun (PUMP) is trading at $0.0018, attempting to recover from an 18% decline that pulled the token to a low of $0.0016. Two on-chain signals and a weakening momentum indicator all suggest the path back to $0.0020 is not straightforward.
The recovery hinges on a specific group of holders — and right now, that group is still imbuing hope.
Long-Term PUMP Holders Haven’t Stopped Selling
The Glassnode HODLer net position change chart covers PUMP from February 18 through March 25, 2026. Every single bar on that chart is red, without exception. Not one day in that period saw long-term holders accumulate on net.
The scale of those outflows matters. Daily net position changes range from roughly -2 billion to -14 billion PUMP tokens, with the largest exits occurring in late February and again around March 16–19. Price has remained range-bound near $0.0020 throughout, meaning sellers have been absorbing any demand that does emerge.
Want more token insights like this? Sign up for Editor Harsh Notariya’s Daily Crypto Newsletter here.
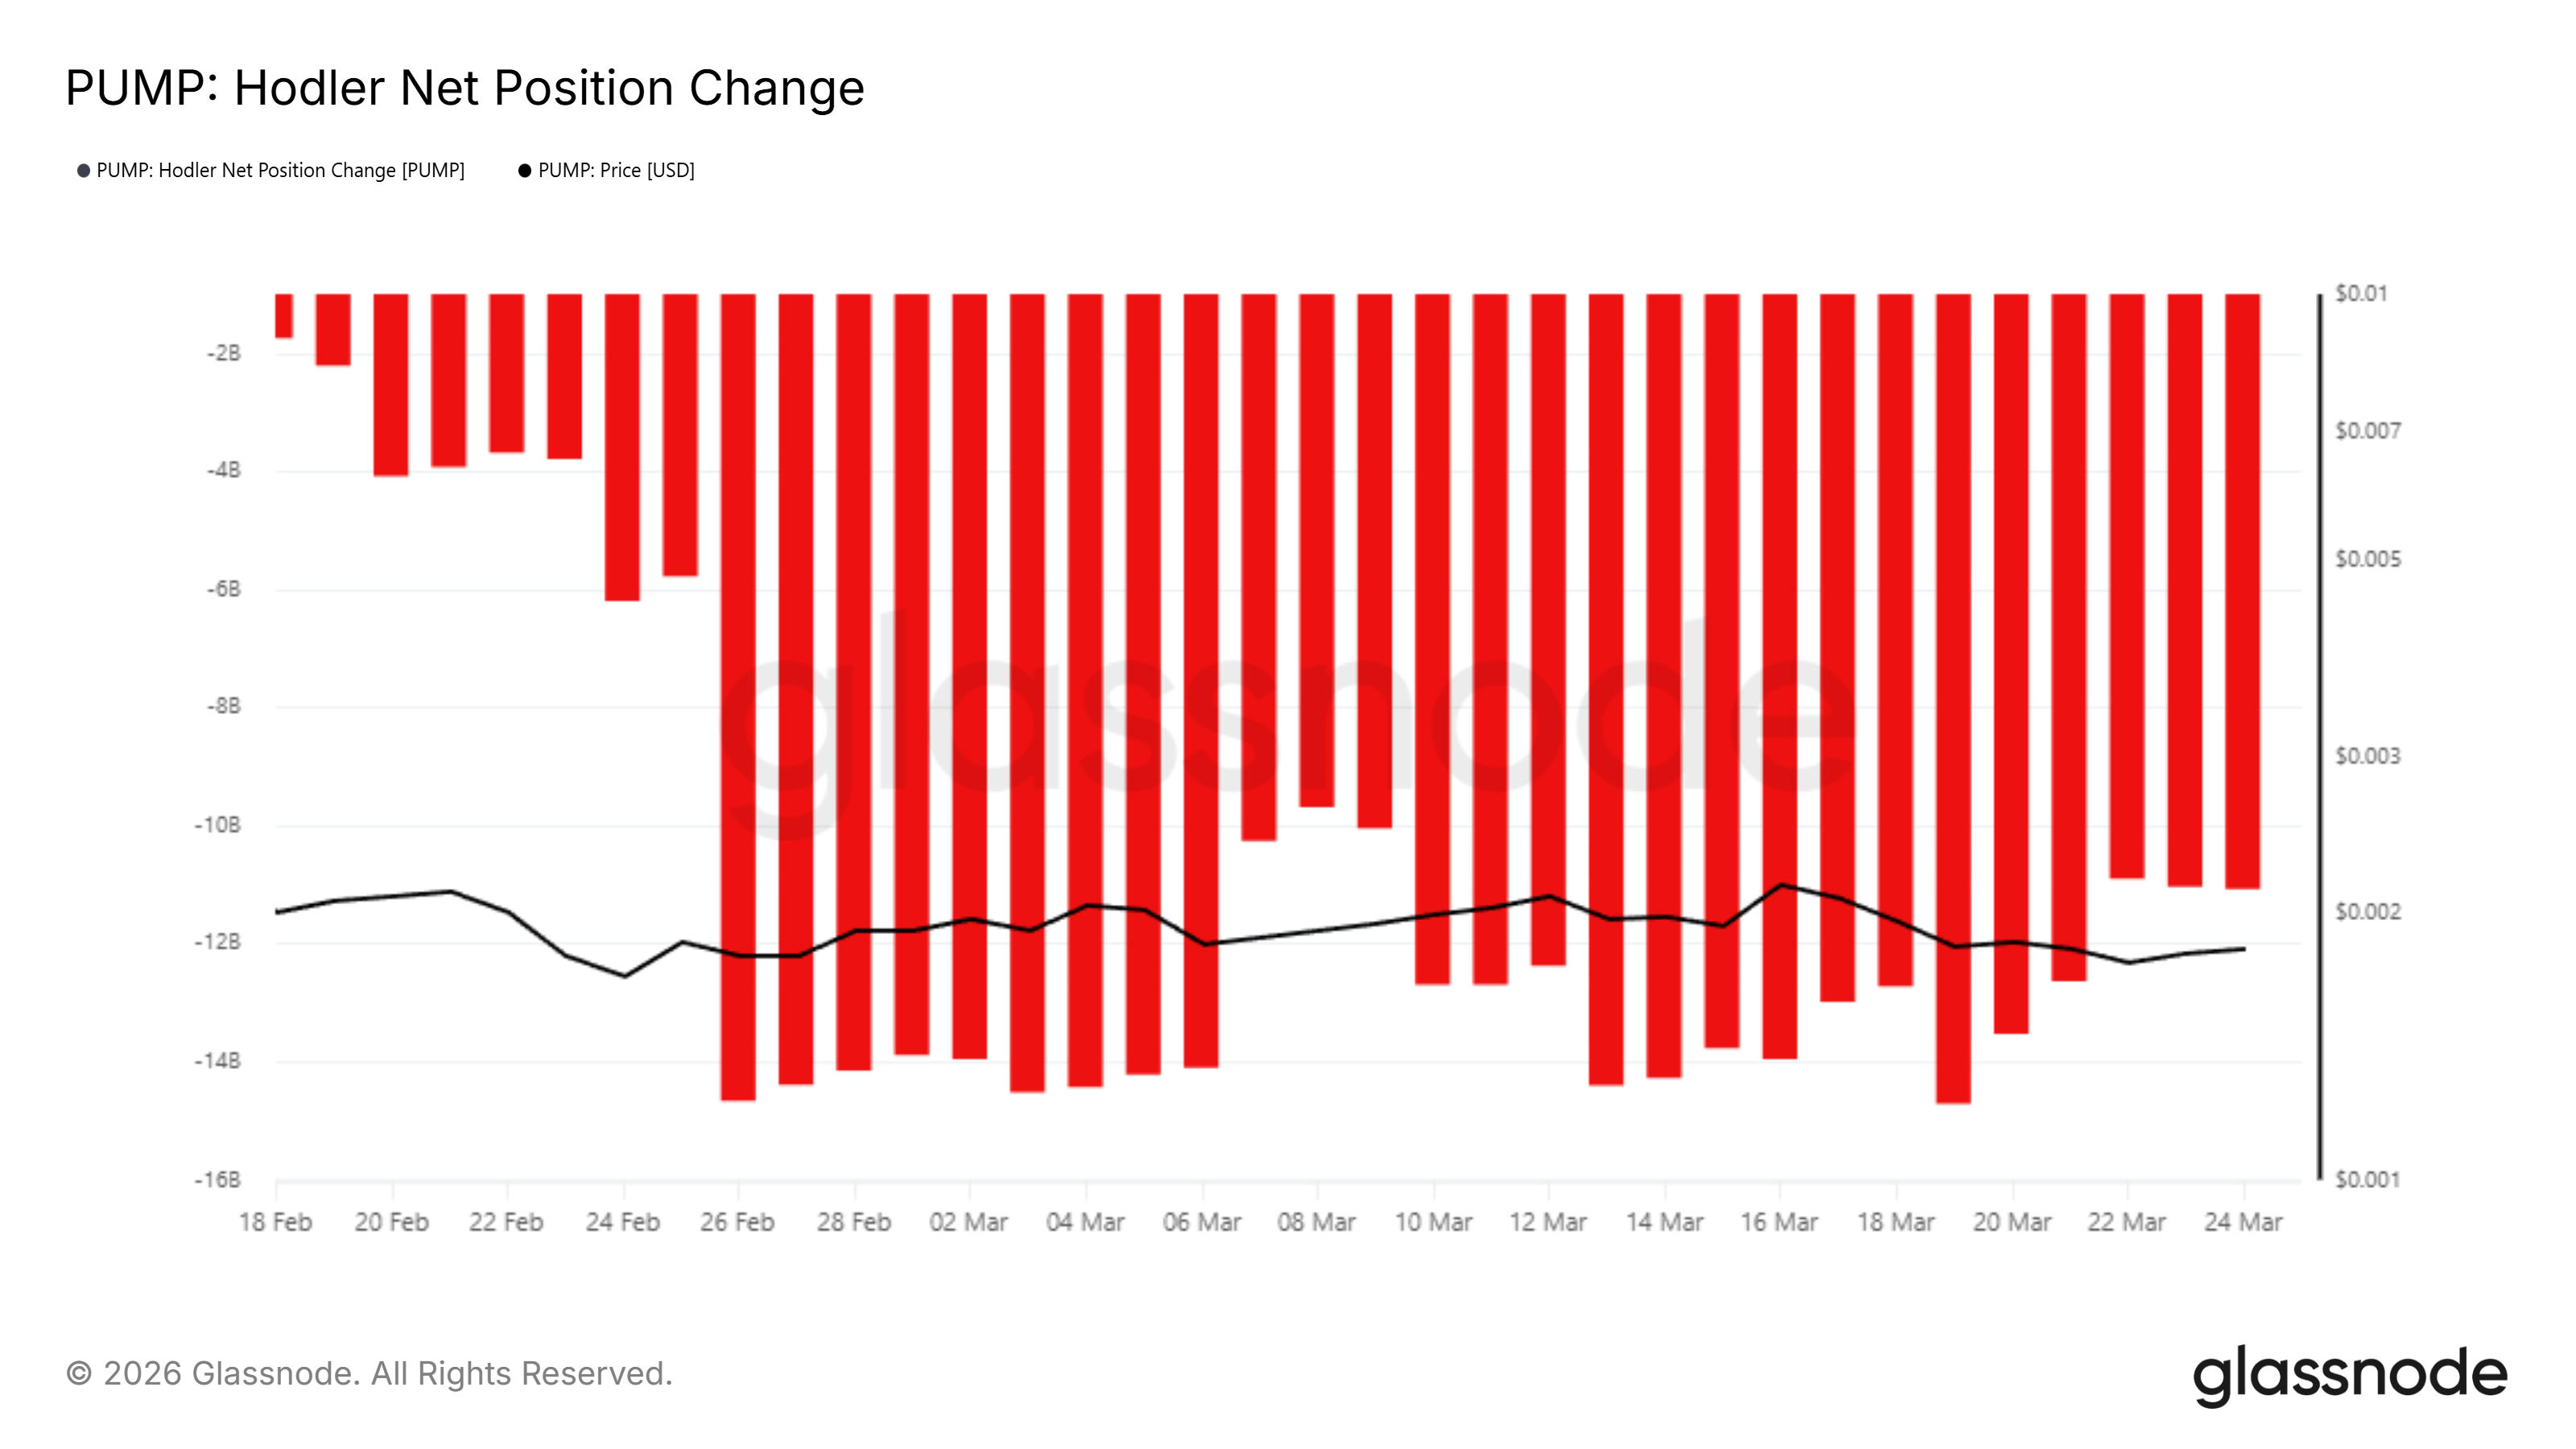
Long-term holder behavior is typically the most reliable indicator of conviction in a token. Sustained outflows of this magnitude, across more than five consecutive weeks, indicate that the cohort with the most history with PUMP is not viewing current prices as a buying opportunity.
PUMP Selling vs Buying Pressure
The Money Flow Index (MFI) tells a secondary but reinforcing story. After bottoming near 10 on February 11 — deep in oversold territory — the indicator recovered sharply, reaching above 75 multiple times between early and mid-March as PUMP price briefly climbed.
As of March 25, MFI sits at 49.93. That reading is technically neutral, positioned right at the midpoint between overbought and oversold. The concern is the direction.
MFI has declined from its March highs in a consistent step-down pattern, dropping from 75 to the current level without a sustained rebound.
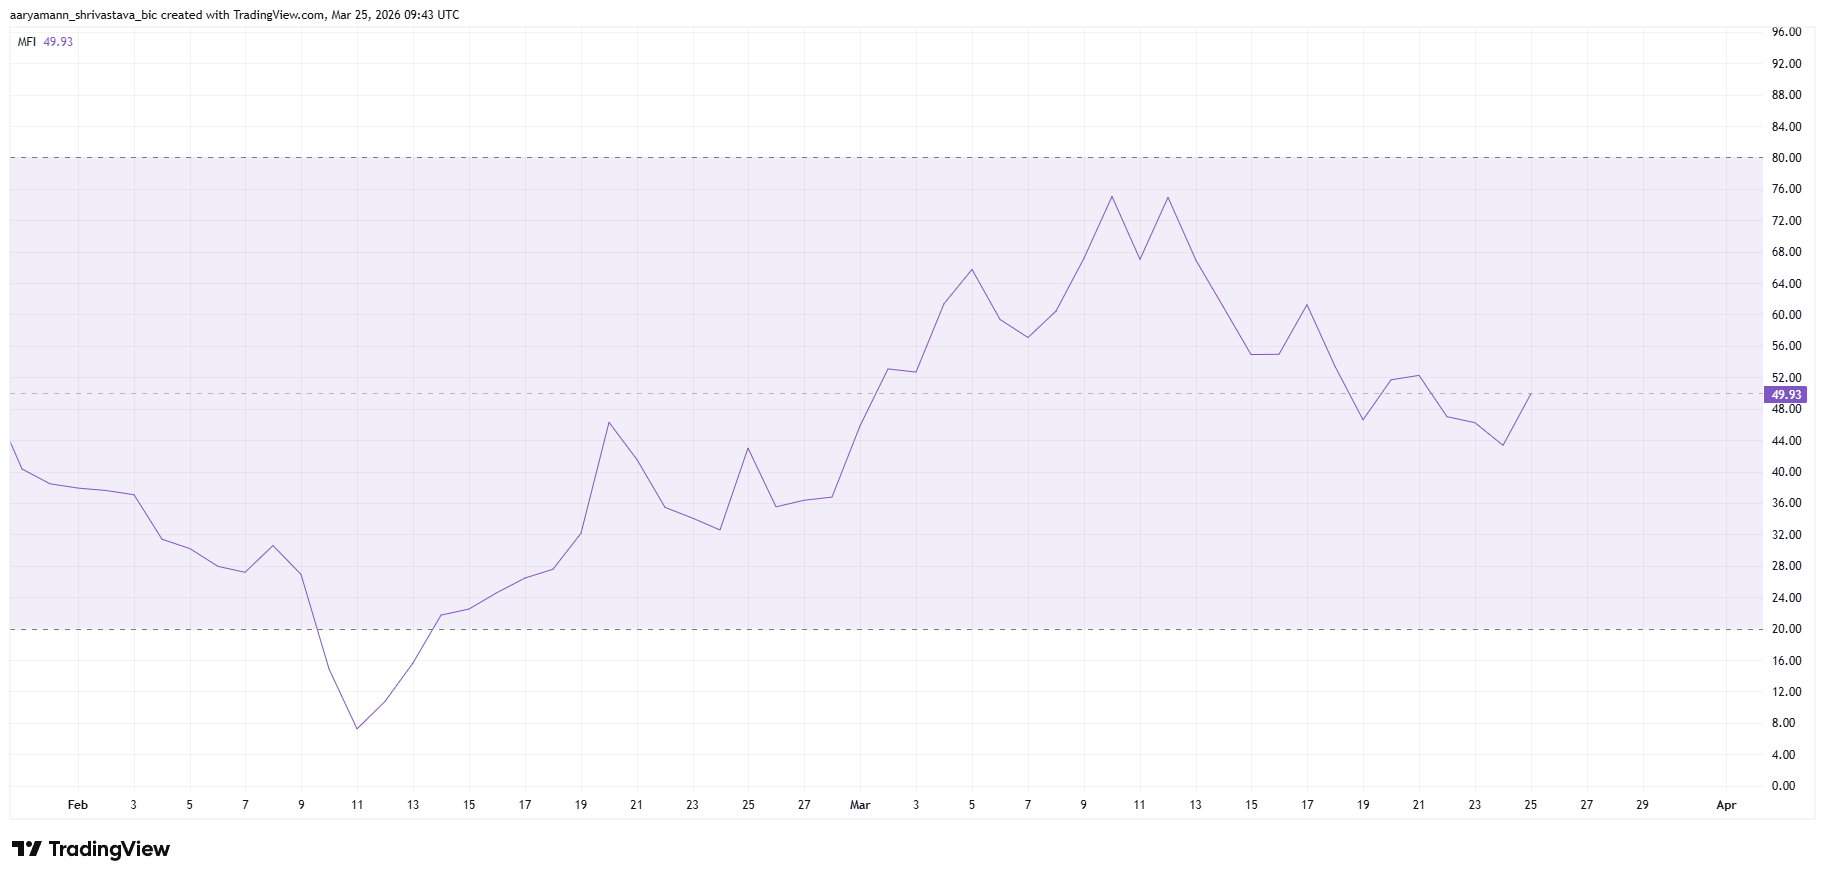
A neutral MFI alongside persistent hodler selling means buying pressure is present but not accelerating. Buyers are not overwhelming sellers — they are merely matching them, which is insufficient to drive a recovery.
New PUMP Address Growth Is Slowing — and That’s the Wildcard
Despite the bearish signals above, one chart offers a conditional argument for recovery. The Glassnode new address growth chart shows PUMP adding net positive addresses every day from late February through March 25, with the total count of addresses holding non-zero balances rising from around 117,000 in mid-February to approximately 118,200 by March 20.
However, the pace is decelerating. The green bars representing daily net address growth peaked in size around March 11–17 and have since shrunk noticeably through March 23–25. The orange line tracking total addresses with non-zero balances has also started curling downward at the right edge of the chart.
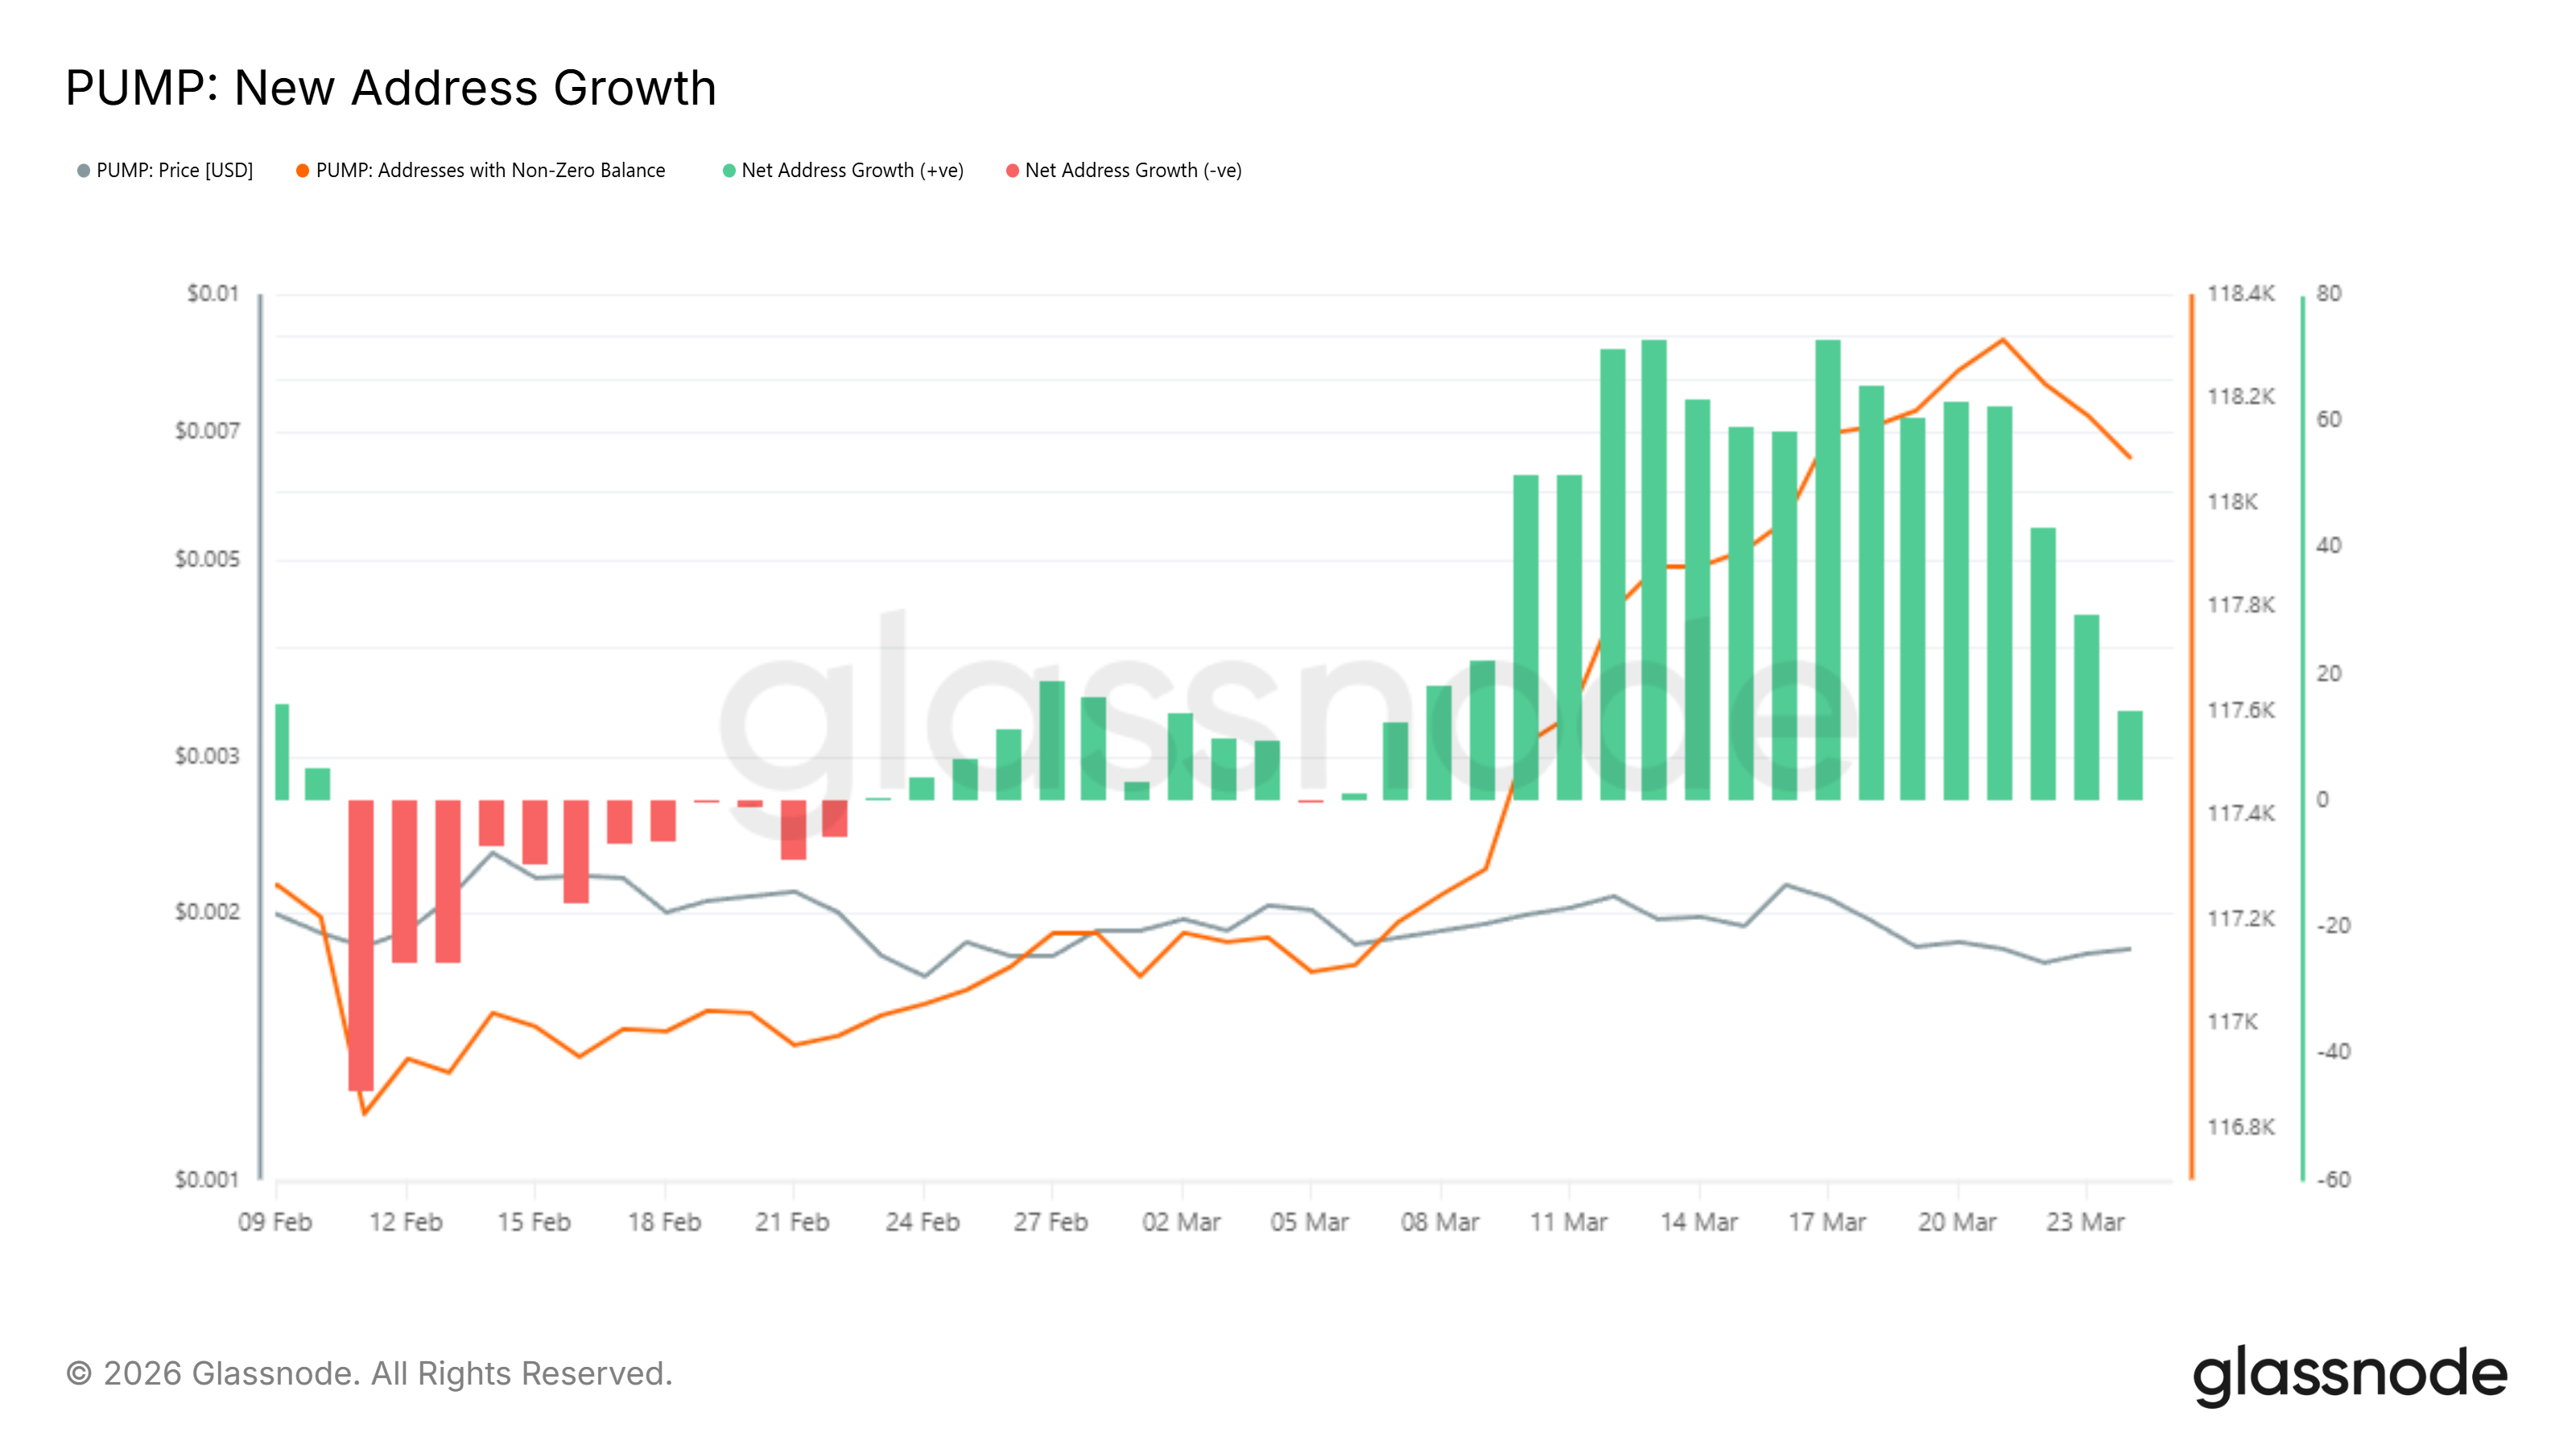
New addresses entering a token’s ecosystem represent fresh capital and new demand. If that growth stabilizes or turns negative, the one remaining supportive signal disappears. For the recovery to gain traction, PUMP needs this number to reverse and begin expanding again.
PUMP Price May Suffer Without Fresh Demand
The daily chart on Binance shows PUMP at $0.0018, operating both the descending 20-day EMA at $0.0019 and the 23.6% Fibonacci retracement level at $0.0018. The Fibonacci grid runs from the cycle low at $0.0016 to the recent swing high near $0.0022.
The chart annotates the most recent leg down as -18.18%, a move from the $0.0022 area to the $0.0018 zone. That decline has partially recovered, but PUMP has failed to reclaim the 23.6% Fibonacci level on a daily close. The EMA continues to slope downward and is converging with the price from above, creating a ceiling rather than support.
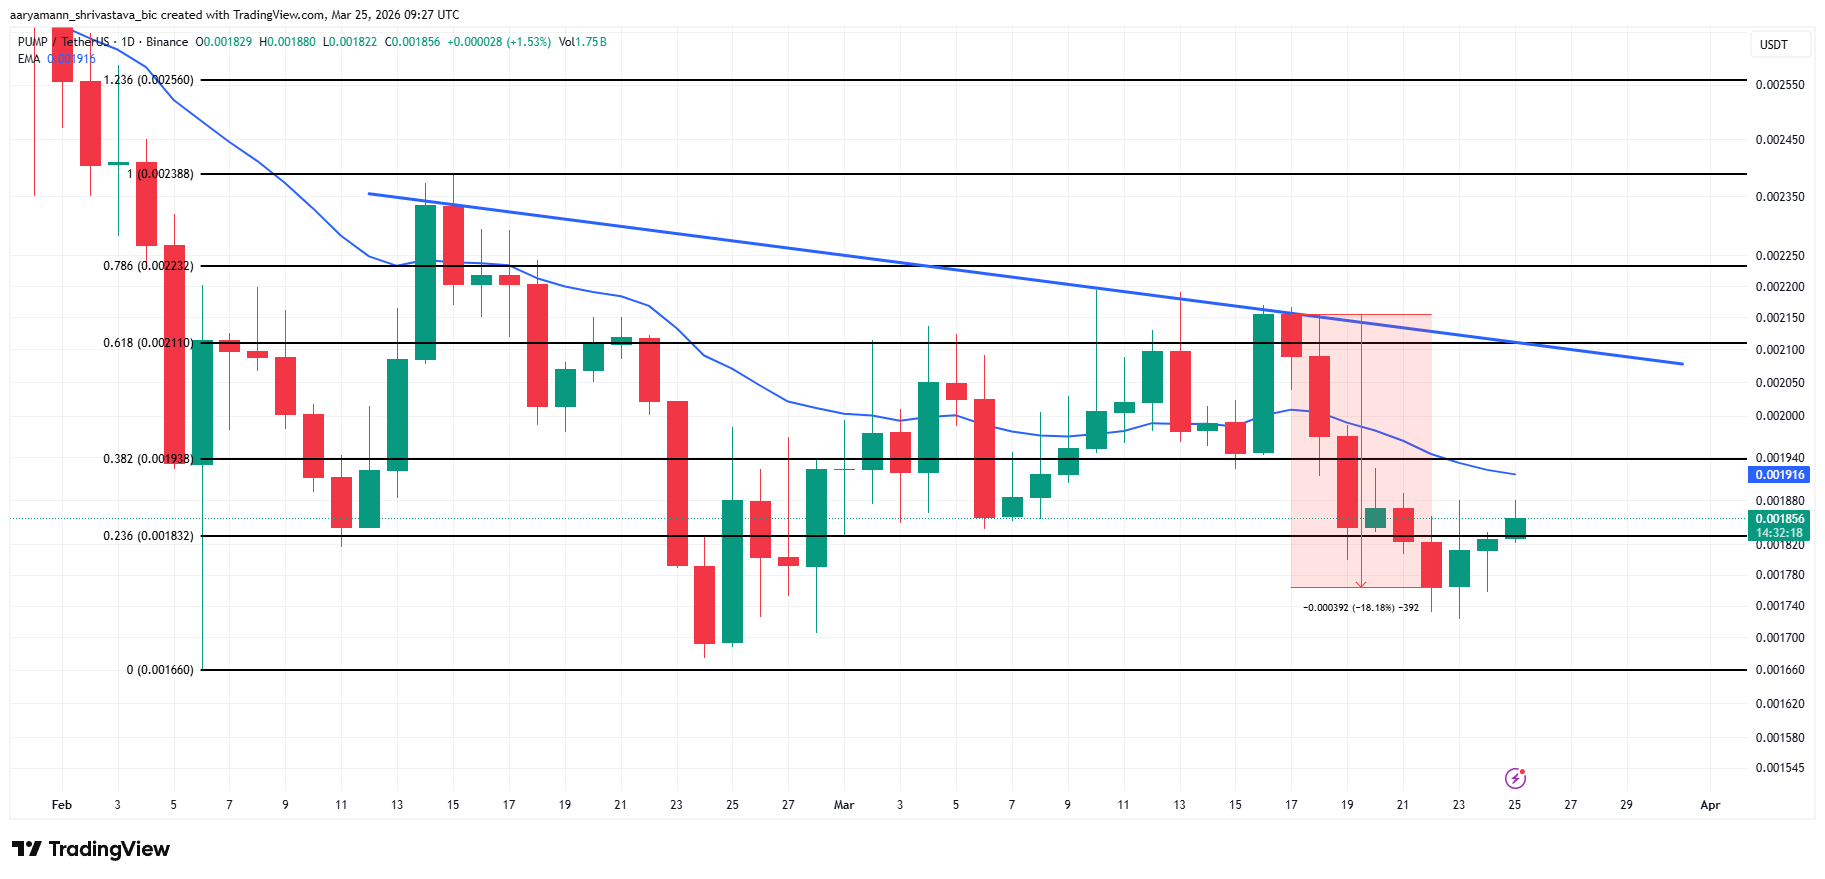
With hodler outflows uninterrupted, MFI declining from overbought conditions, and new address growth decelerating, the conditions for a sustained recovery above $0.0019, the 38.2% Fibonacci level, are not in place. Below current levels, $0.0018 is the first support, followed by $0.0017 as the cycle low.
A daily close below $0.0018 opens the door directly to retesting that floor.
The bullish invalidation scenario requires a daily close above $0.0021, which is the 61.8% Fibonacci level. Above that, $0.0022 becomes the next target, with the 1.236 extension at $0.0025 representing the upper end of the recovery range. For that to materialize, new address growth would need to re-accelerate, which is not currently in motion.
The post PUMP Price’s Recovery from Recent 18% Drop Hinges on These Holders appeared first on BeInCrypto.