
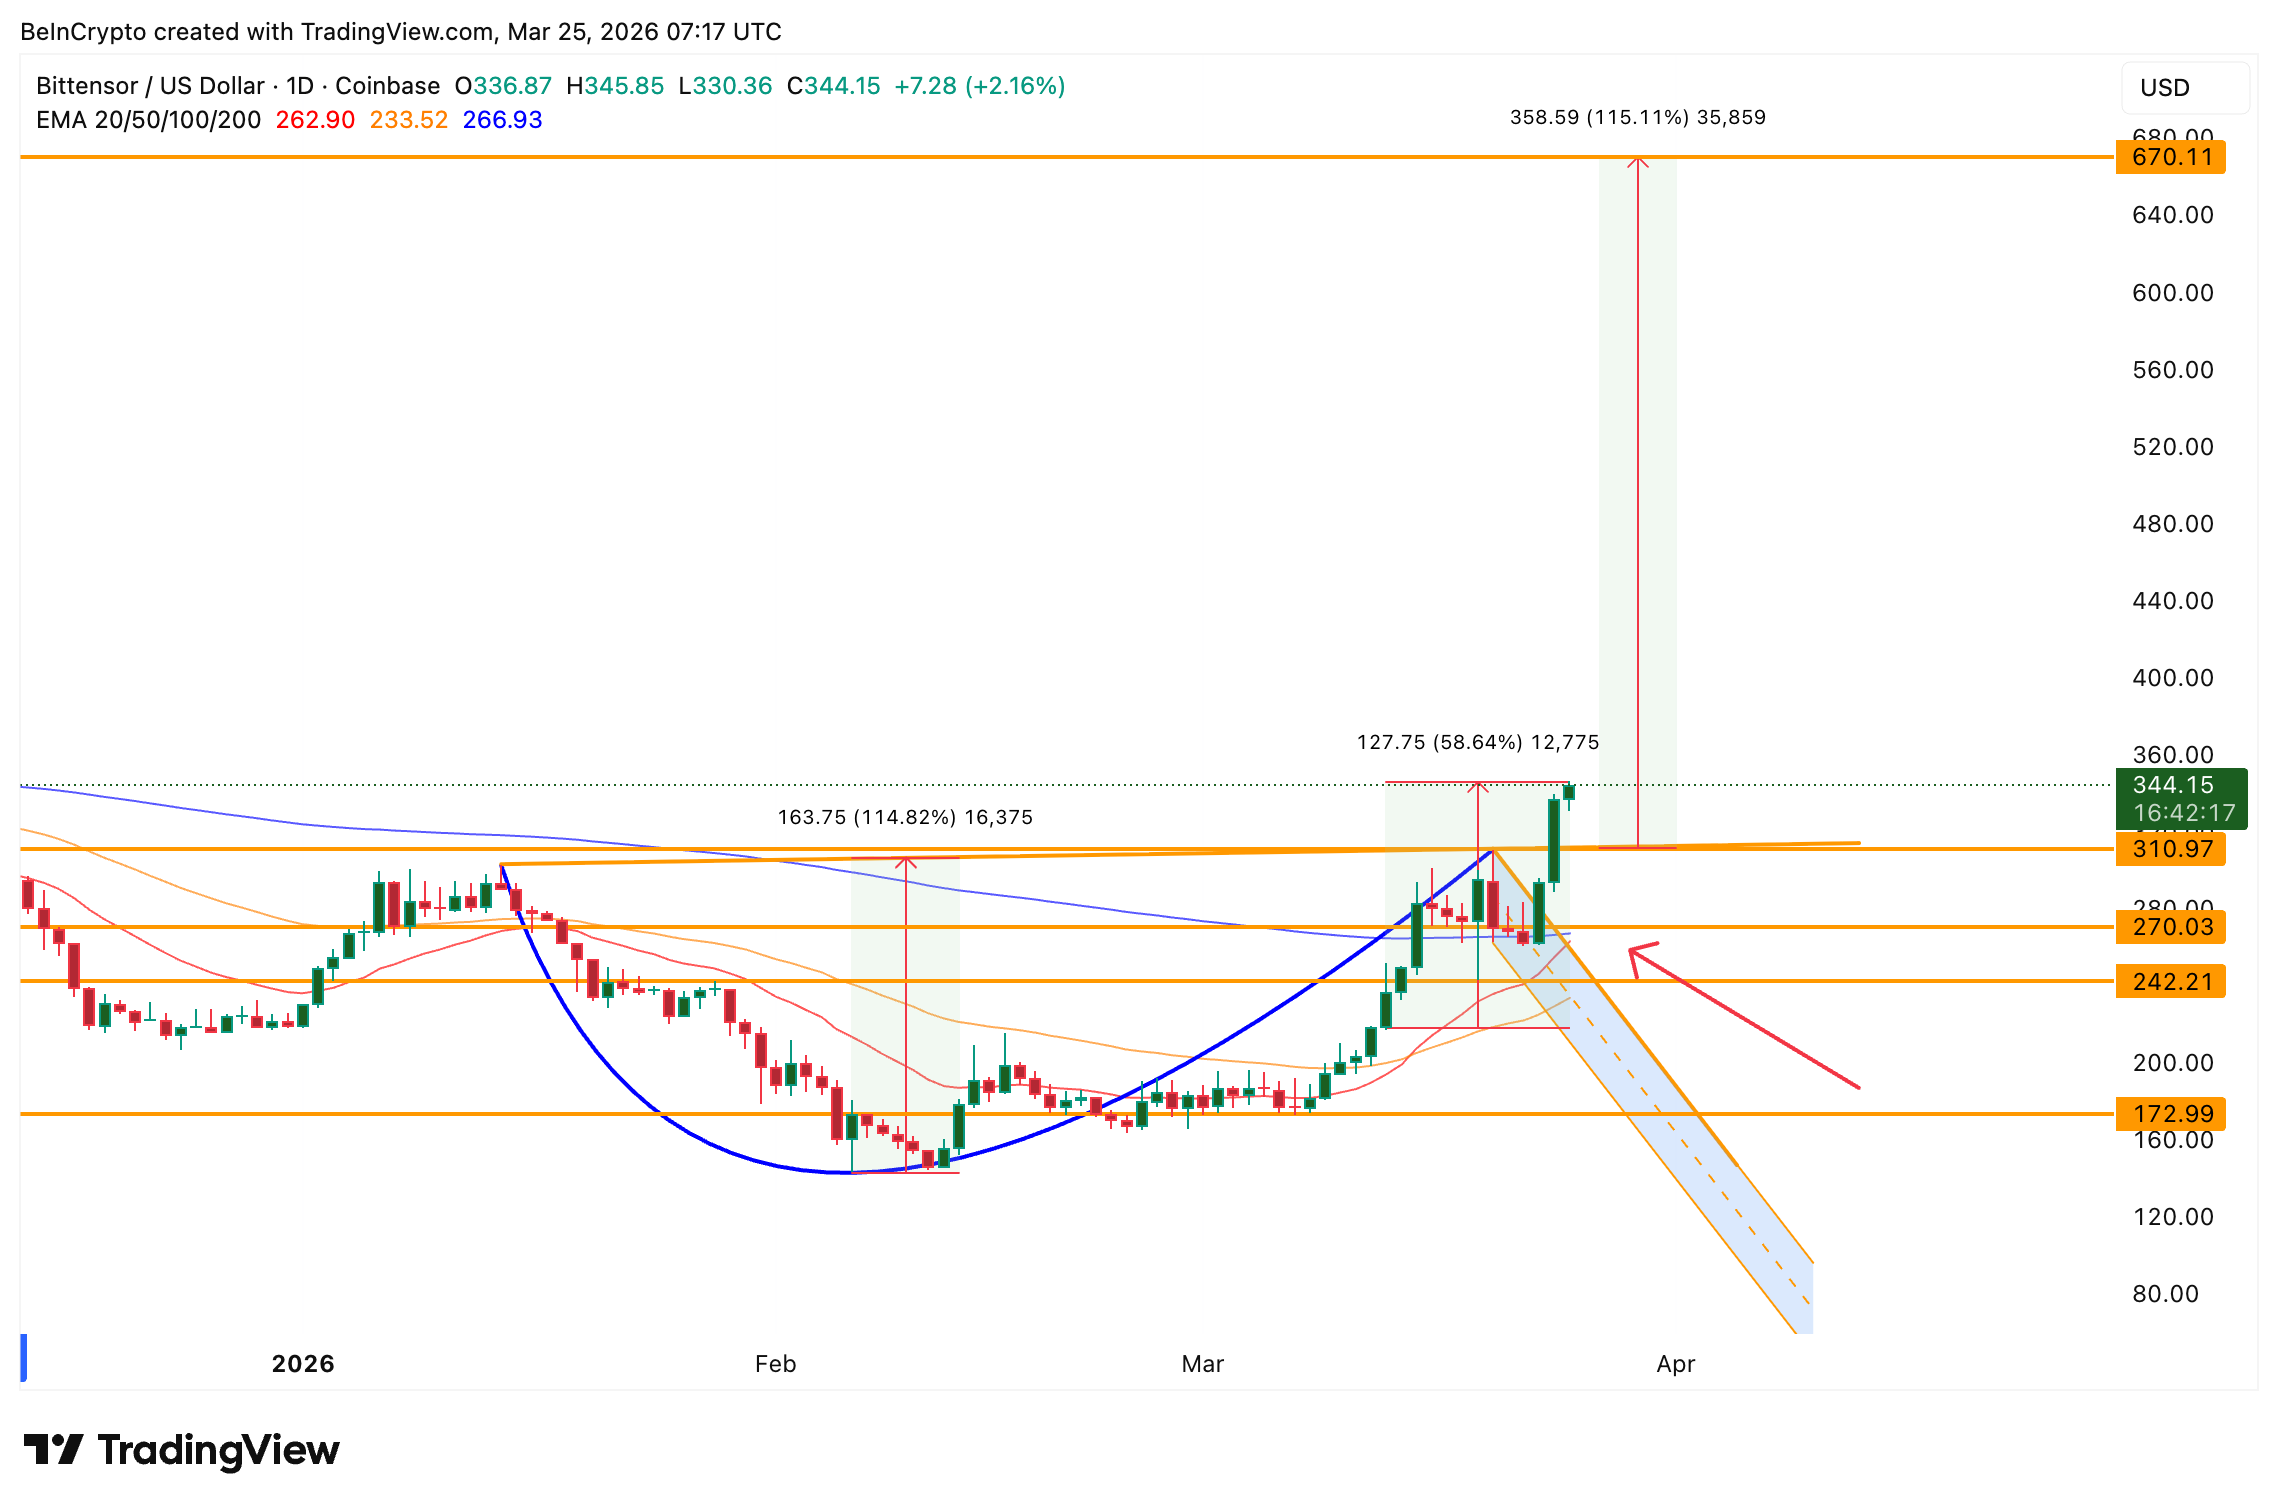
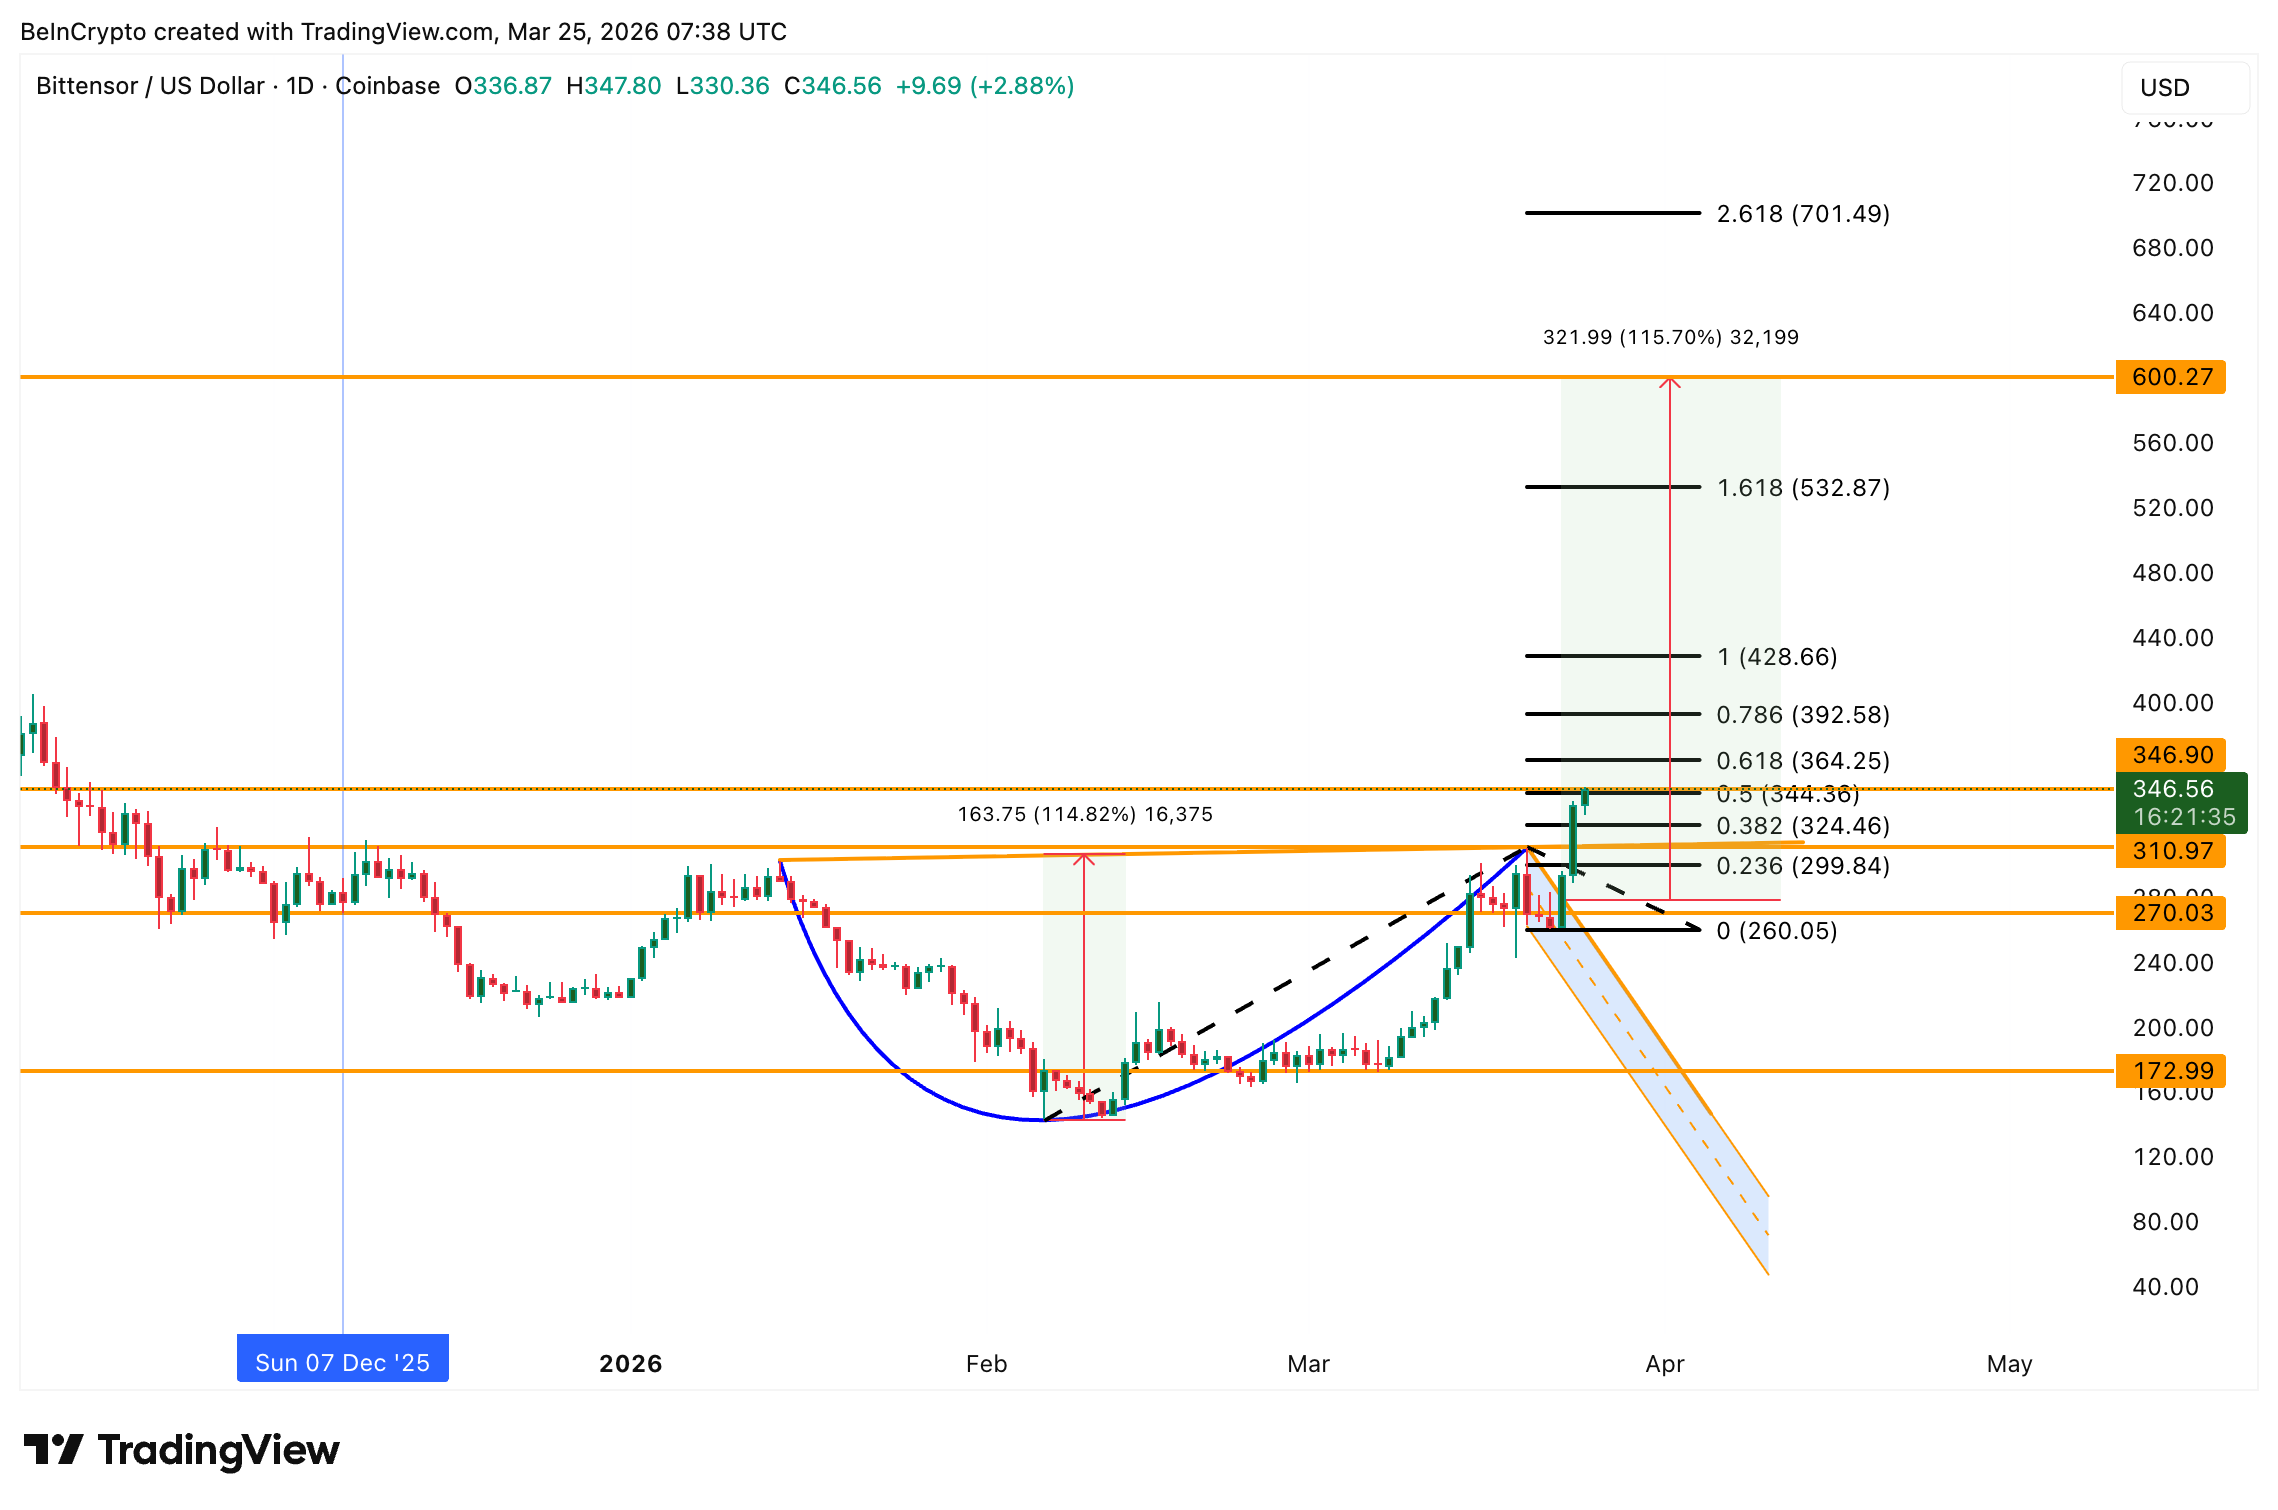
Bittensor (TAO) price surged over 10% in the past 24 hours and 22% over the past week, extending a breakout from a cup and handle pattern on the daily chart.
The rally is backed by fading sell-side pressure and a surge in social engagement. However, a lopsided leverage buildup and an emerging bearish divergence on shorter timeframes suggest that the path to higher targets may not be a straight line.
Cup and Handle Breakout Fuels 58% Move
The daily chart shows a textbook cup and handle formation that developed between late January and mid-March. A bull flag nested inside the handle added a second layer of bullish confirmation. The breakout was teased on March 23 and confirmed the same day, pushing Bittensor price above the $310 resistance zone. The original chart hinted at a potential high of $670, which has been recalibrated. For the new target, head over to the TAO price section in the end.
The move gains additional weight from an Exponential Moving Average (EMA) crossover, a trend indicator that gives greater weight to recent price movements. On March 14, the 20-day EMA crossed above the 50-day EMA. Since that bullish crossover began forming around March 13, TAO has rallied roughly 58%.
Now, a more significant crossover is approaching. The 20-day EMA is closing in on the 200-day EMA, which would form another bullish crossover on the daily timeframe.
Want more token insights like this? Sign up for Editor Harsh Notariya’s Daily Crypto Newsletter here.
The broader AI crypto narrative continues to support the move. TAO subnet staking surged 833,000% as the Bittensor ecosystem grows, reinforcing demand for the native token and giving it a fundamental backing.
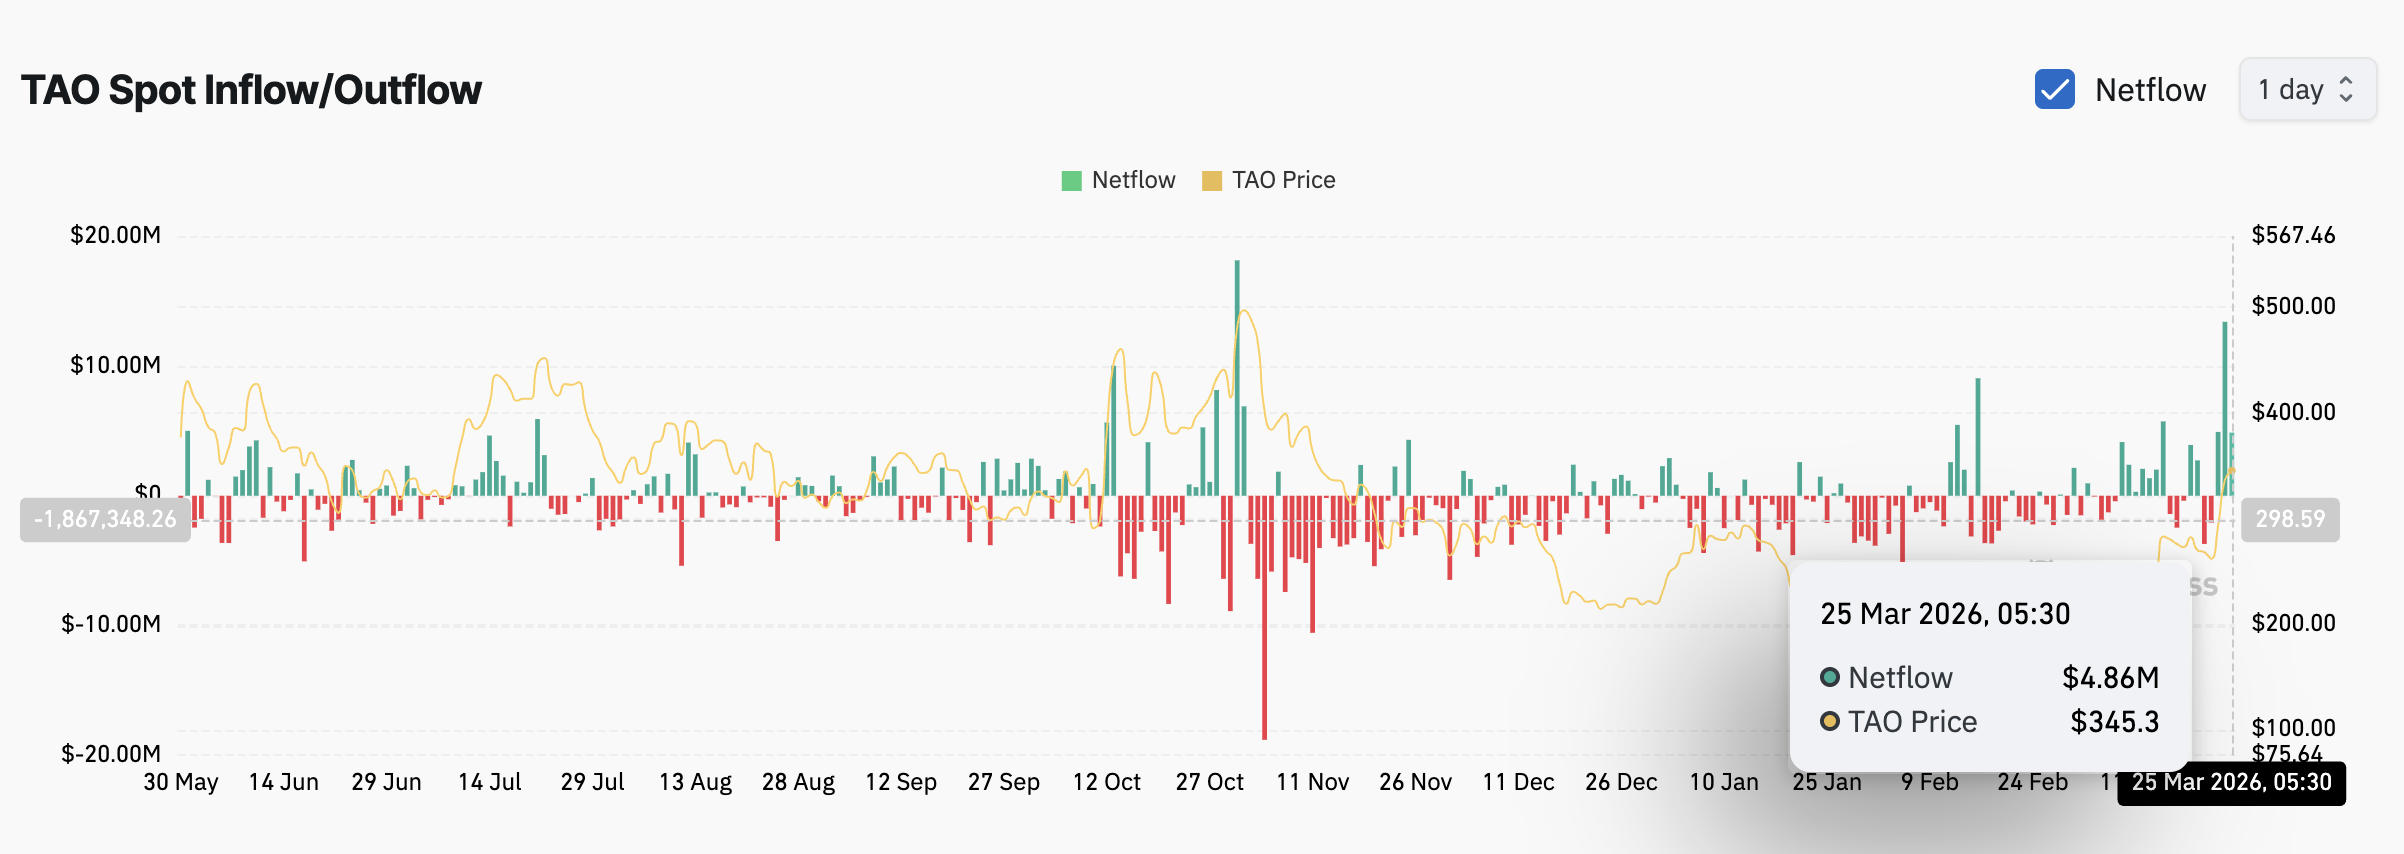
However, the rally did not go unchallenged during its formation, and exchange flow data reveals how sellers tried to cap it.
Sellers Fade as Social Dominance Hits Monthly High
On March 23, when the breakout was forming, exchange inflows spiked to $4.91 million worth of TAO, signaling that sellers were moving tokens onto exchanges. By March 24, that pressure more than doubled to $13.39 million as skeptics attempted to sell into the rally.
Yet the breakout held. And by March 25, net selling had cooled sharply, dropping back to roughly $4.86 million. The decline in spot selling pressure while the price continued climbing higher suggests that the initial wave of distribution has been absorbed.
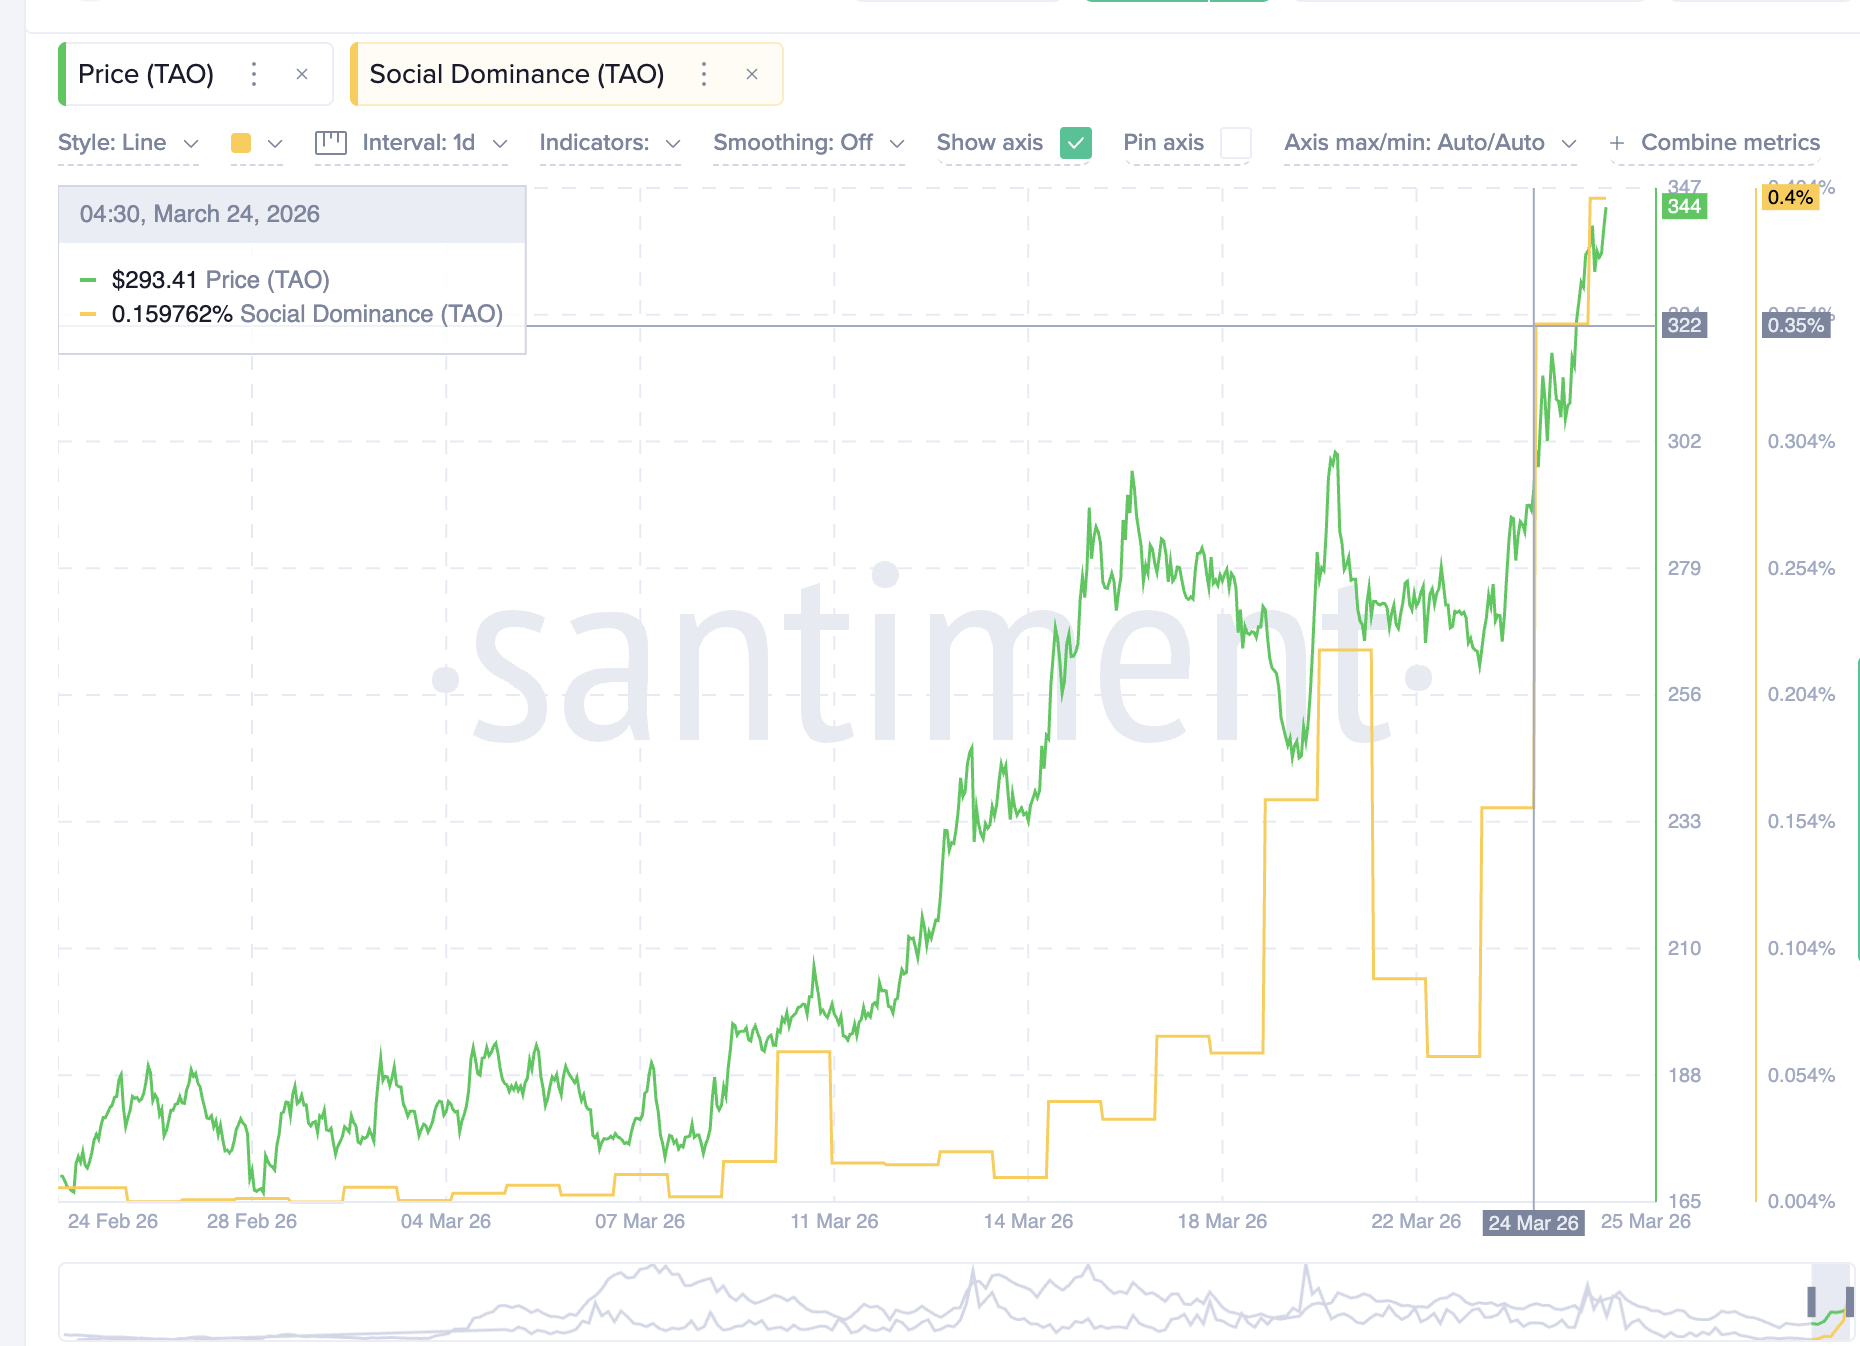
Social dominance, a Santiment metric measuring how much of the total crypto social conversation a token captures, confirms the shift. On March 24, TAO’s social dominance reached 0.35%. It has since climbed to a monthly high of 0.40%, indicating that the broader market is paying attention to the breakout and the narrative may have more room to build.
The combination of fading sellers and rising social engagement typically supports continuation. However, derivatives data introduces a risk that could interrupt the trend before it reaches its projected targets.
TAO Price Forecast and the $346 Decision Zone
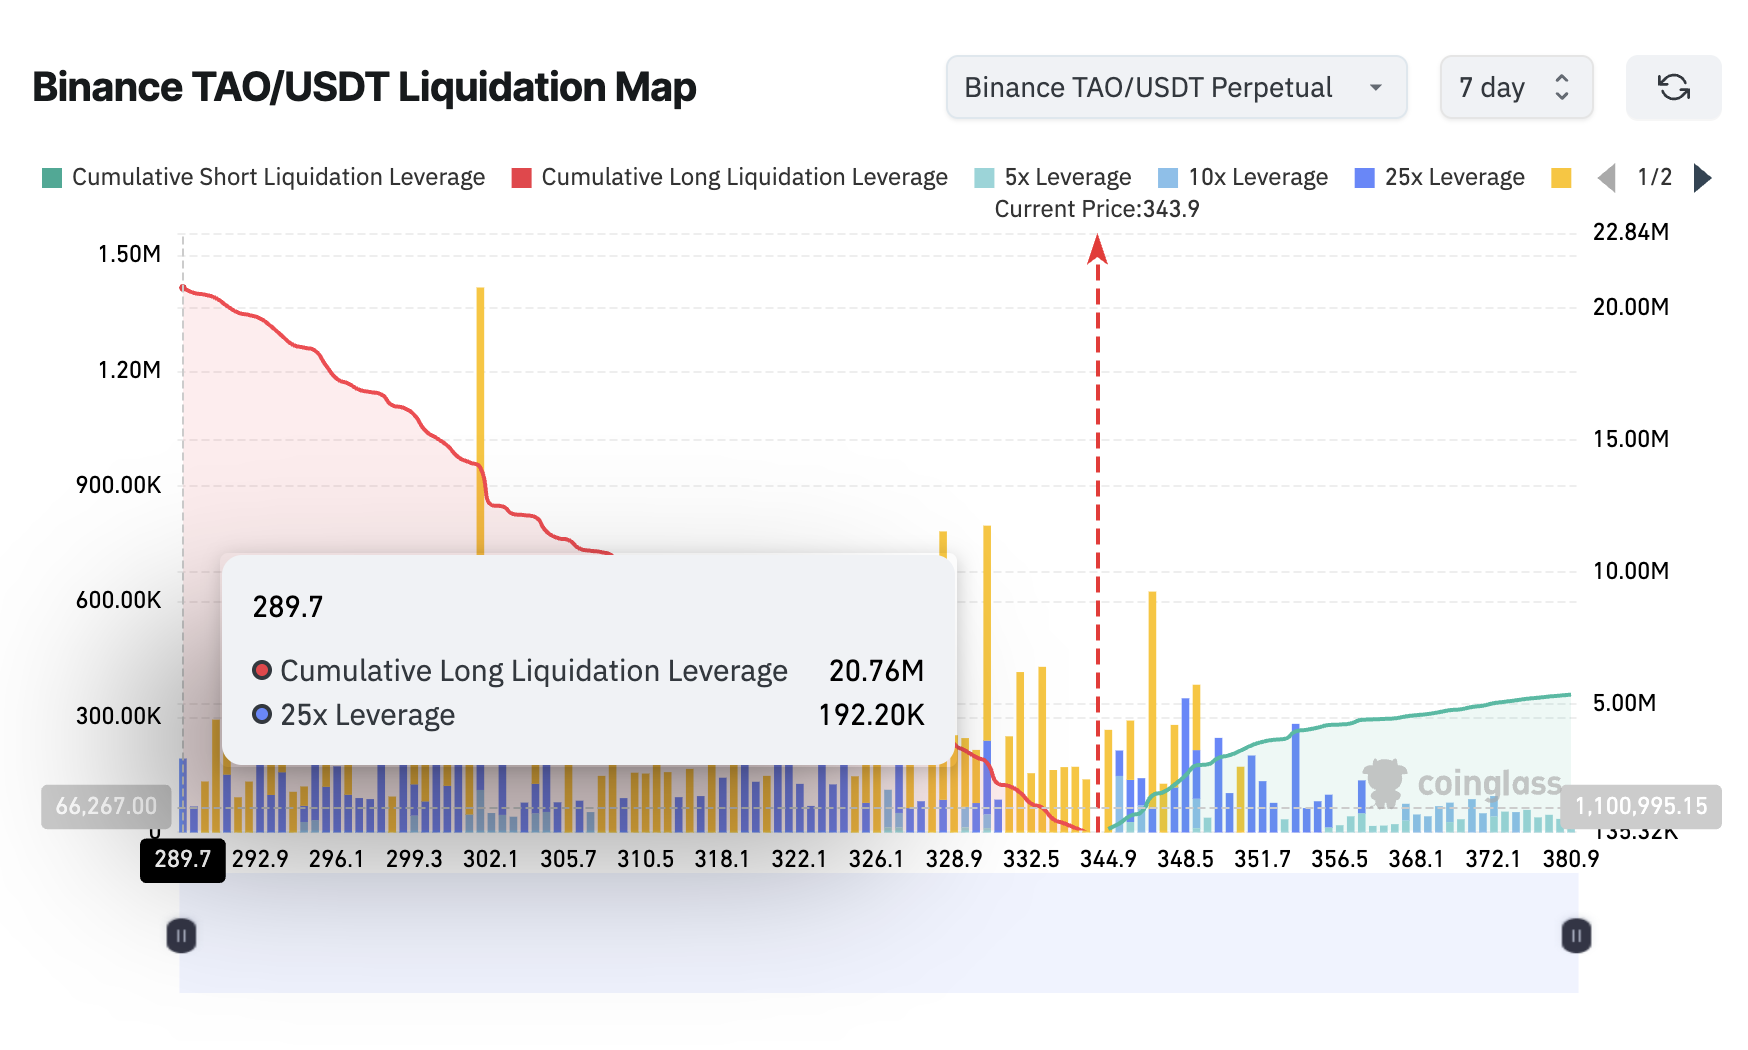
The Binance TAO/USDT perpetual liquidation map reveals a heavily one-sided market, courtesy of the breakout. The seven-day positioning data shows that cumulative long liquidation leverage has reached $20.76 million against just $5.36 million in shorts. That puts roughly 80% of total leverage on the long side, a tilt that makes the market vulnerable to a liquidation cascade if the TAO price dips sharply.
The 8-hour chart validates this concern. Between March 15 and March 25, the TAO price is forming a higher high while the Relative Strength Index (RSI), a momentum oscillator, is printing a lower high. That standard bearish divergence on a shorter timeframe suggests momentum is weakening even as the price pushes higher.
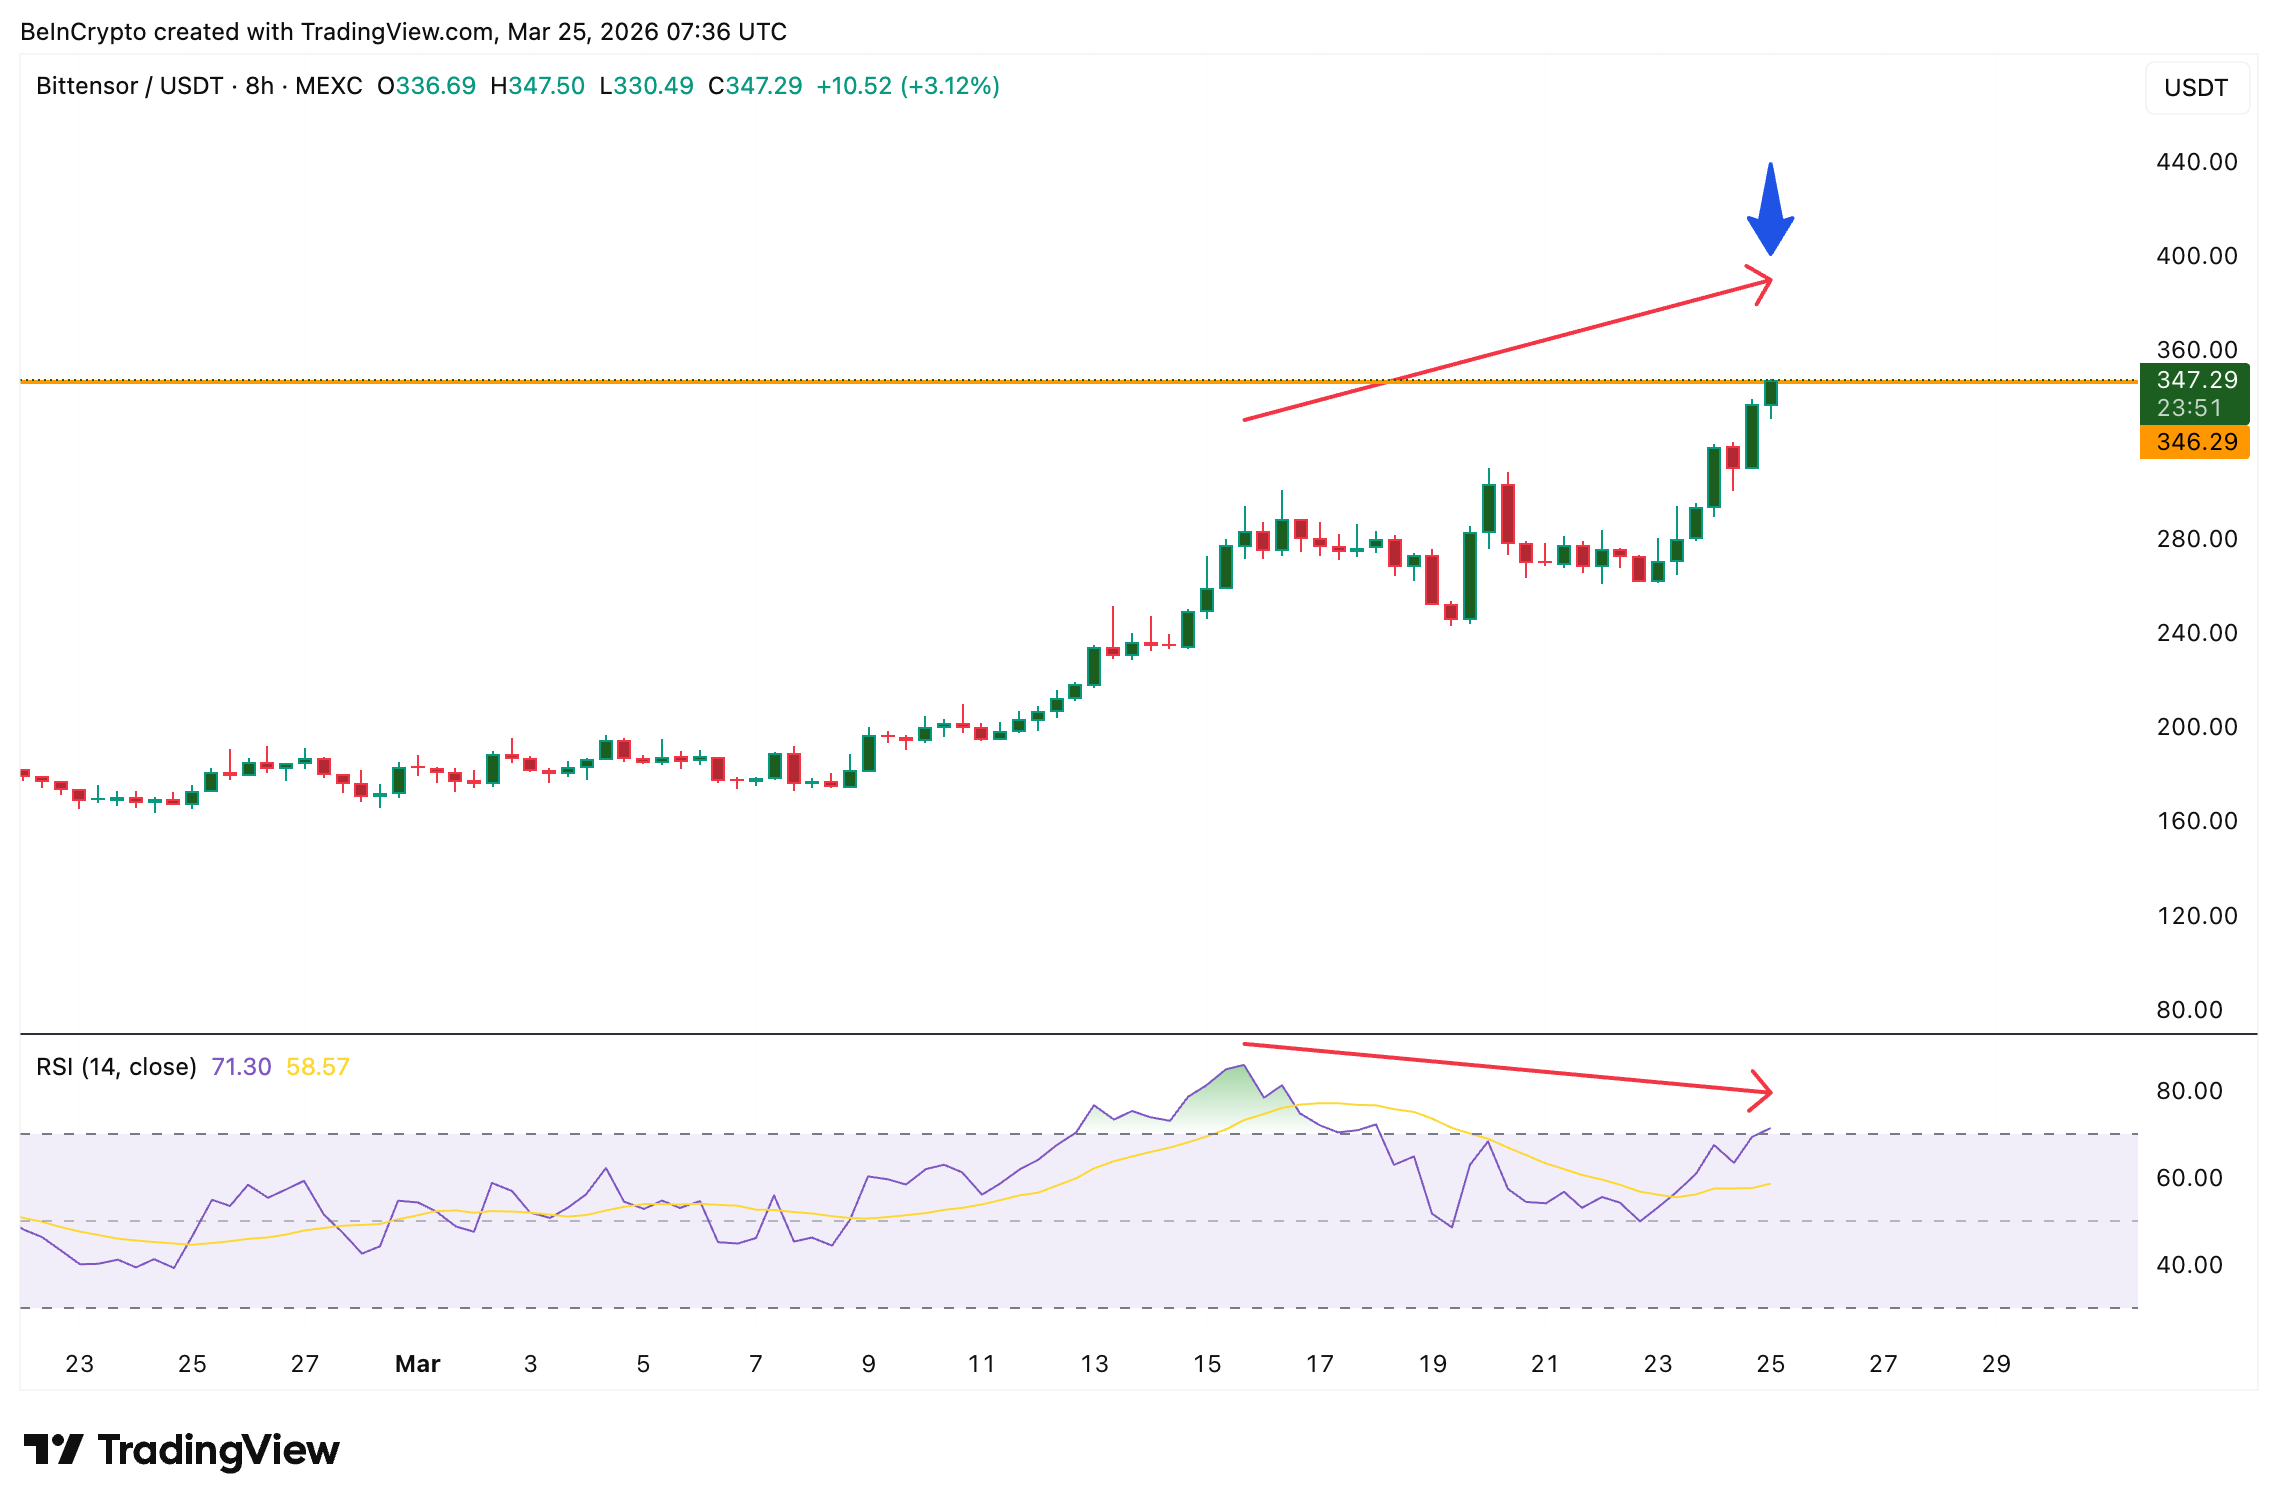
The divergence confirmation remains pending. If the current or next 8-hour candle closes above $346, the higher high structure would remain intact, and the divergence would be temporarily nullified. However, if the candle fails to clear that level and the following candle closes lower, the divergence confirms. Then a correction becomes likely, potentially triggering that 80% long-heavy leverage.
On the daily chart, the structure remains bullish. A clean daily close above the $344 to $346 zone keeps the breakout trajectory intact. Above that, $364 aligns with the 0.618 Fibonacci extension and acts as the next meaningful resistance. Clearing that level opens the path toward $428, then $532, and ultimately the recalibrated cup-and-handle measured move target near $600.
If sellers regain control and the divergence plays out, the $310 breakout zone becomes the first support to watch. A failure there would put the broader bullish structure in question.
For now, $346 separates a continuation toward $600 from a divergence-driven pullback to $310.
The post Bittensor (TAO) Breaks Out Toward $600, but an 80% Long Bias Stands in the Way appeared first on BeInCrypto.