
Pi Coin delivered the breakout that we discussed earlier when it moved above the $0.204 neckline of the cup-and-handle pattern. However, the rally quickly ran into heavy resistance near $0.239, where sellers stepped in aggressively.
The rejection pushed Pi Coin sharply lower, briefly dragging the price toward the $0.204 region again before buyers attempted to stabilize the structure. At press time, Pi Coin trades near $0.209 as traders watch whether the broader bullish structure can still survive the latest pullback.
Bearish Divergence Triggered the PI Pullback
The Relative Strength Index (RSI) helps measure the strength and speed of price movements. Traders use it to determine whether buyers or sellers are gaining control of the market. Between February 15 and March 7, Pi Coin’s price formed a higher high as the predicted PI rally progressed.
However, during the same period, the RSI formed a lower high while still moving in the overbought zone.
This configuration is known as a standard bearish divergence.
It typically appears when prices continue moving higher, but the underlying buying momentum weakens. In simple terms, the market keeps climbing, but the strength behind the move is fading. That is exactly what happened here.
Want more token insights like this? Sign up for Editor Harsh Notariya’s Daily Crypto Newsletter here.
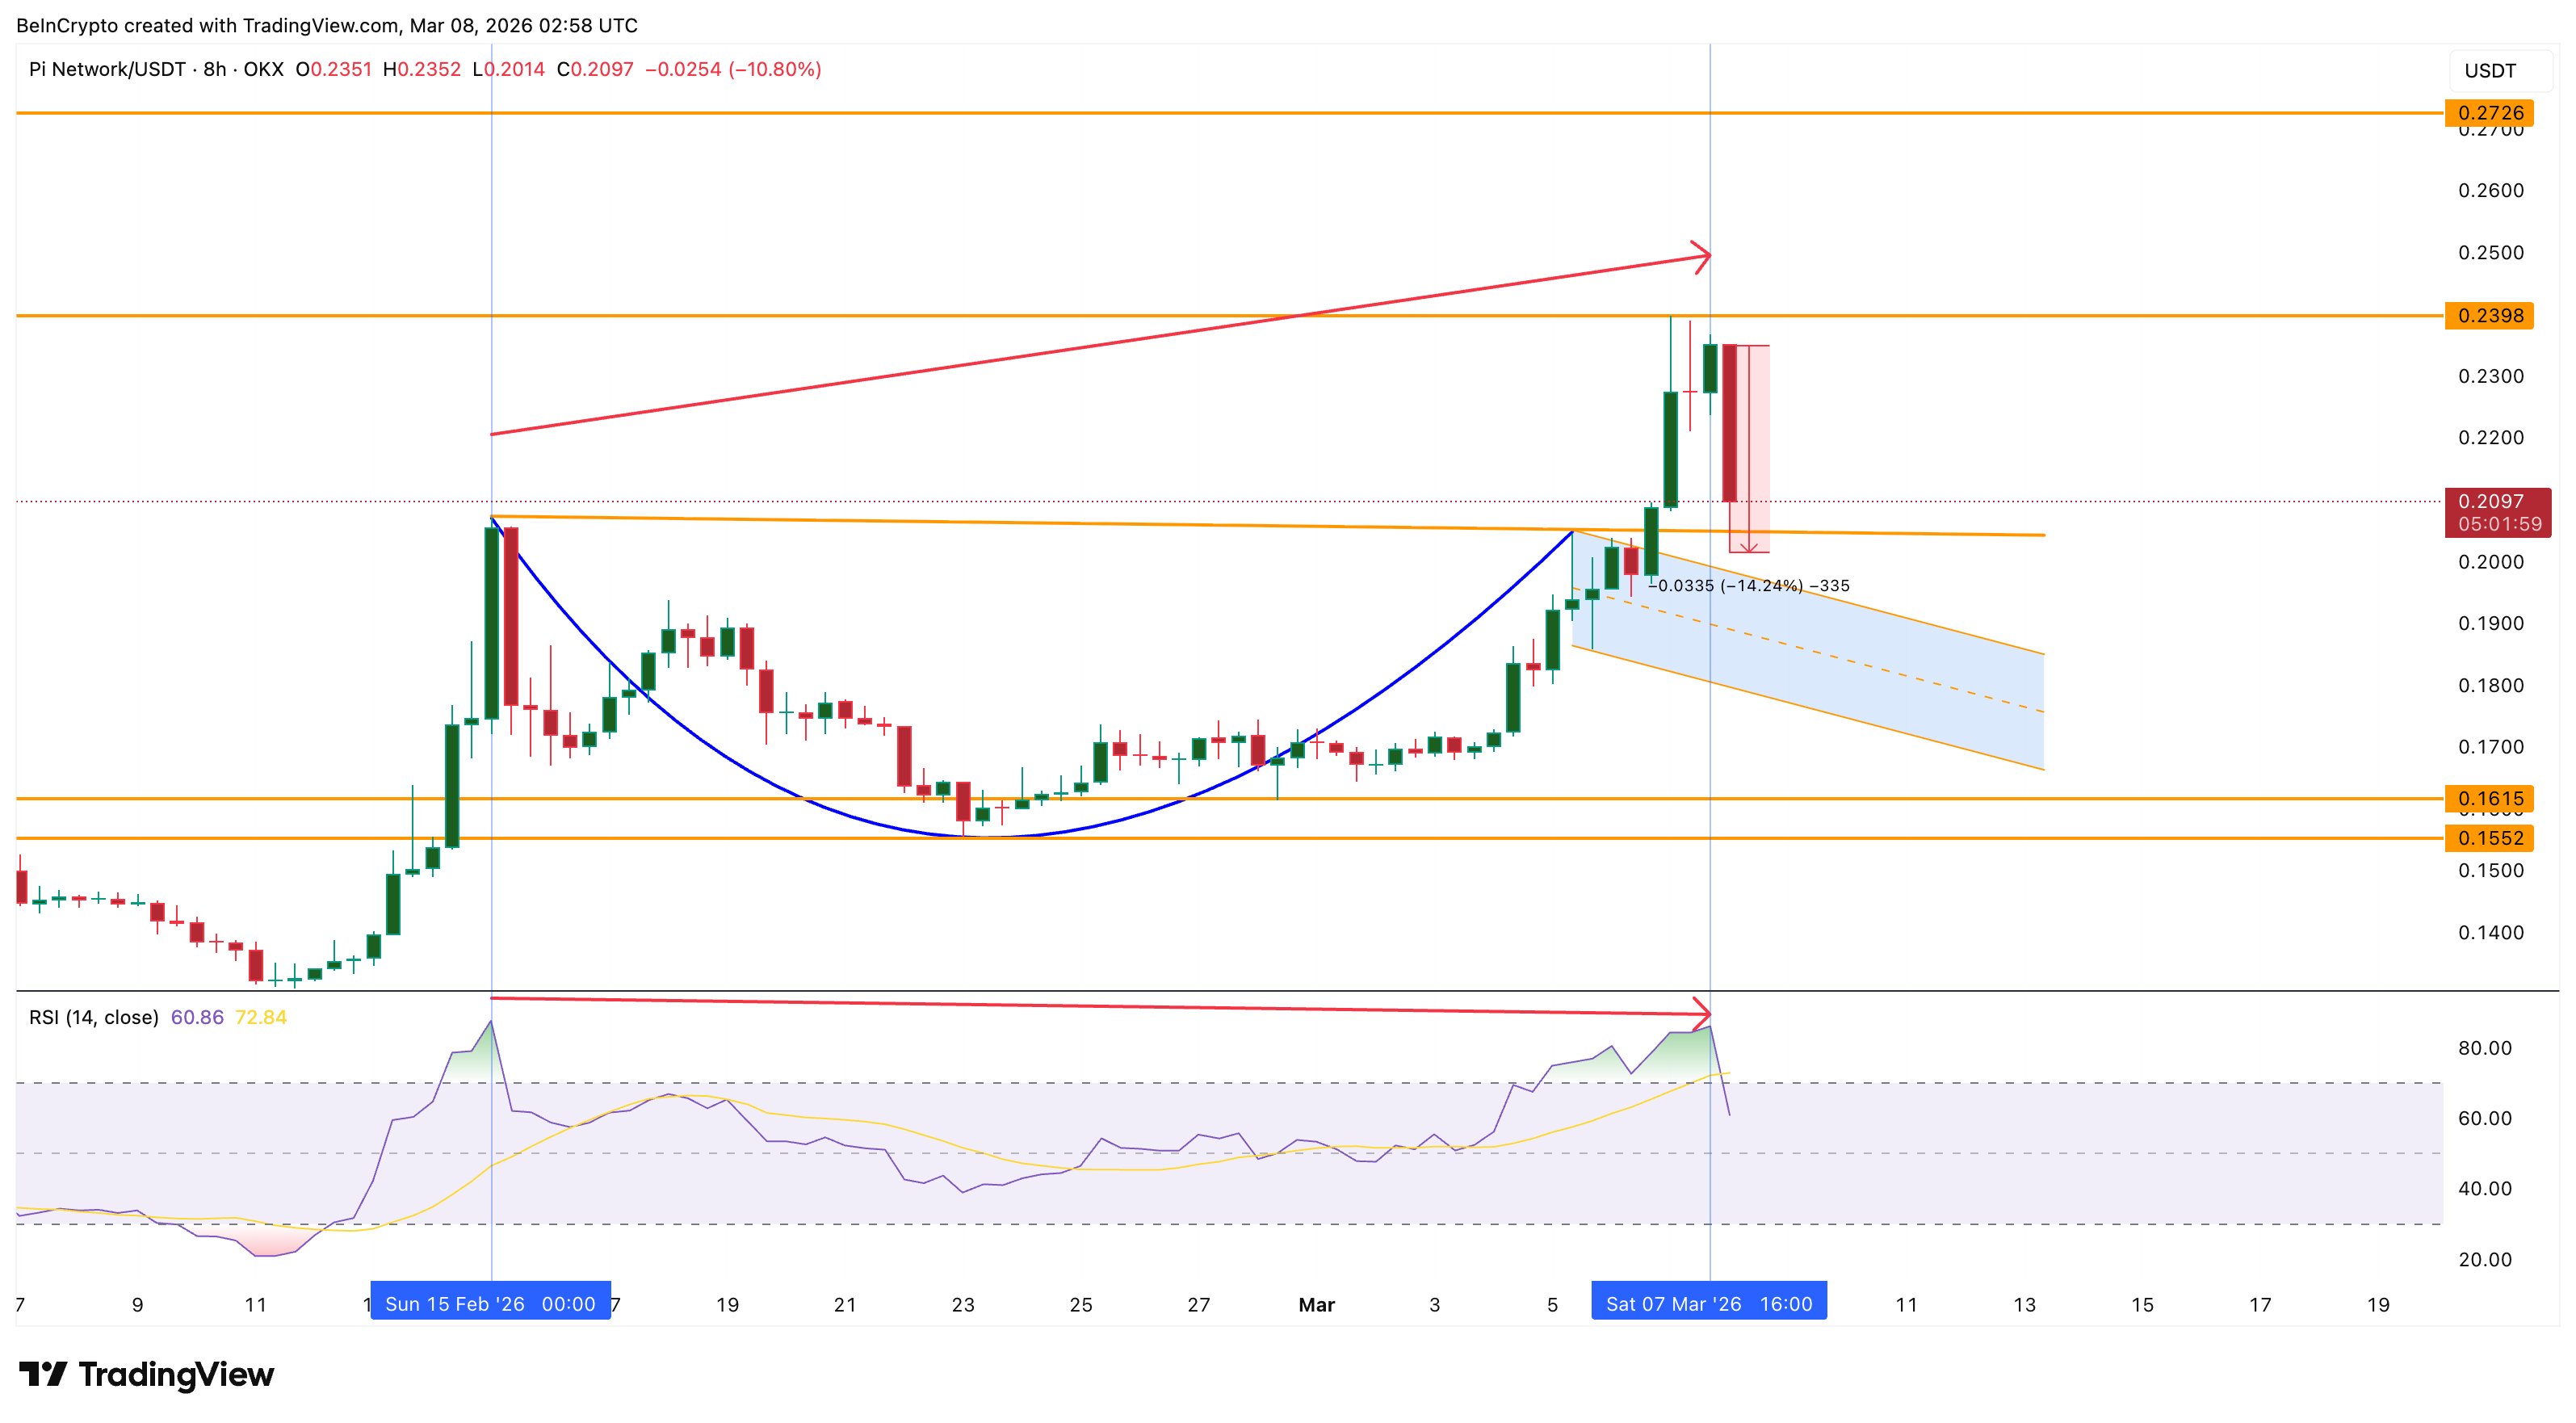
Although Pi Coin pushed higher toward $0.239, the weakening RSI suggested that buyers were gradually losing strength. The signal was validated when the next 8-hour candle on March 8 triggered a sharp 14% correction, pushing the price down toward the breakout region.
Unlike hidden divergences, which usually support trend continuation, standard bearish divergence often leads to wider pullbacks or trend slowdowns. In Pi Coin’s case, the uptrend that developed between mid-February and early March nearly reversed before buyers stepped in near the neckline area.
Money Flow Indicators Confirmed Weak Buying Pressure
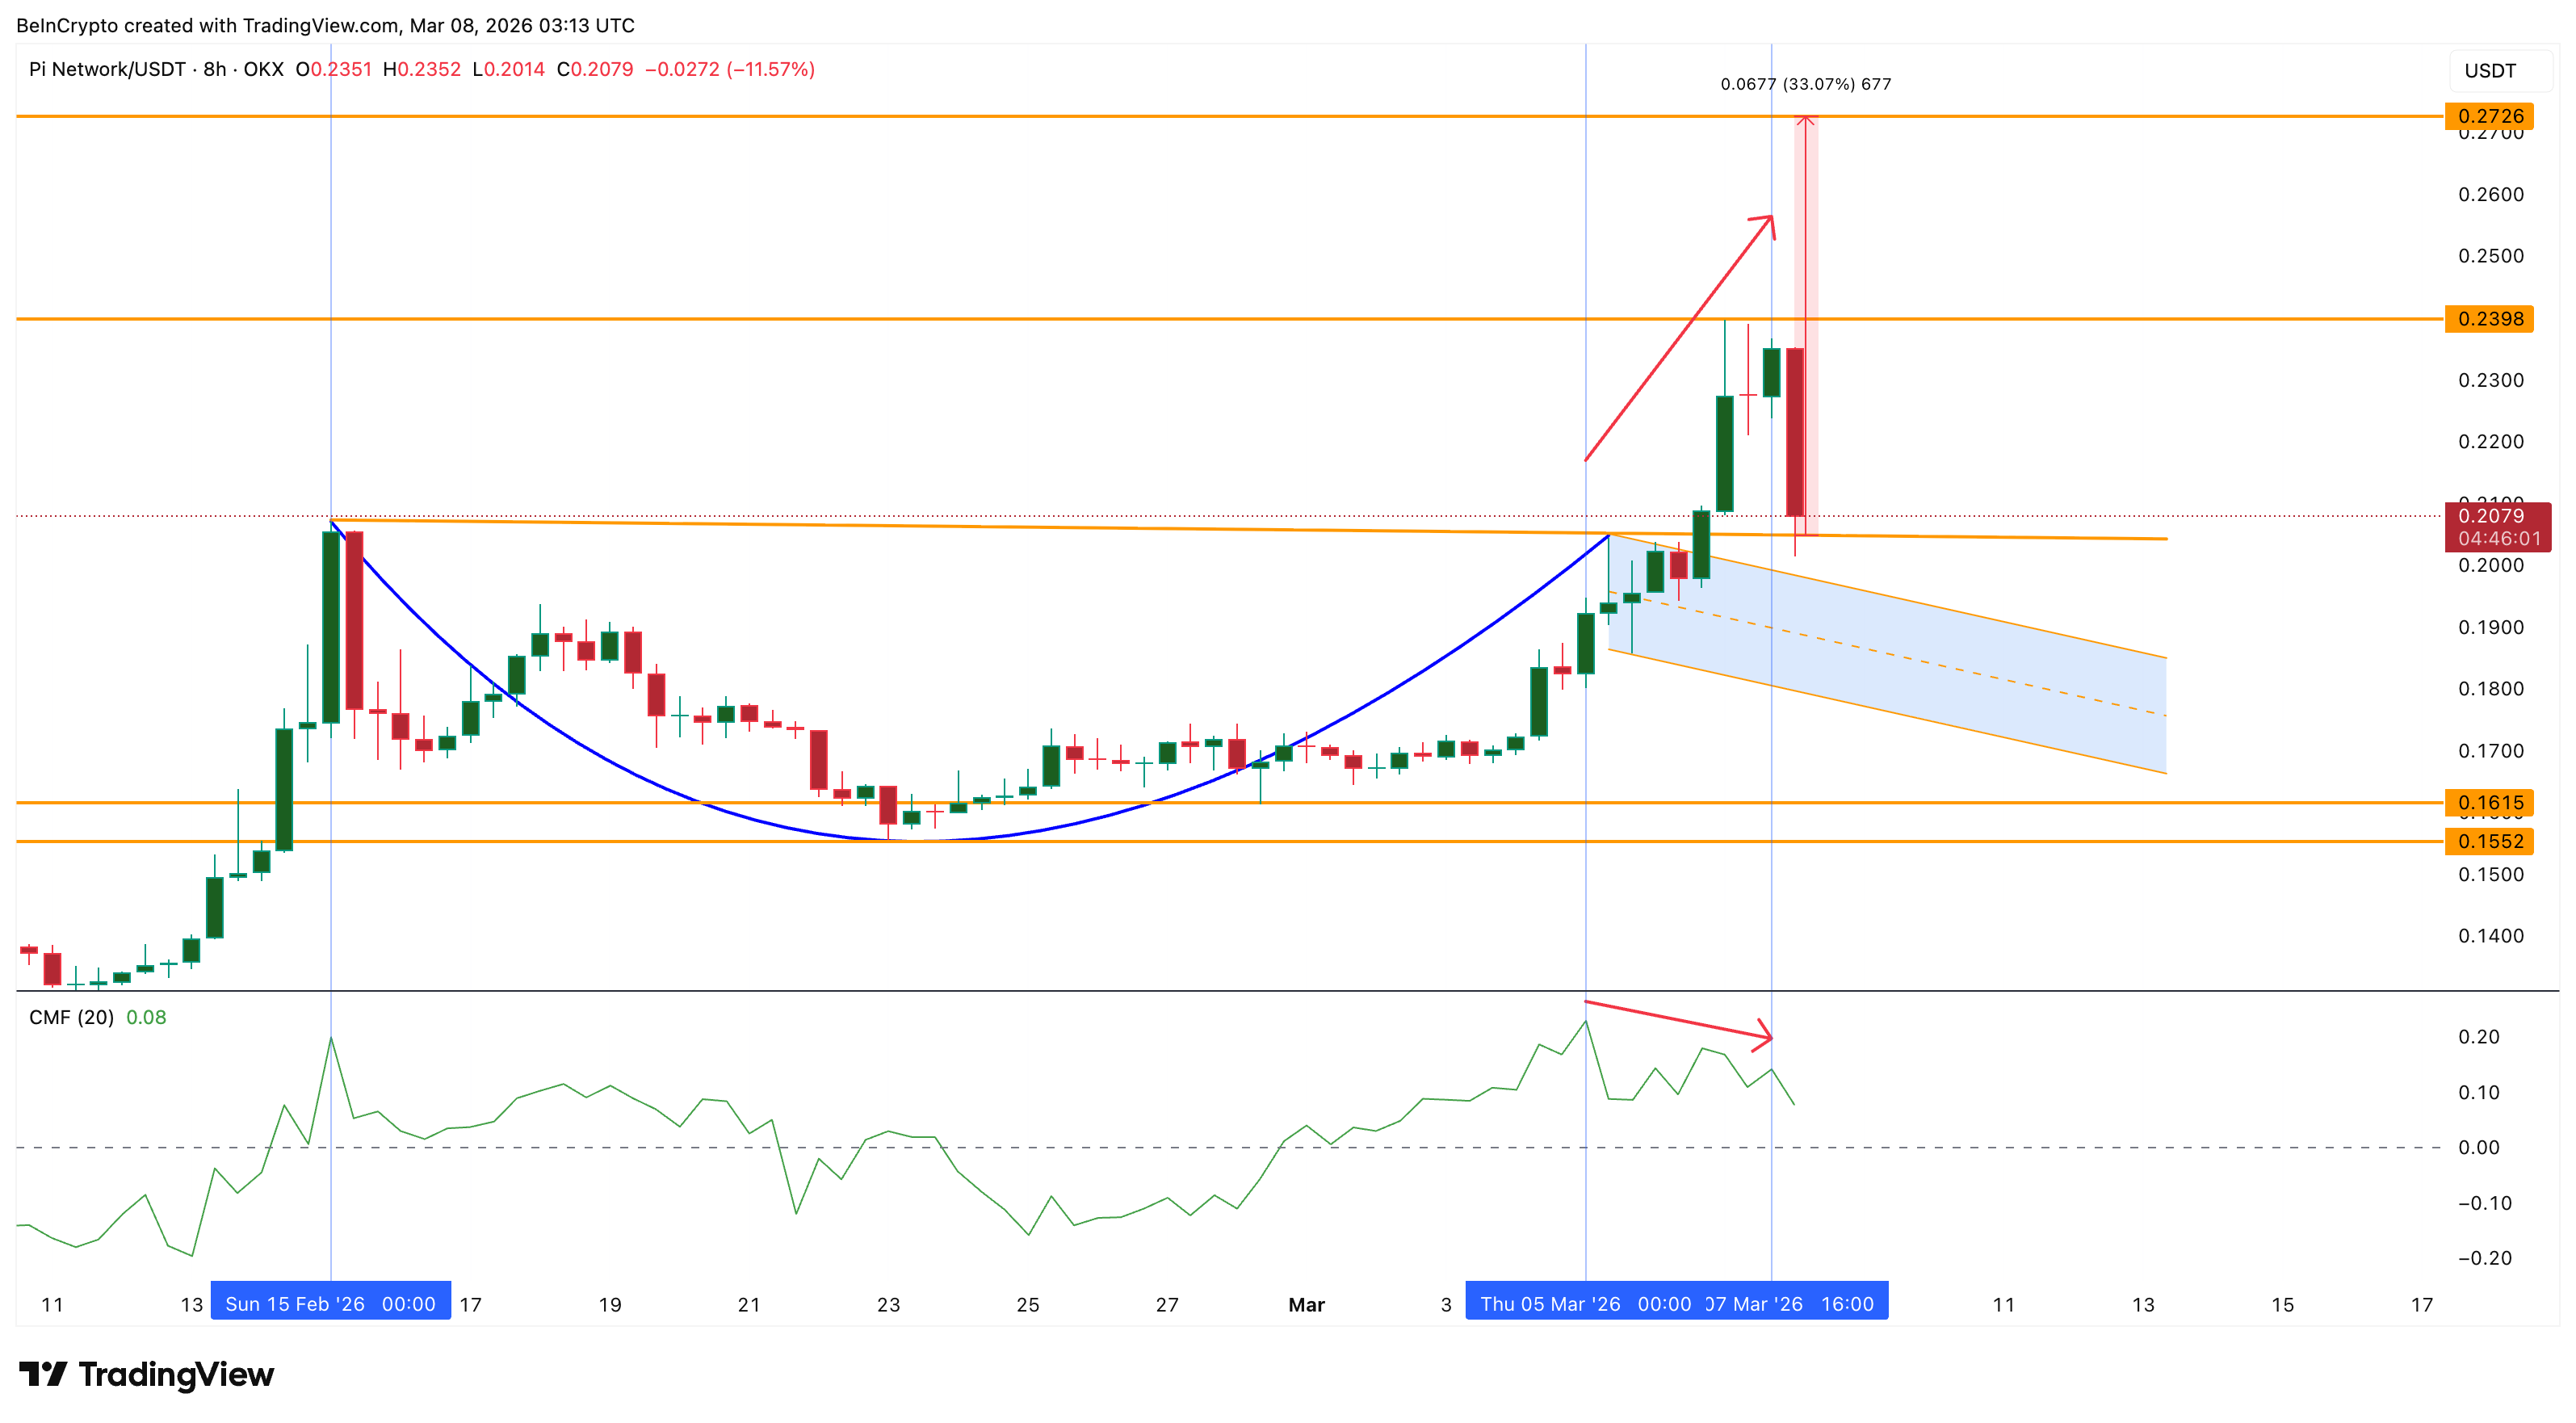
Capital flow indicators were already hinting that the PI rally was losing internal strength before the drop occurred. The Chaikin Money Flow (CMF) indicator tracks whether capital is entering or leaving an asset by combining price movement with trading volume. It is commonly used as a proxy for large capital inflows.
Between March 5 and March 7, Pi Coin’s price continued rising. However, during the same period, the CMF indicator formed a lower high.
Although CMF remained above the zero line, meaning capital inflows were still present, the weakening trend suggested that the inflows were not strong enough to support the rising price. In other words, large capital flows were slowing down even as the rally continued.
The Money Flow Index (MFI) tells a similar story.
MFI measures buying pressure using both price and trading volume and is often interpreted as a proxy for dip-buying activity. When MFI rises, it usually indicates that traders are aggressively buying pullbacks. But between March 5 and March 7 (the same period as CMF tracking), the MFI also formed a lower high while the Pi Coin price moved higher.
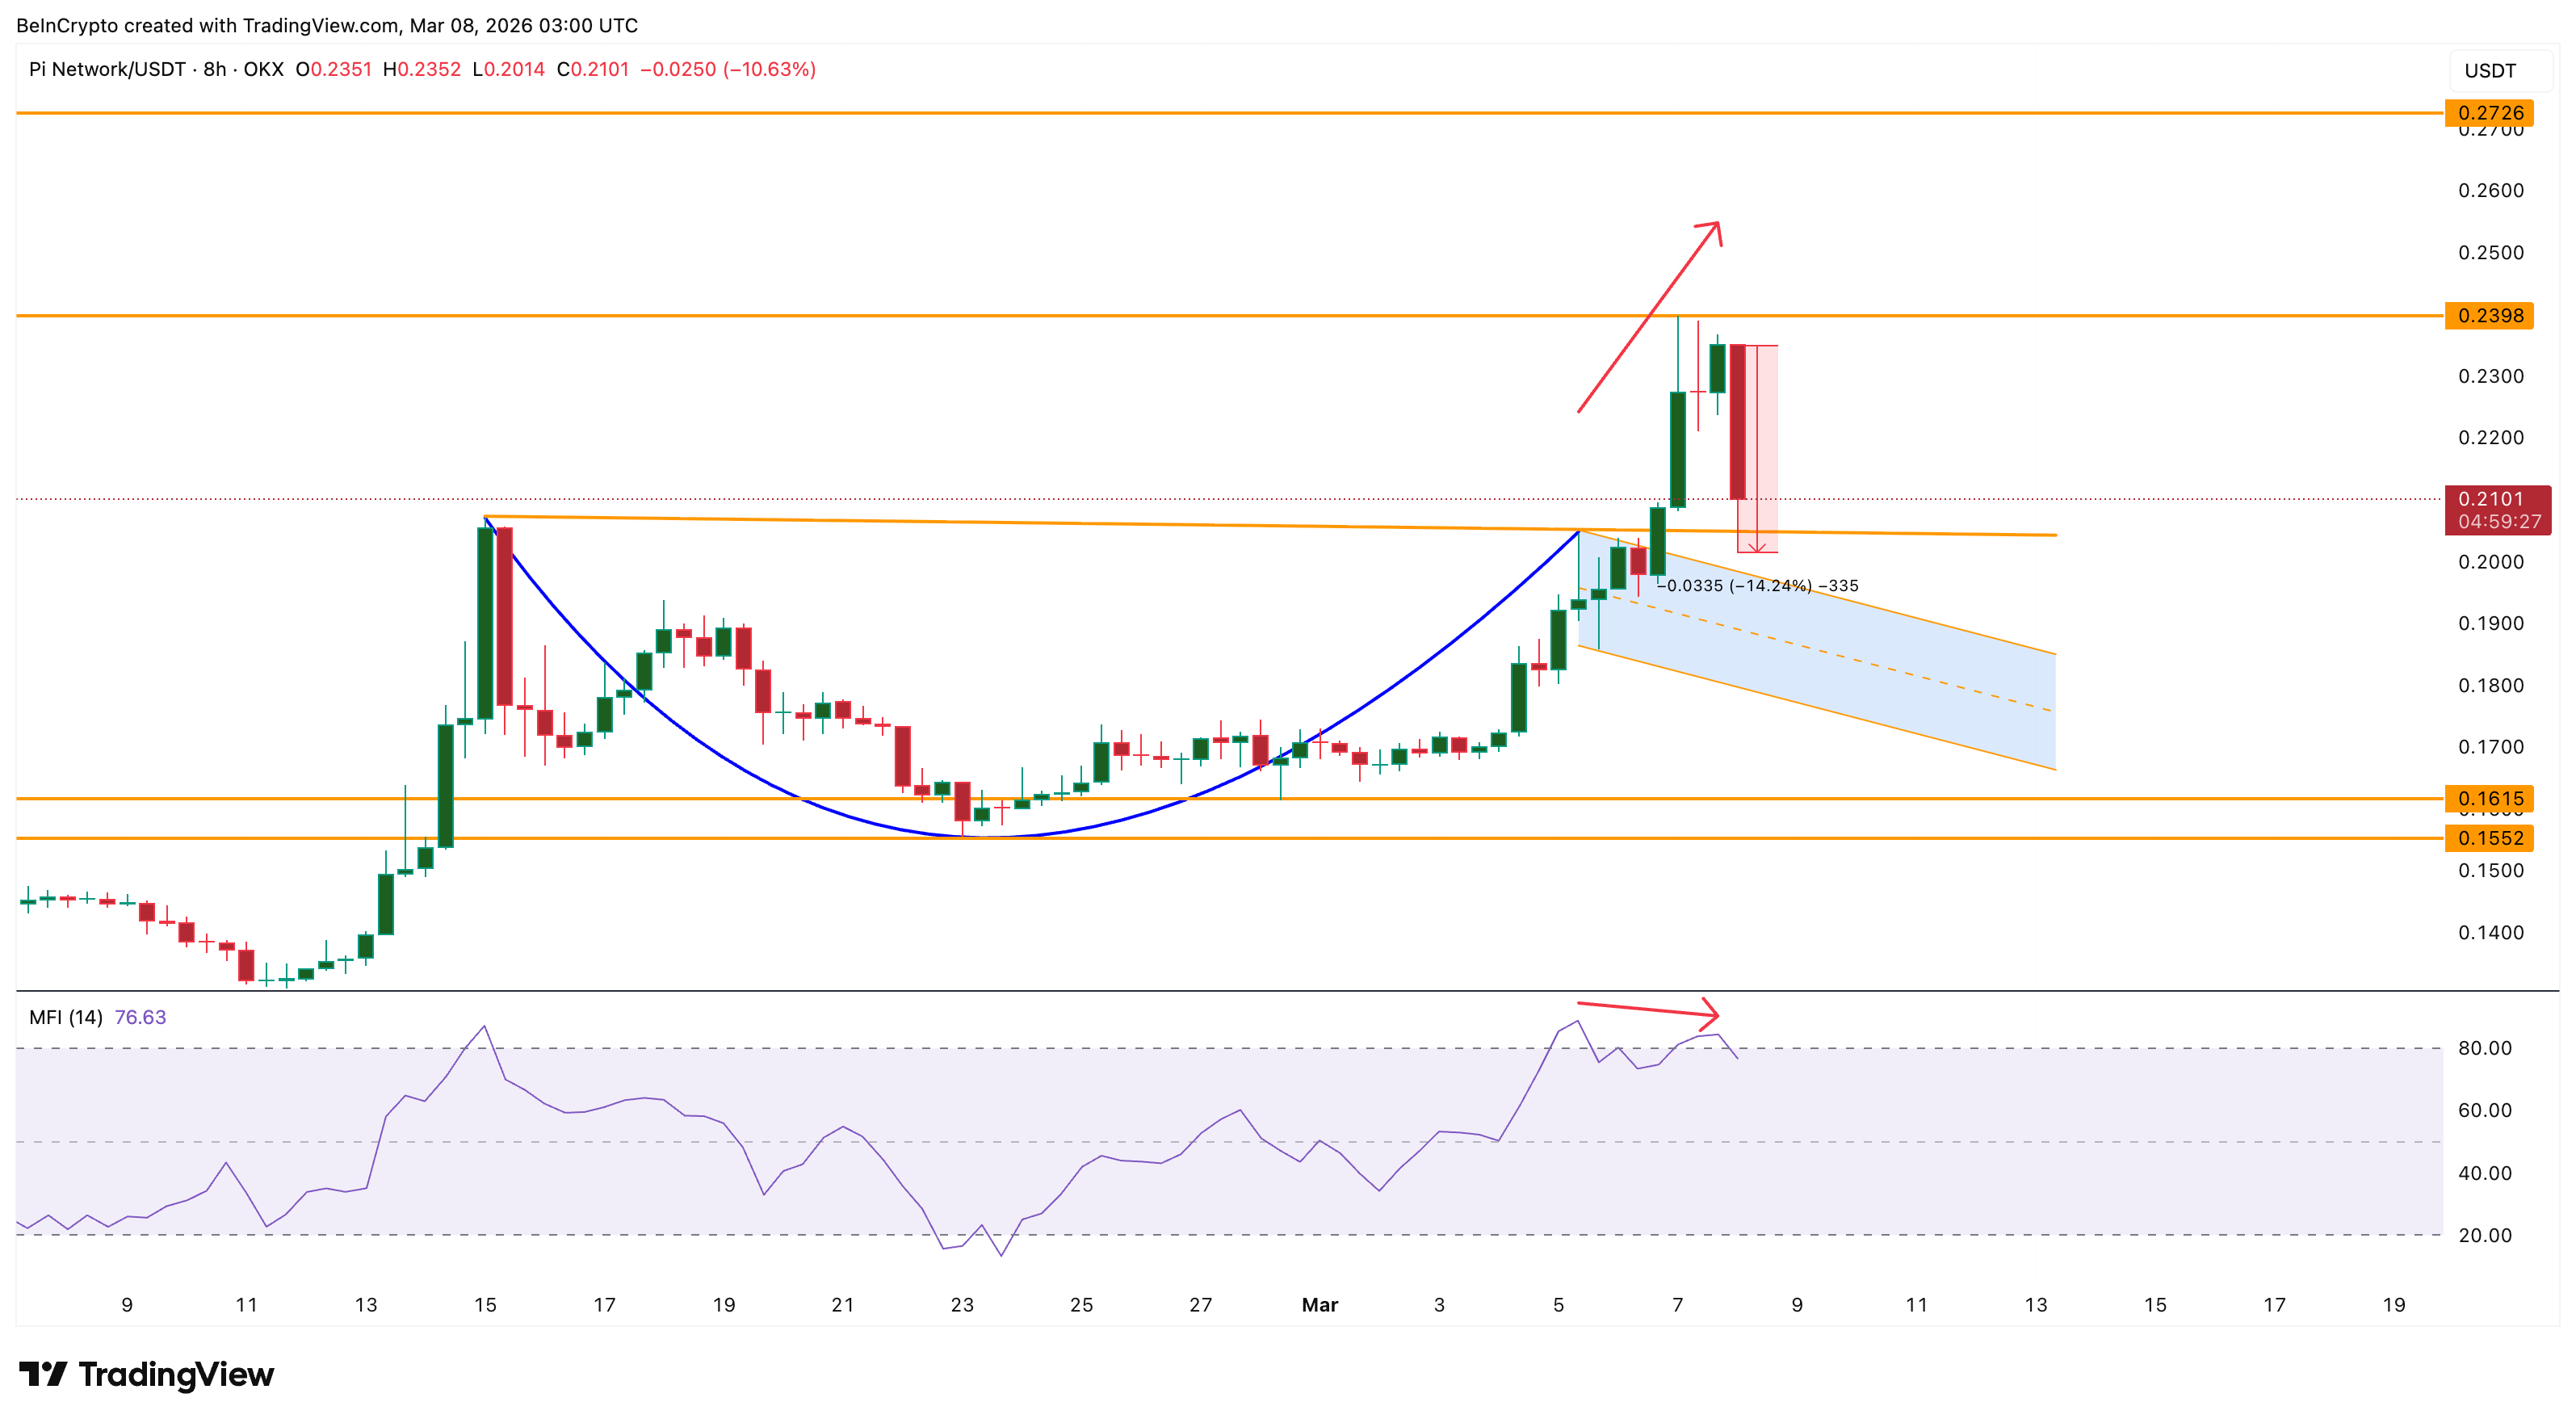
This combination signals that dip buyers were not stepping in strongly enough during the Pi Coin rally.
Taken together, the signals formed a clear chain reaction:
- RSI showed buyers losing momentum
- CMF showed weakening capital inflows
- MFI showed fading dip-buying demand
With all three indicators pointing in the same direction, the market became vulnerable to selling pressure. When sellers finally stepped in near $0.239, the drop followed quickly as there was hardly any substantial buying pressure.
A Potential EMA Crossover Could Still Revive the Rally
Despite the bearish signals, Pi Coin (PI) still has one technical factor that could support a recovery. On the 8-hour chart, the 50-period Exponential Moving Average (EMA) has closed in on the 200-period EMA, almost triggering a bullish crossover. EMAs are trend indicators that give greater weight to recent prices, allowing traders to identify shifts in market direction.
If the 50-period EMA crosses above the 200-period EMA, it would form a golden crossover. This pattern often signals strengthening bullish momentum and can attract new buyers into the market.
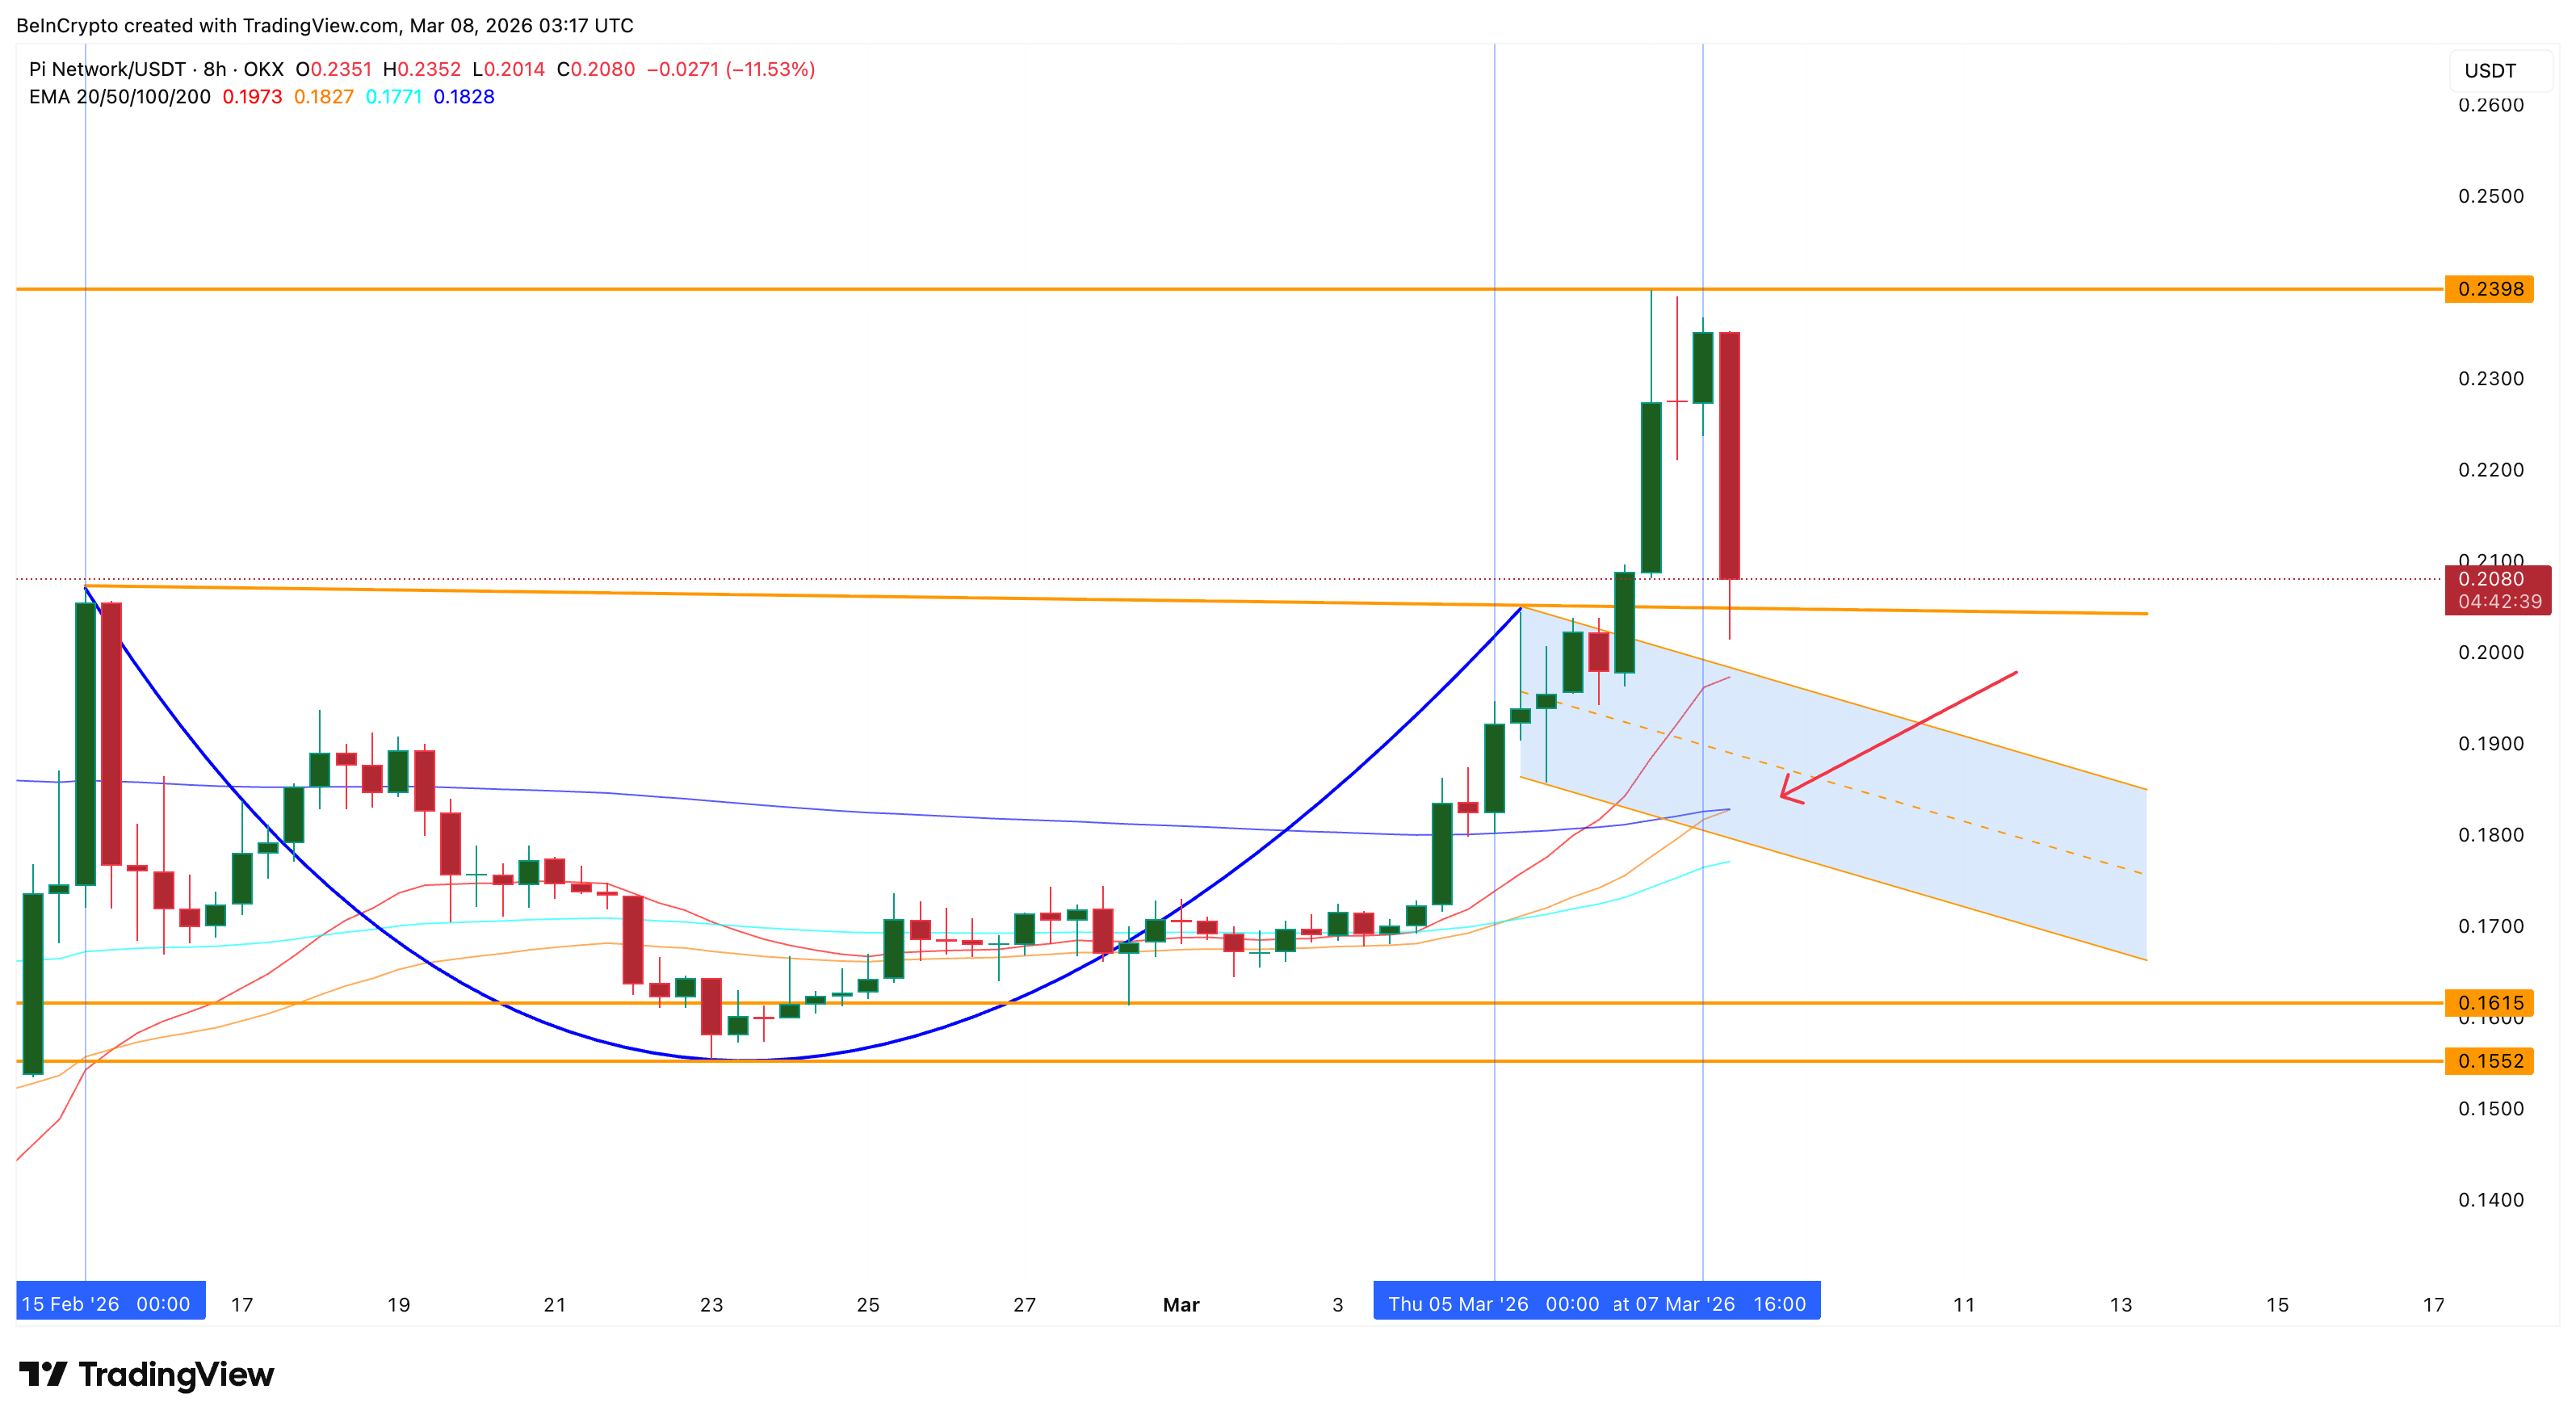
If the crossover completes, it could improve the broader market structure in several ways.
Stronger buying pressure could push CMF higher again, signaling renewed capital inflows. Dip buyers could return, allowing the MFI indicator to recover. And improving momentum could invalidate the RSI divergence and help align the momentum with price.
However, the golden crossover is not guaranteed to translate into a sustained rally. Even though the moving averages have nearly touched, weakening momentum could still prevent the signal from developing into a strong bullish trend.
Pi Coin Price Levels to Track Now
The recent rejection near $0.239 has now become the key resistance level for Pi Coin. The selling pressure from that zone pushed the price as low as $0.204, almost retesting the original breakout area before buyers managed to stabilize the market near $0.210.
For bullish momentum to return, Pi Coin now needs a clear 8-hour close above $0.224. That level would signal that buyers are regaining control after the recent correction.
If the price manages to push above $0.224, the next major hurdle remains $0.239, the level where the latest rally was rejected.
A successful break above that resistance could allow Pi Coin to resume the projected move from the cup-and-handle structure. The full measured move of the pattern still points toward $0.272, representing the remaining portion of the roughly 33% breakout rally. However, downside risks remain.
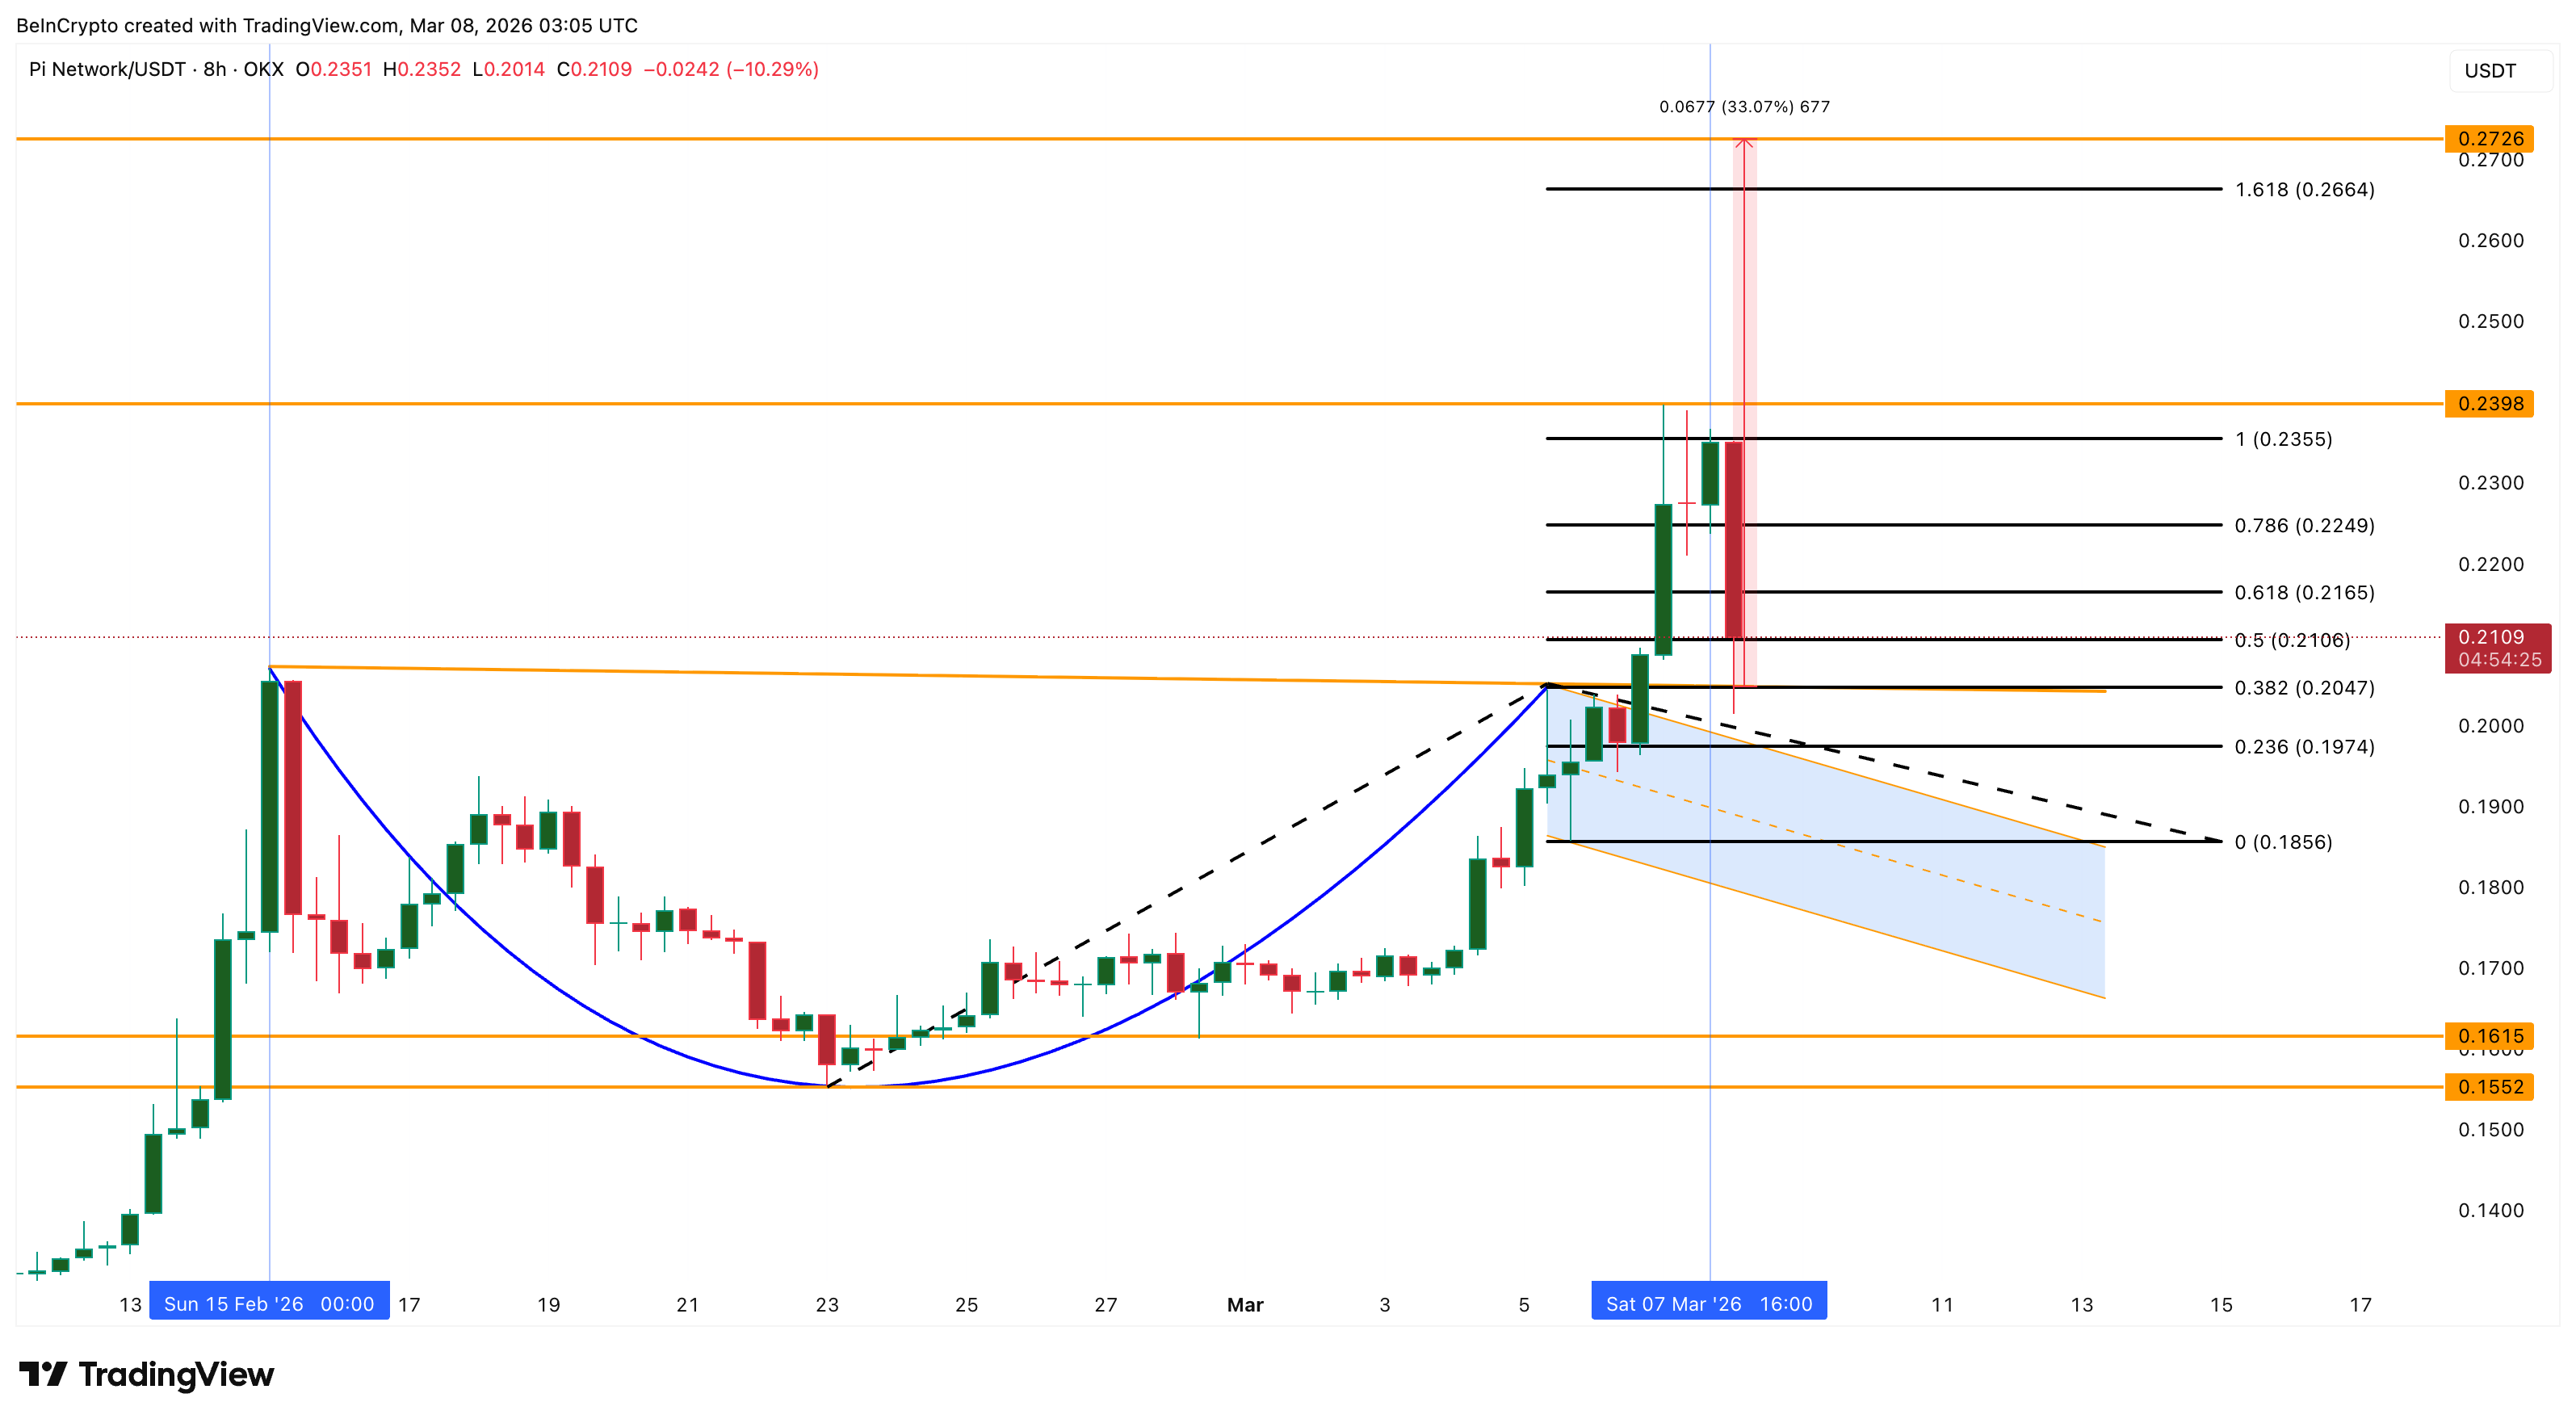
If Pi Coin falls back below $0.204, the breakout structure would begin to weaken. A deeper drop below $0.185 would likely signal that the bullish breakout has lost momentum and that the market could return to its previous downtrend.
For now, Pi Coin’s breakout technically remains valid. But after the sharp rejection and momentum divergence signals, the path toward the $0.272 target may depend on whether buyers can regain control above the newly established resistance levels.
The post Pi Coin Breakout Confirmed — Has the Rally to $0.27 Now Run Out of Steam? appeared first on BeInCrypto.