
Solana price is up about 4.2% today, but the bigger picture still leans weak. The token has dropped almost 22% over the past month, and the latest on-chain data shows that long-term holders are not supporting the rebound.
This lack of support raises doubts about the Solana price reversal theory that some might have expected after today’s greenish speck.
Long-Term Holders Reducing Exposure
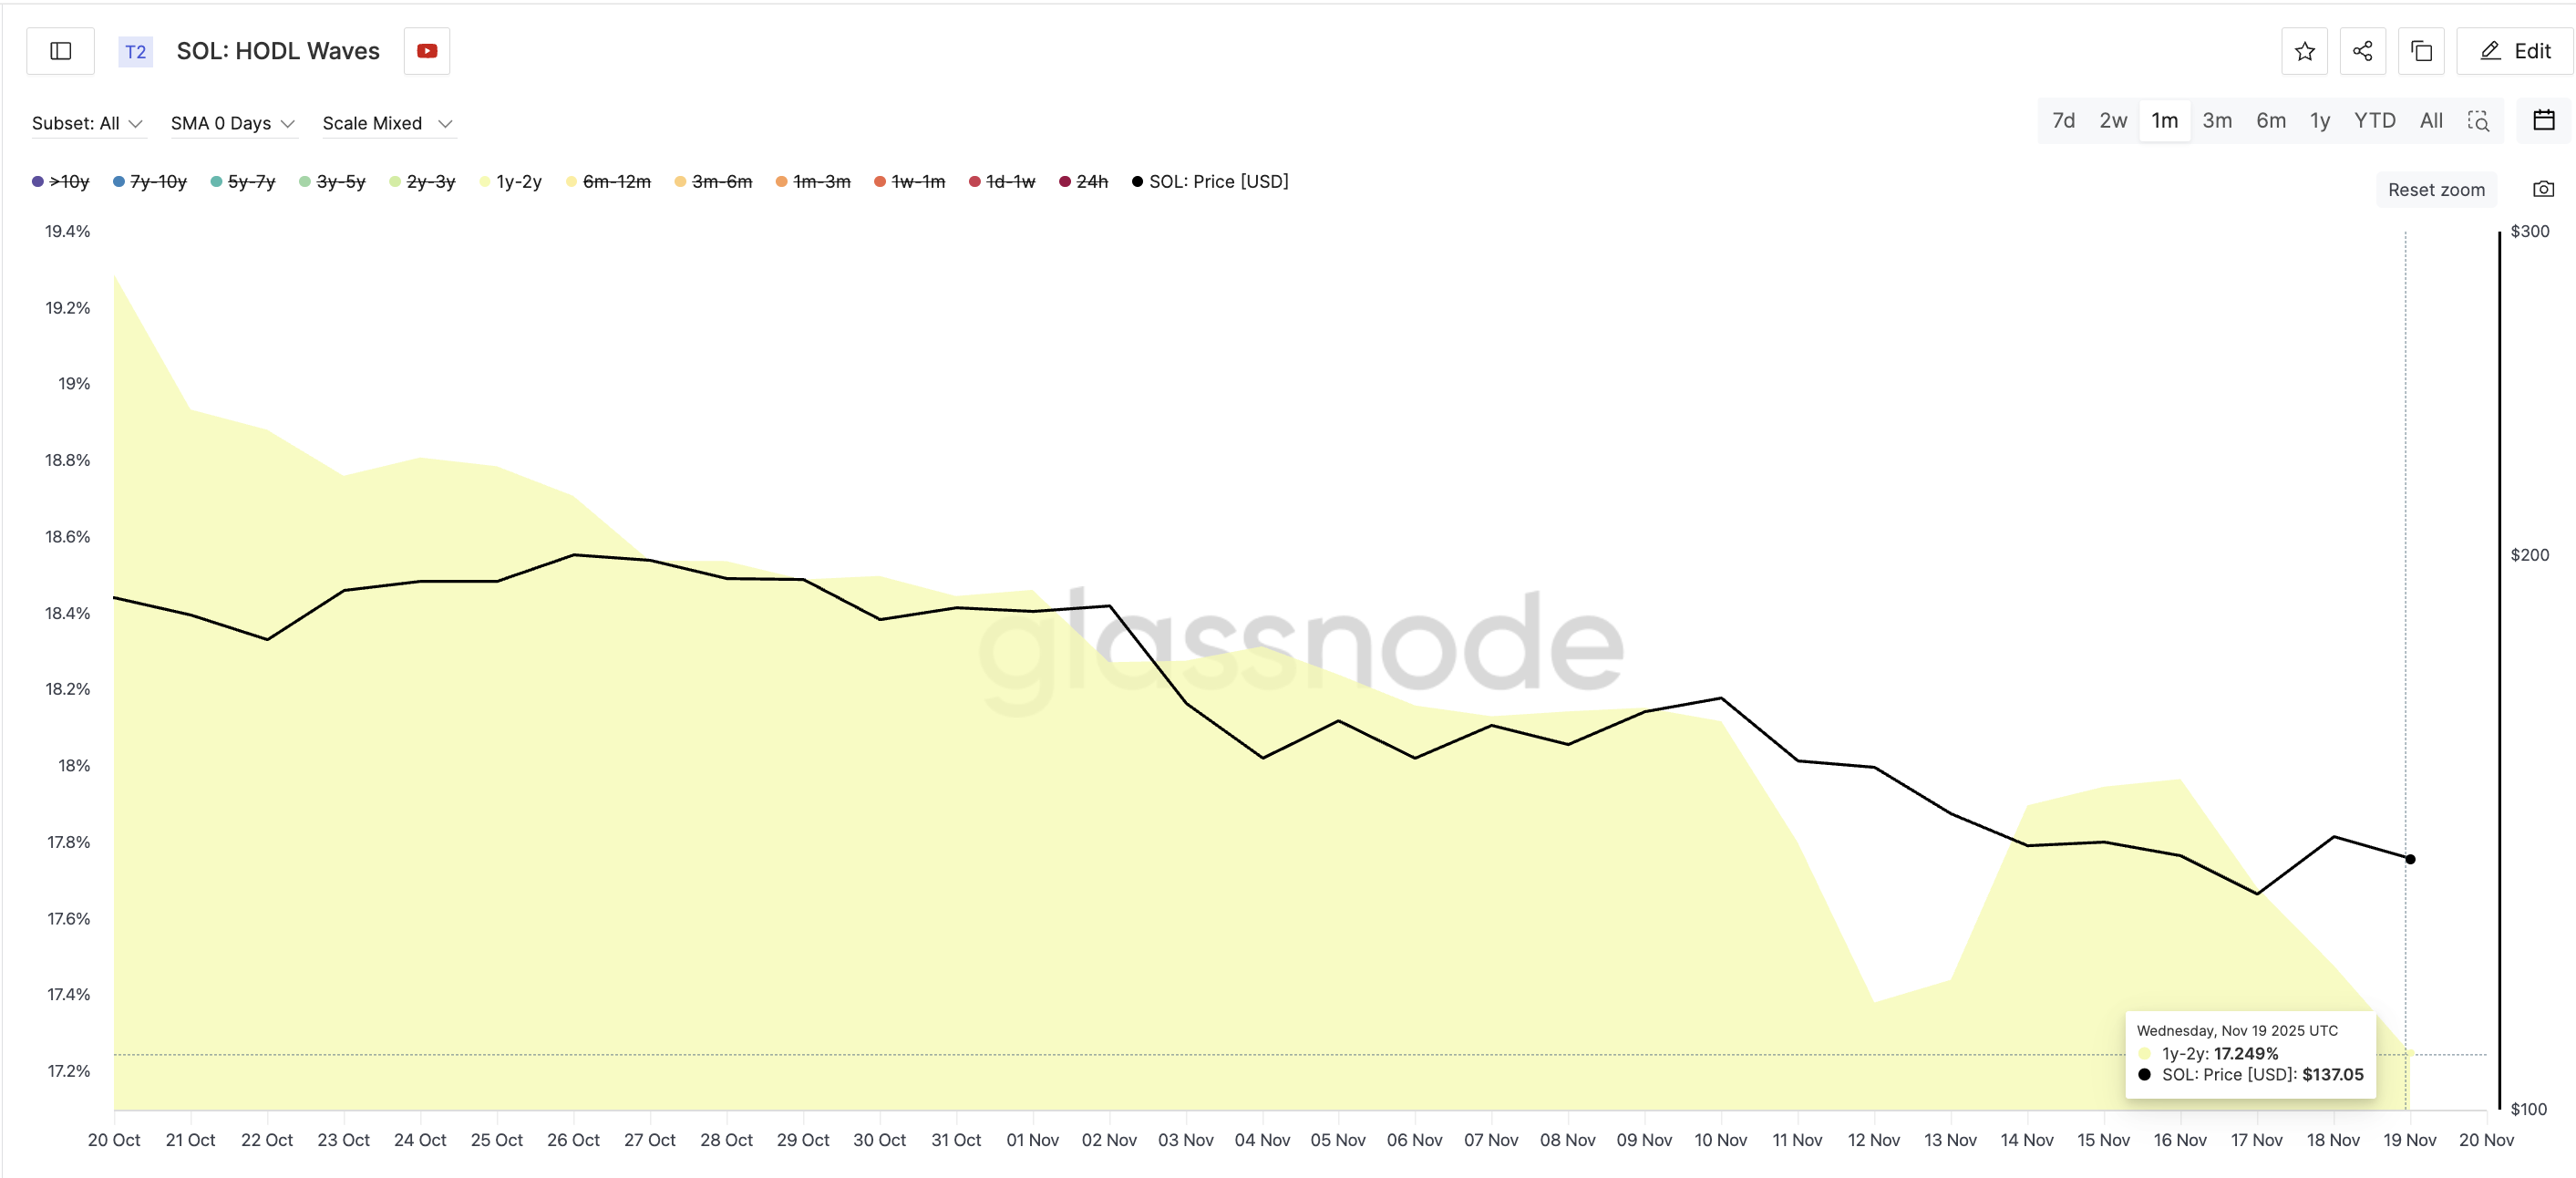
Solana’s 1–2 year holder group has been trimming their supply all month. HODL Waves track how much supply is held by different age groups, helping identify which holders are adding or reducing their coins. Solana’s 1–2 year cohort held 19.28% of the supply on October 20. By November 19, that number fell to 17.24%.
Want more token insights like this? Sign up for Editor Harsh Notariya’s Daily Crypto Newsletter here.
This is a meaningful drop for a group that normally stays stable during corrections. It shows long-term holders do not view the recent 4.2% rebound as a true trend shift. Their reduction also follows a month where the Solana price was consistently weak, which helps explain why they have not started accumulating again.
This behavior directly challenges the Solana price reversal hopes. If long-term holders believed the bounce signaled a real trend shift, their supply share would stabilize or rise, not drop. Their caution connects clearly with the technical pressure Solana now faces.
A Bearish Crossover Looms Near Key Resistance Points
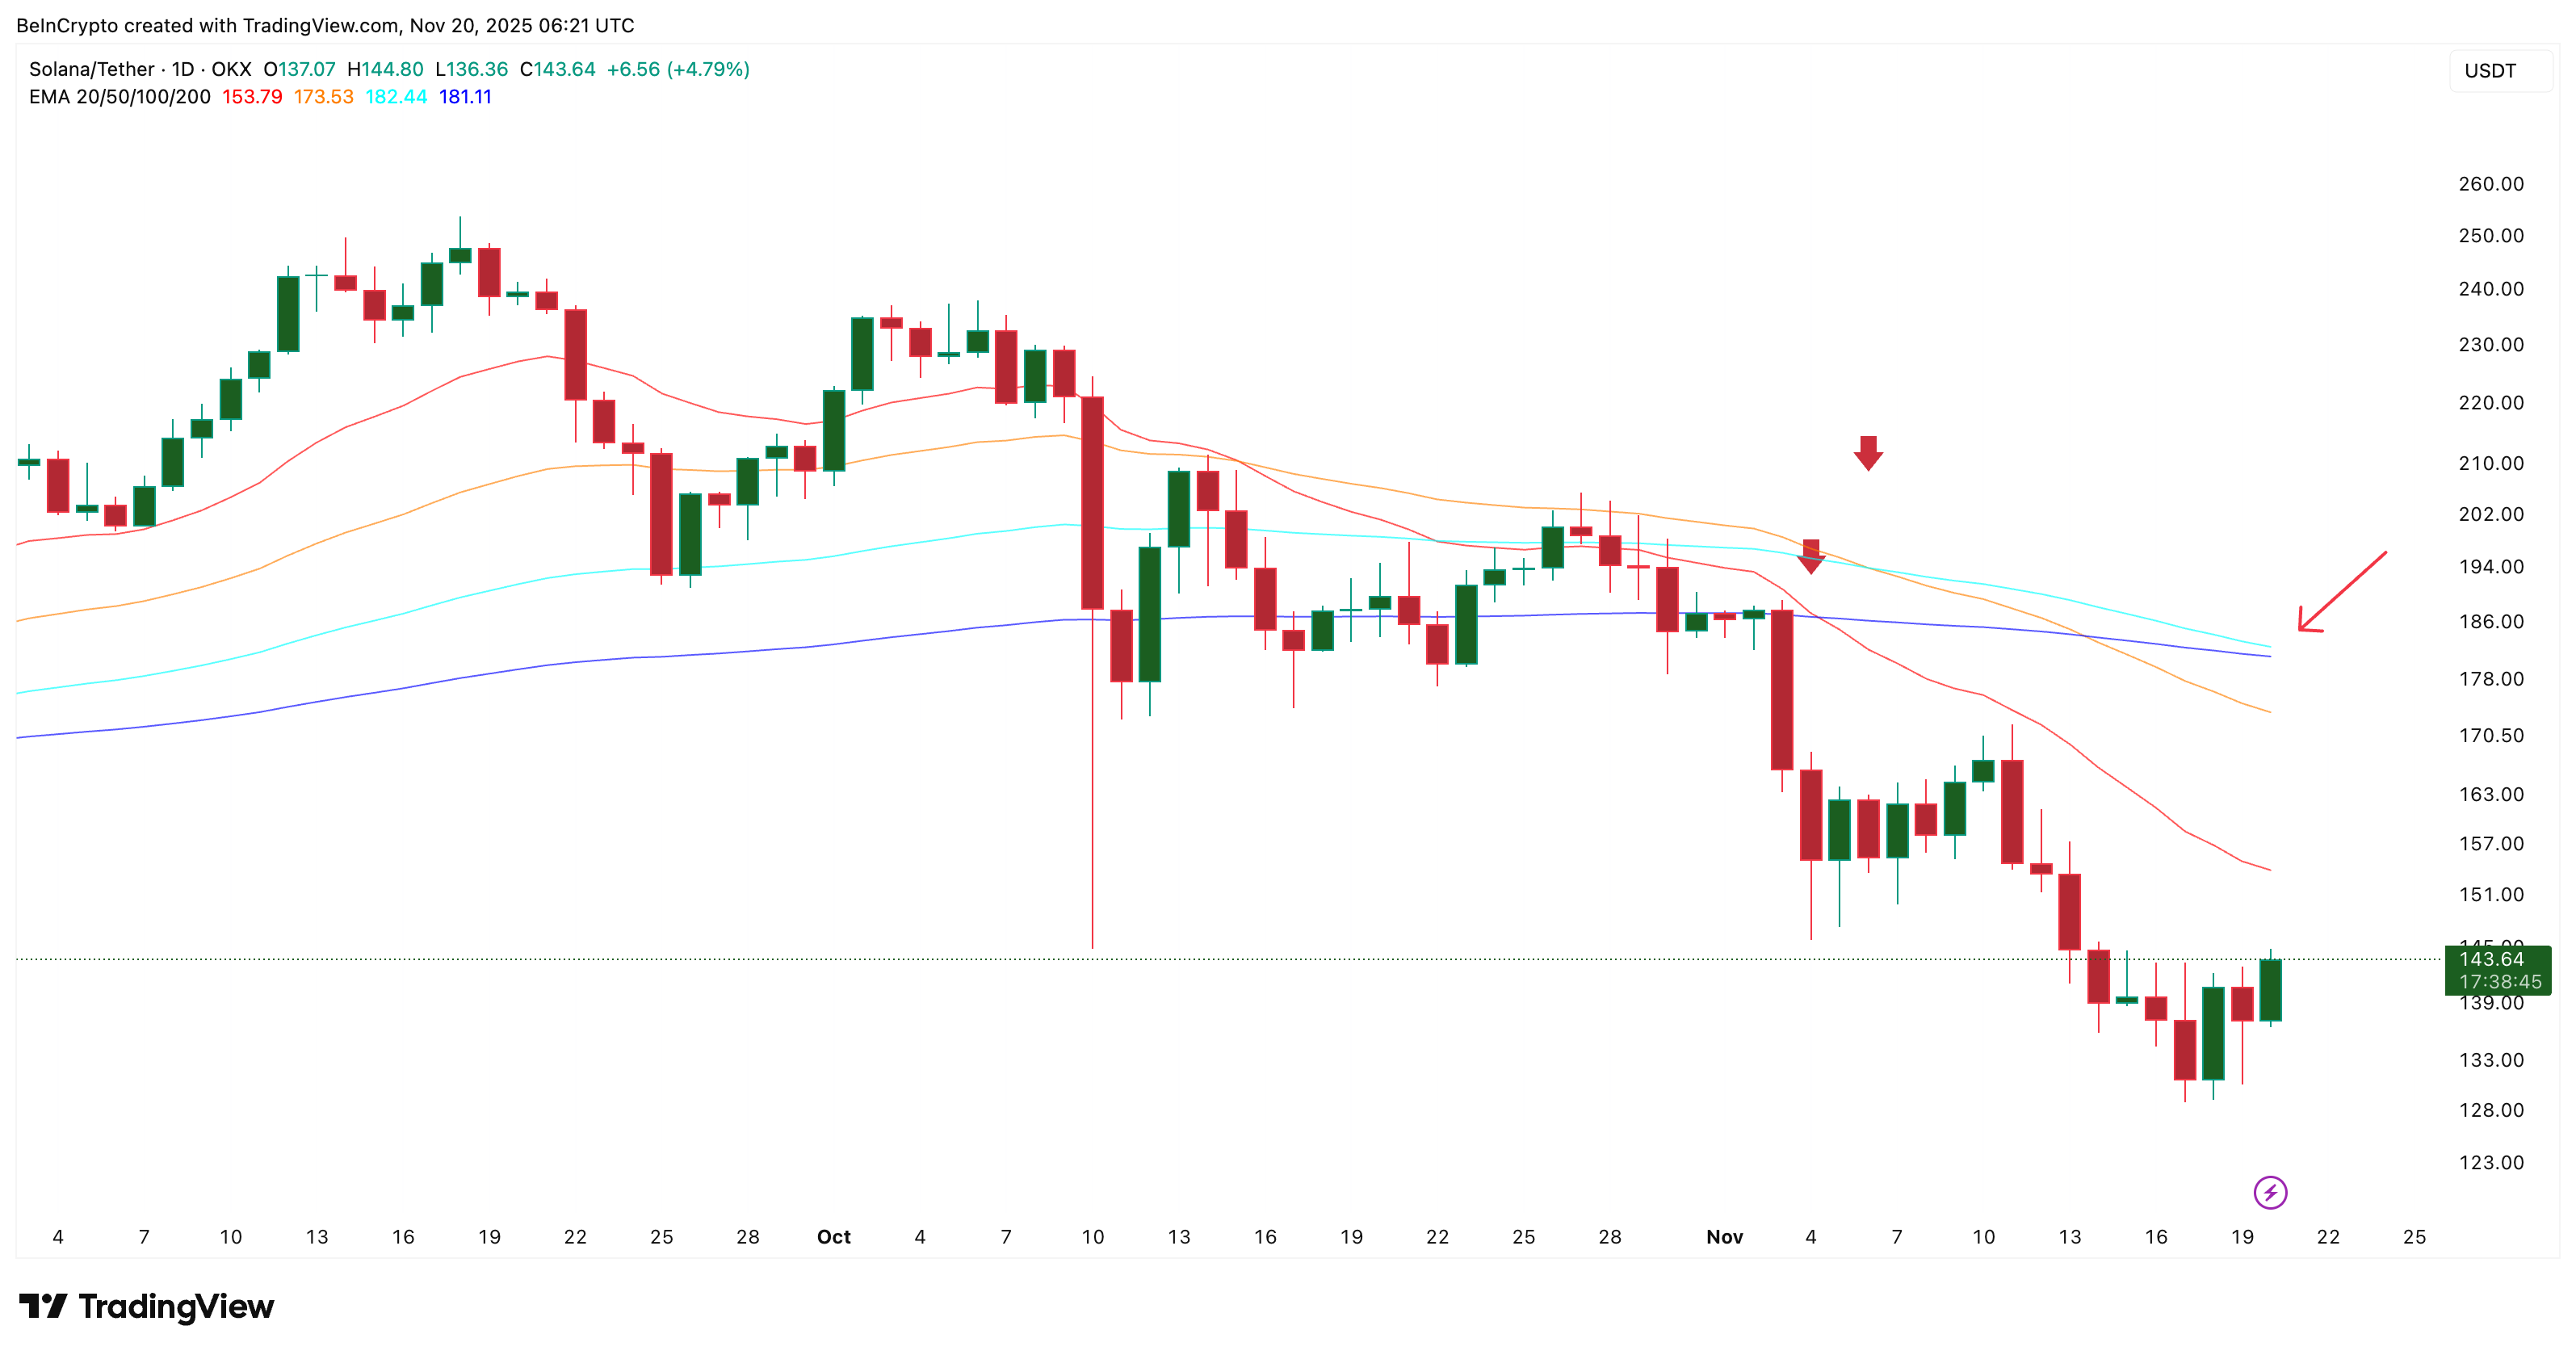
Solana’s short-term bounce is running directly into two key problems. The first comes from the moving averages. The 100-day exponential moving average is now close to crossing below the 200-day EMA, a setup that usually reflects a tired trend. Earlier bearish EMA crosses like these — the 50-day crossing below the 100-day — came right before fresh drops in the SOL price.
The second issue is the supply directly above the current price. The Cost-Basis Heatmap shows where wallets last bought their tokens. These clusters often behave like resistance because holders who bought at those levels tend to sell when the price returns there, mainly in a weaker market.
Two strong clusters now sit between $140 and $142. The first zone between $140.39 and $141.31 holds roughly 16.3 million SOL in cost basis. The second zone between $141.31 and $142.24 carries around 16.9 million SOL.
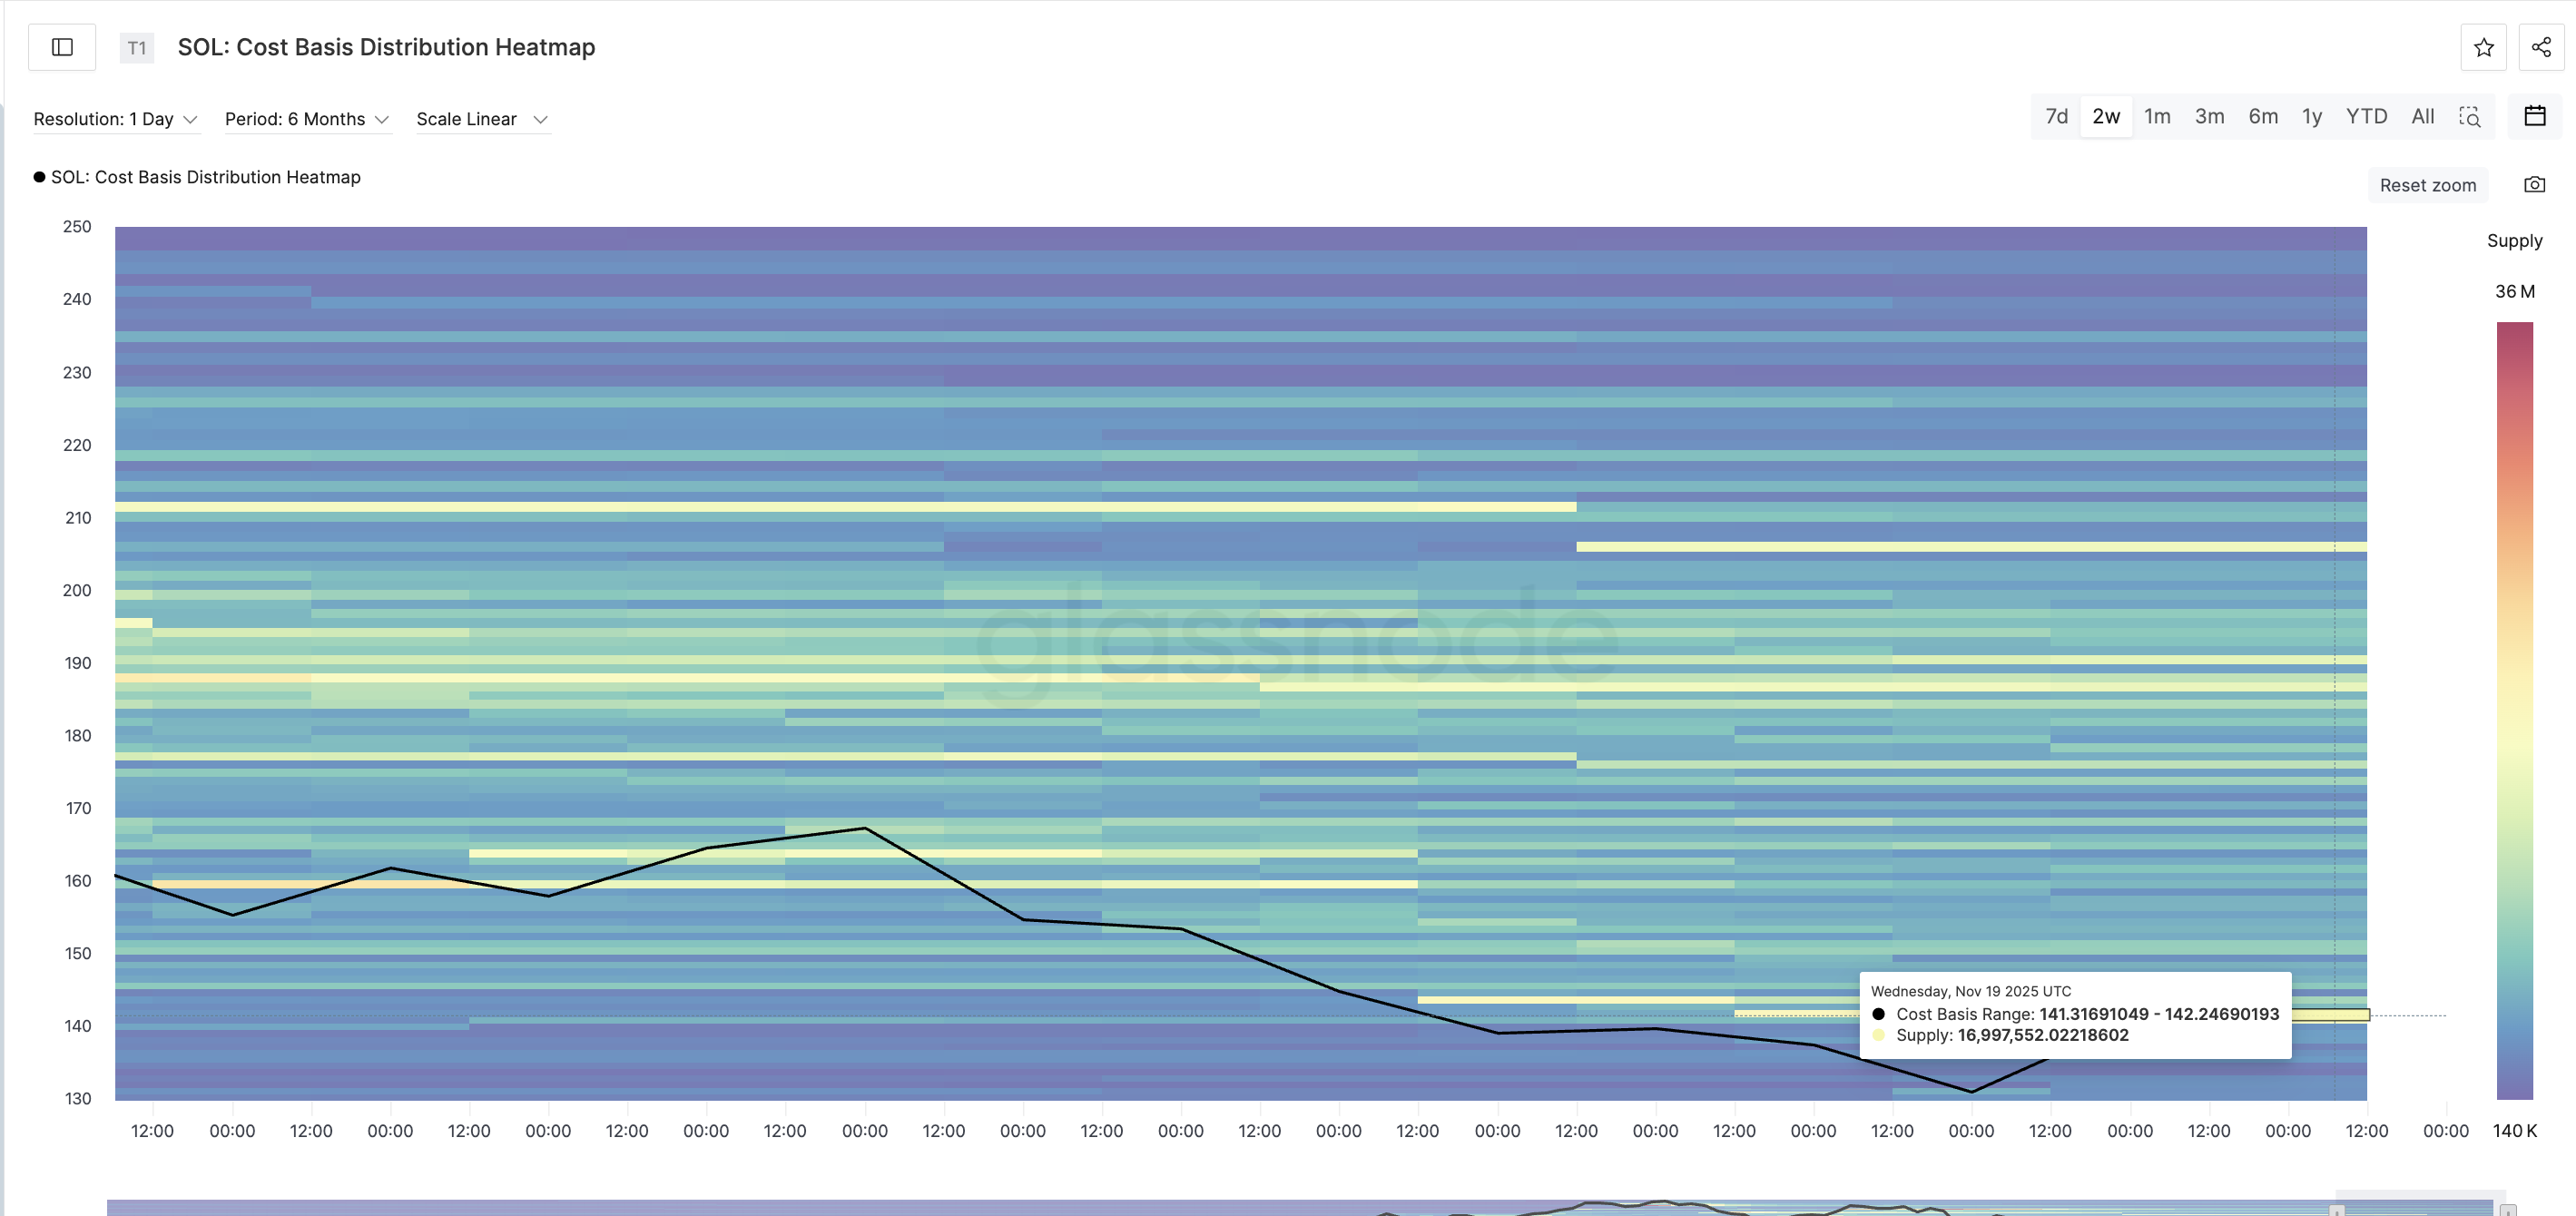
These are heavy supply areas, and the price is still trading right close to them. For the Solana price to hold the bounce, it needs a clean daily close above $143, which sits just above both clusters.
Without that close, the rebound loses strength because the supply pressure is still active. And the EMA structure weakening near the heavy supply clusters isn’t helping the price action either. And it adds more weight to the long-term holder bearishness.
All Eyes on These Solana Price Levels
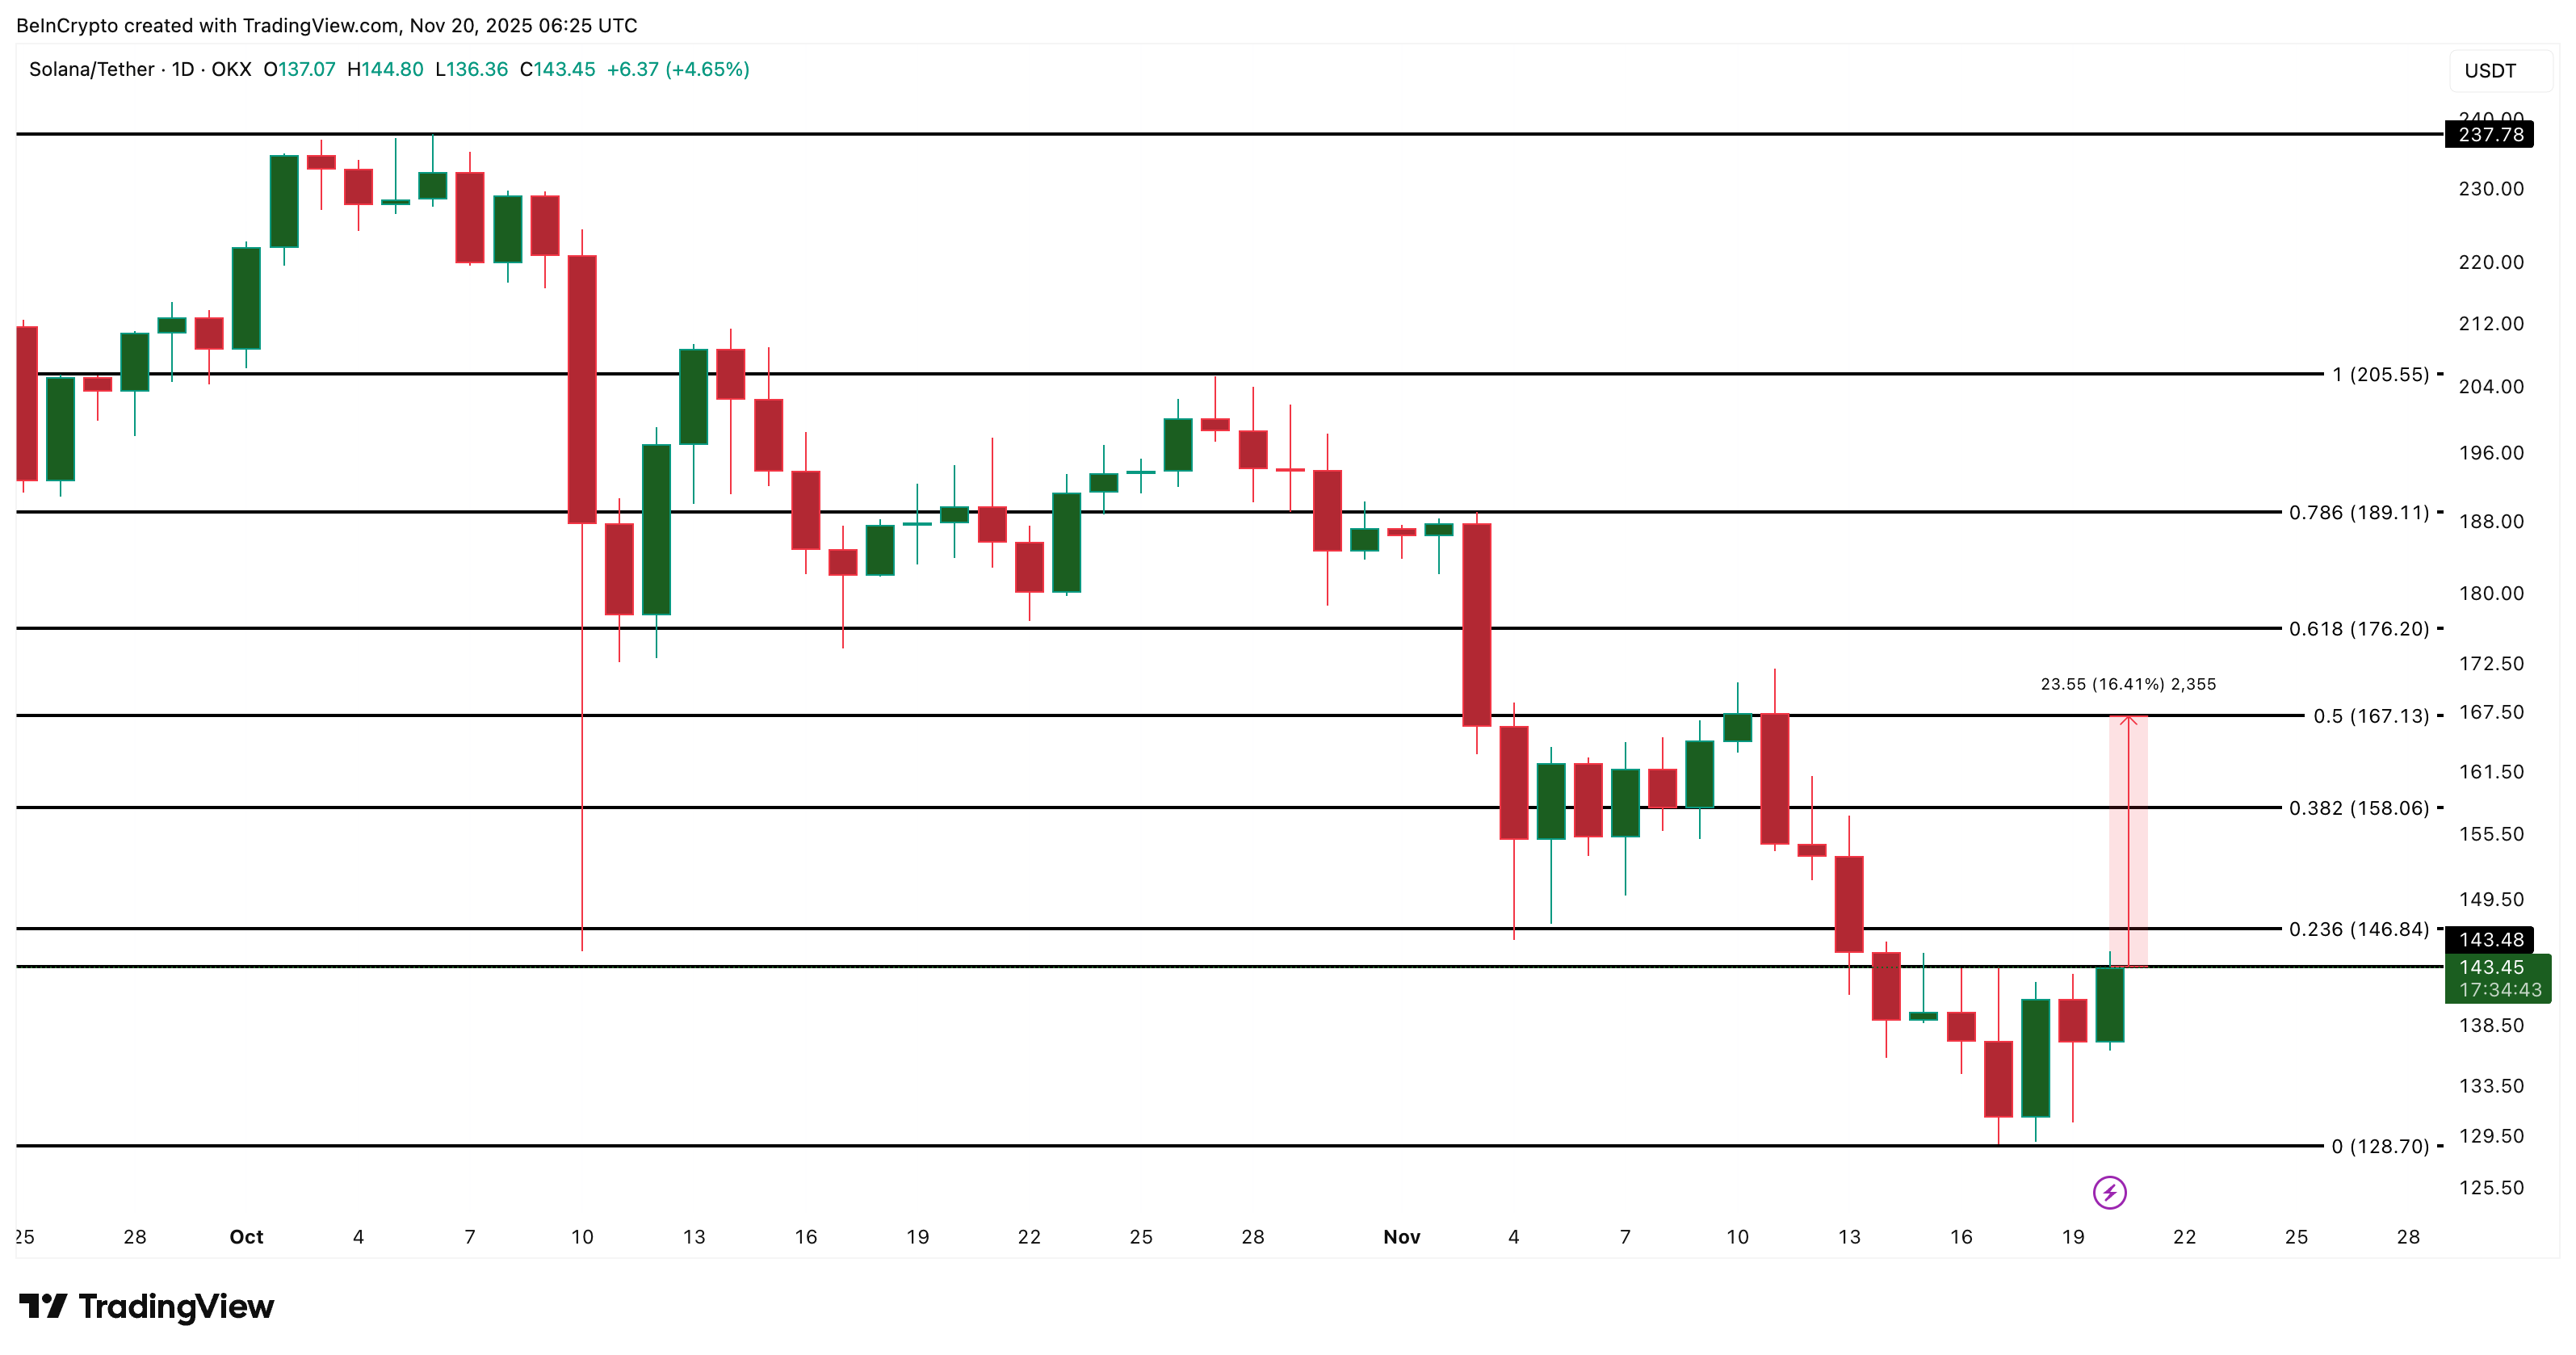
A daily close above $143 is the first sign that the rebound can continue. If the price stabilizes above it, Solana can stretch toward $146, and then toward $167, which is the level Solana failed to clear since November 4. A break above $167 would start easing the larger downtrend and open a move toward $189 and $205.
But if Solana closes back under $143, the bounce likely fades and the recent move becomes a range-bound pause. Losing $128 would confirm weakness and allow a deeper slide.
Right now, Solana is trying to recover, but long-term holders are still cutting exposure, the bearish EMA cross is approaching, and the price is pressing into one of its heaviest supply clusters.
These factors explain why long-term holders are not buying the Solana price reversal theory yet. A clean daily close above $143 is the first signal that the bounce has real strength. Without it, reversal story stay weak, and long-term holders are likely to remain cautious.
The post Long-Term Holders Aren’t Buying the Solana Price Reversal Story — Here’s Why appeared first on BeInCrypto.