HBAR is running out of time. The token is down nearly 2% over the past 24 hours and close to 10% for the week. In the process, HBAR price has broken several short-term support levels and is now hovering near $0.12.
This level is critical. HBAR is barely 1% above a breakdown zone that could drag the price toward $0.10. That move would translate into a 12% to 13% decline from current levels. But one bullish signal is still holding the structure together. If it fails, the downside could accelerate.
Big Money Stepping Away Weakens the Setup
The main source of pressure comes from how large HBAR holders are behaving.
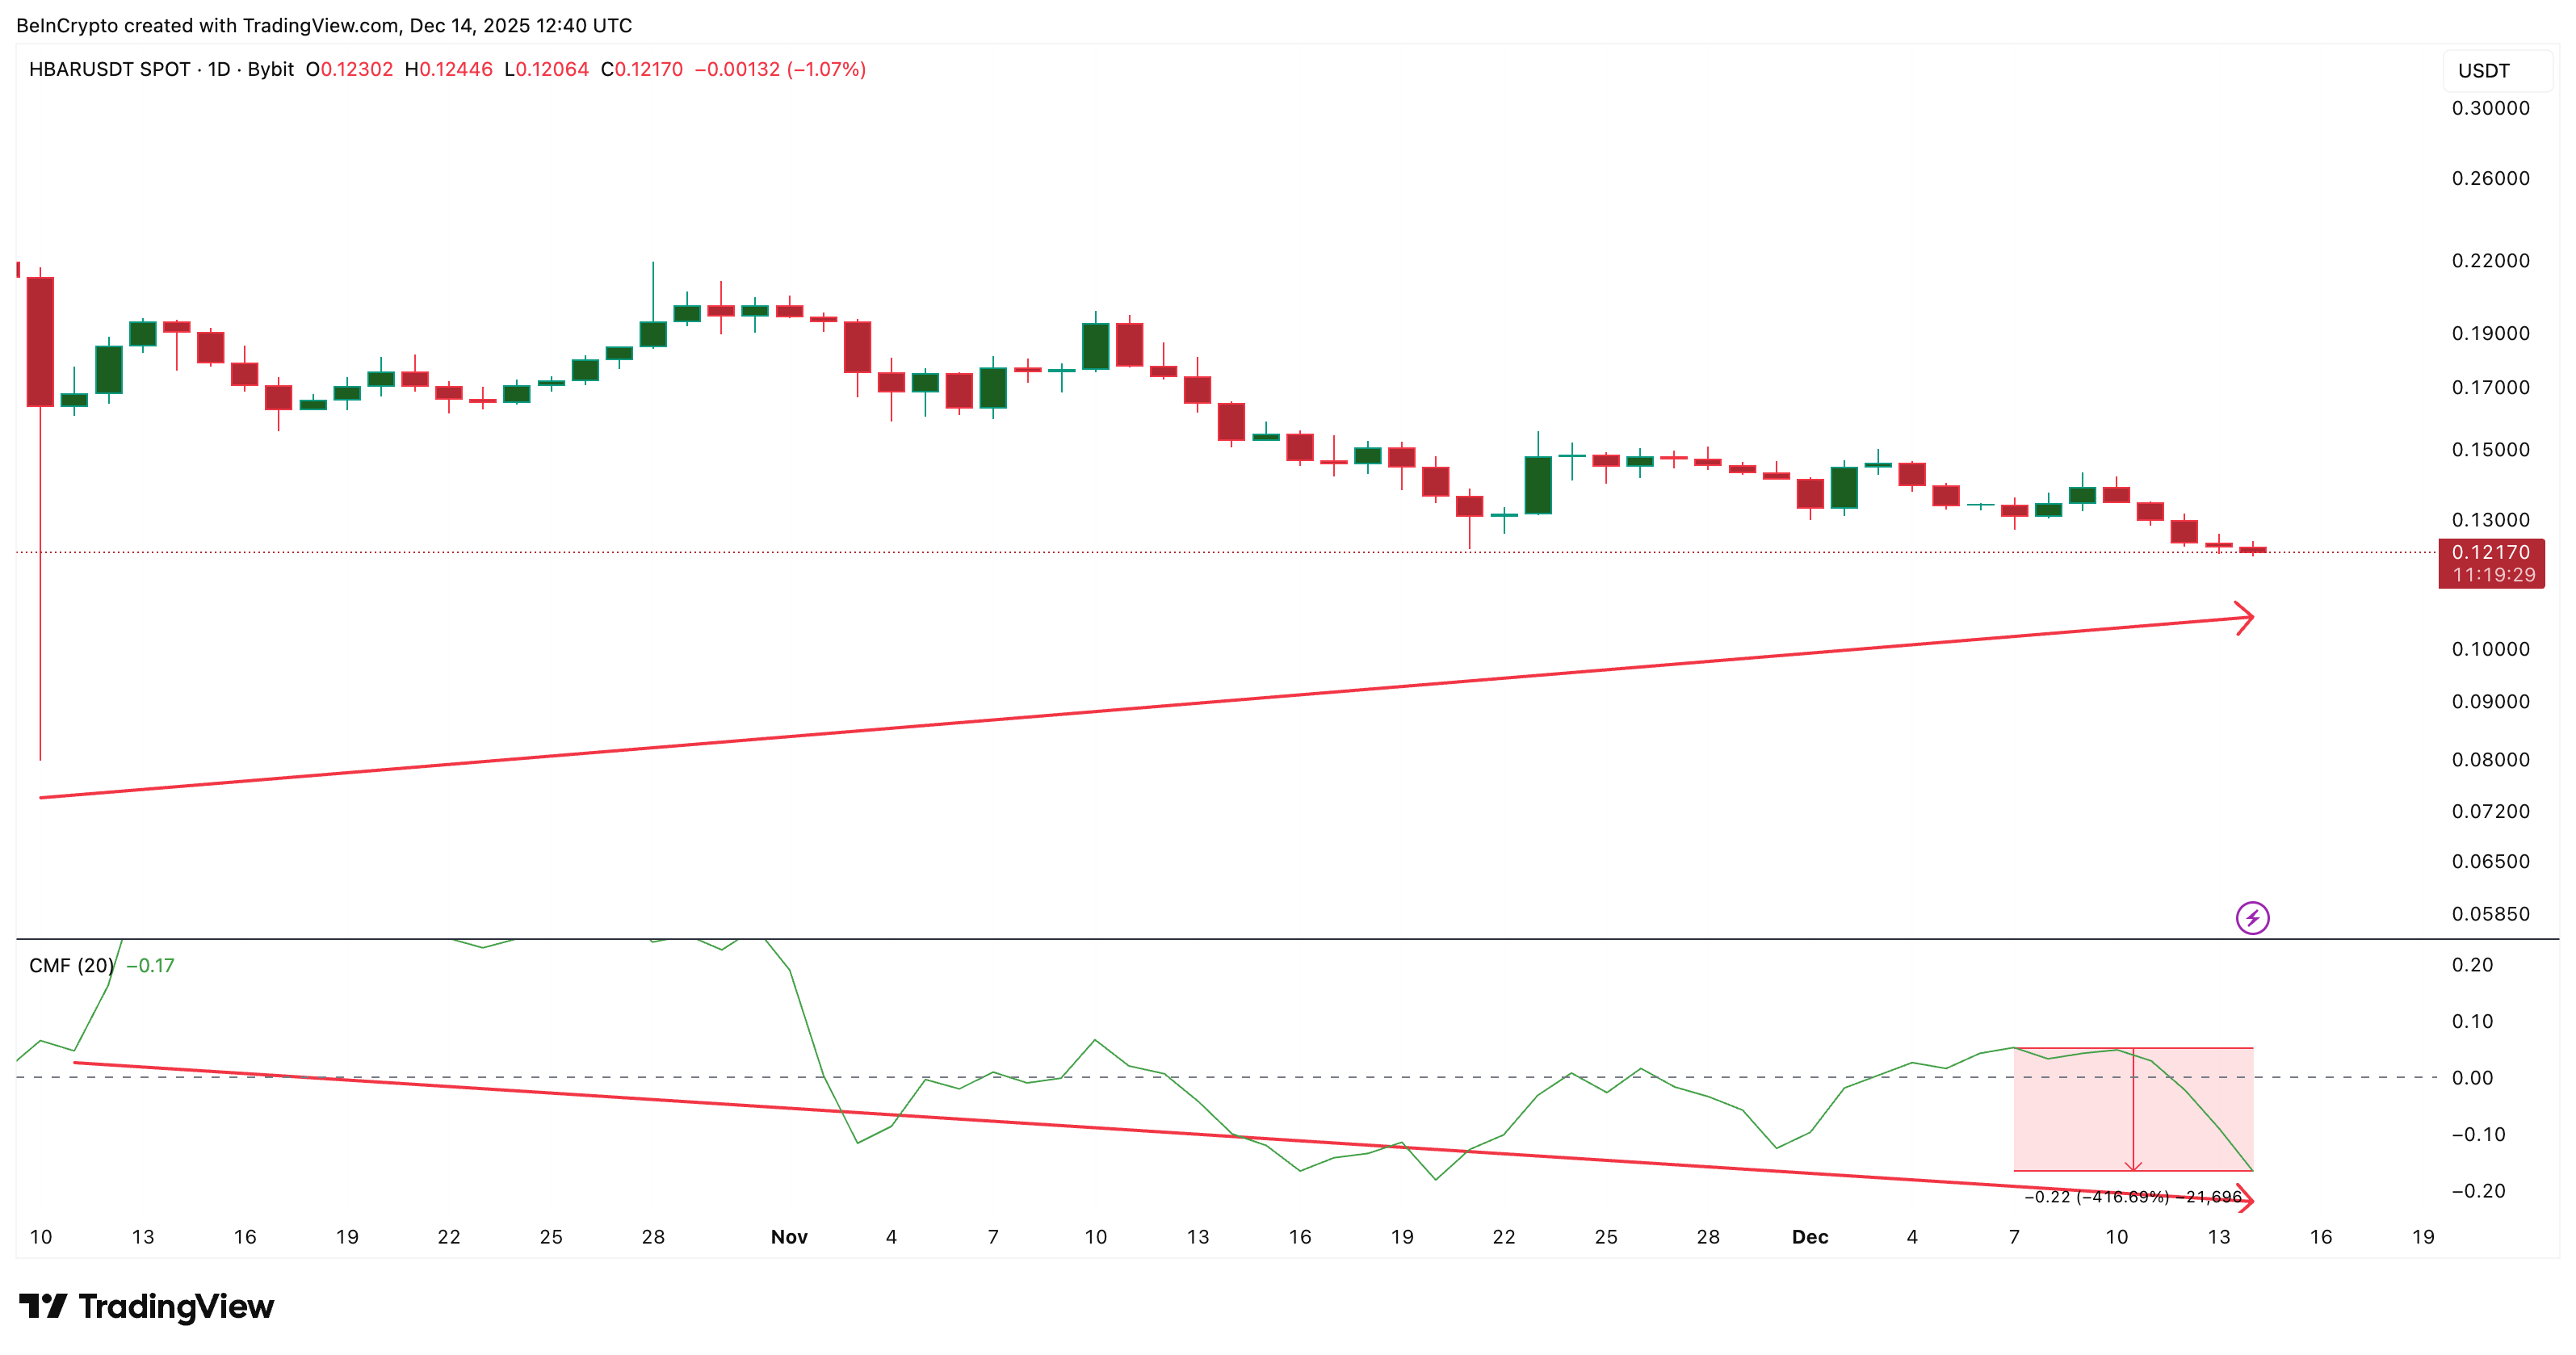
This is visible through the Chaikin Money Flow (CMF), which tracks whether big money is entering or exiting an asset by combining price movement with trading volume. When CMF is above zero, large buyers are active. When it falls below zero, the distribution is taking place.
For HBAR, CMF has deteriorated sharply. Since December 7, CMF has dropped by more than 400% and moved deep into negative territory. Earlier pullbacks still saw CMF stay positive, meaning buyers absorbed selling pressure. This time, that support is gone.
Want more token insights like this? Sign up for Editor Harsh Notariya’s Daily Crypto Newsletter here.
There is also a clear bearish divergence. Between October 10 and December 14, the HBAR price formed higher lows, while the CMF formed lower lows. This shows that recent price stability was not backed by strong demand from large players.
In simple terms, price tried to hold up while big money quietly exited. That imbalance makes the HBAR price vulnerable.
One Bullish Signal Is Still Holding the Floor
Despite the weak big-money picture, one momentum indicator is still flashing a bullish sign.
That indicator is the Relative Strength Index (RSI), which measures the strength and speed of recent price moves. It helps identify when selling pressure may be getting exhausted. Readings near 30 usually suggest oversold conditions.
On HBAR’s daily chart, RSI has formed a bullish divergence. Between November 21 and December 14, the HBAR price made a lower low, while the RSI made a higher low. This is a classic bullish divergence and often appears as a trend reversal sign.
P.S. The HBAR price is in a clear downtrend, losing over 48% in the 3-month horizon.
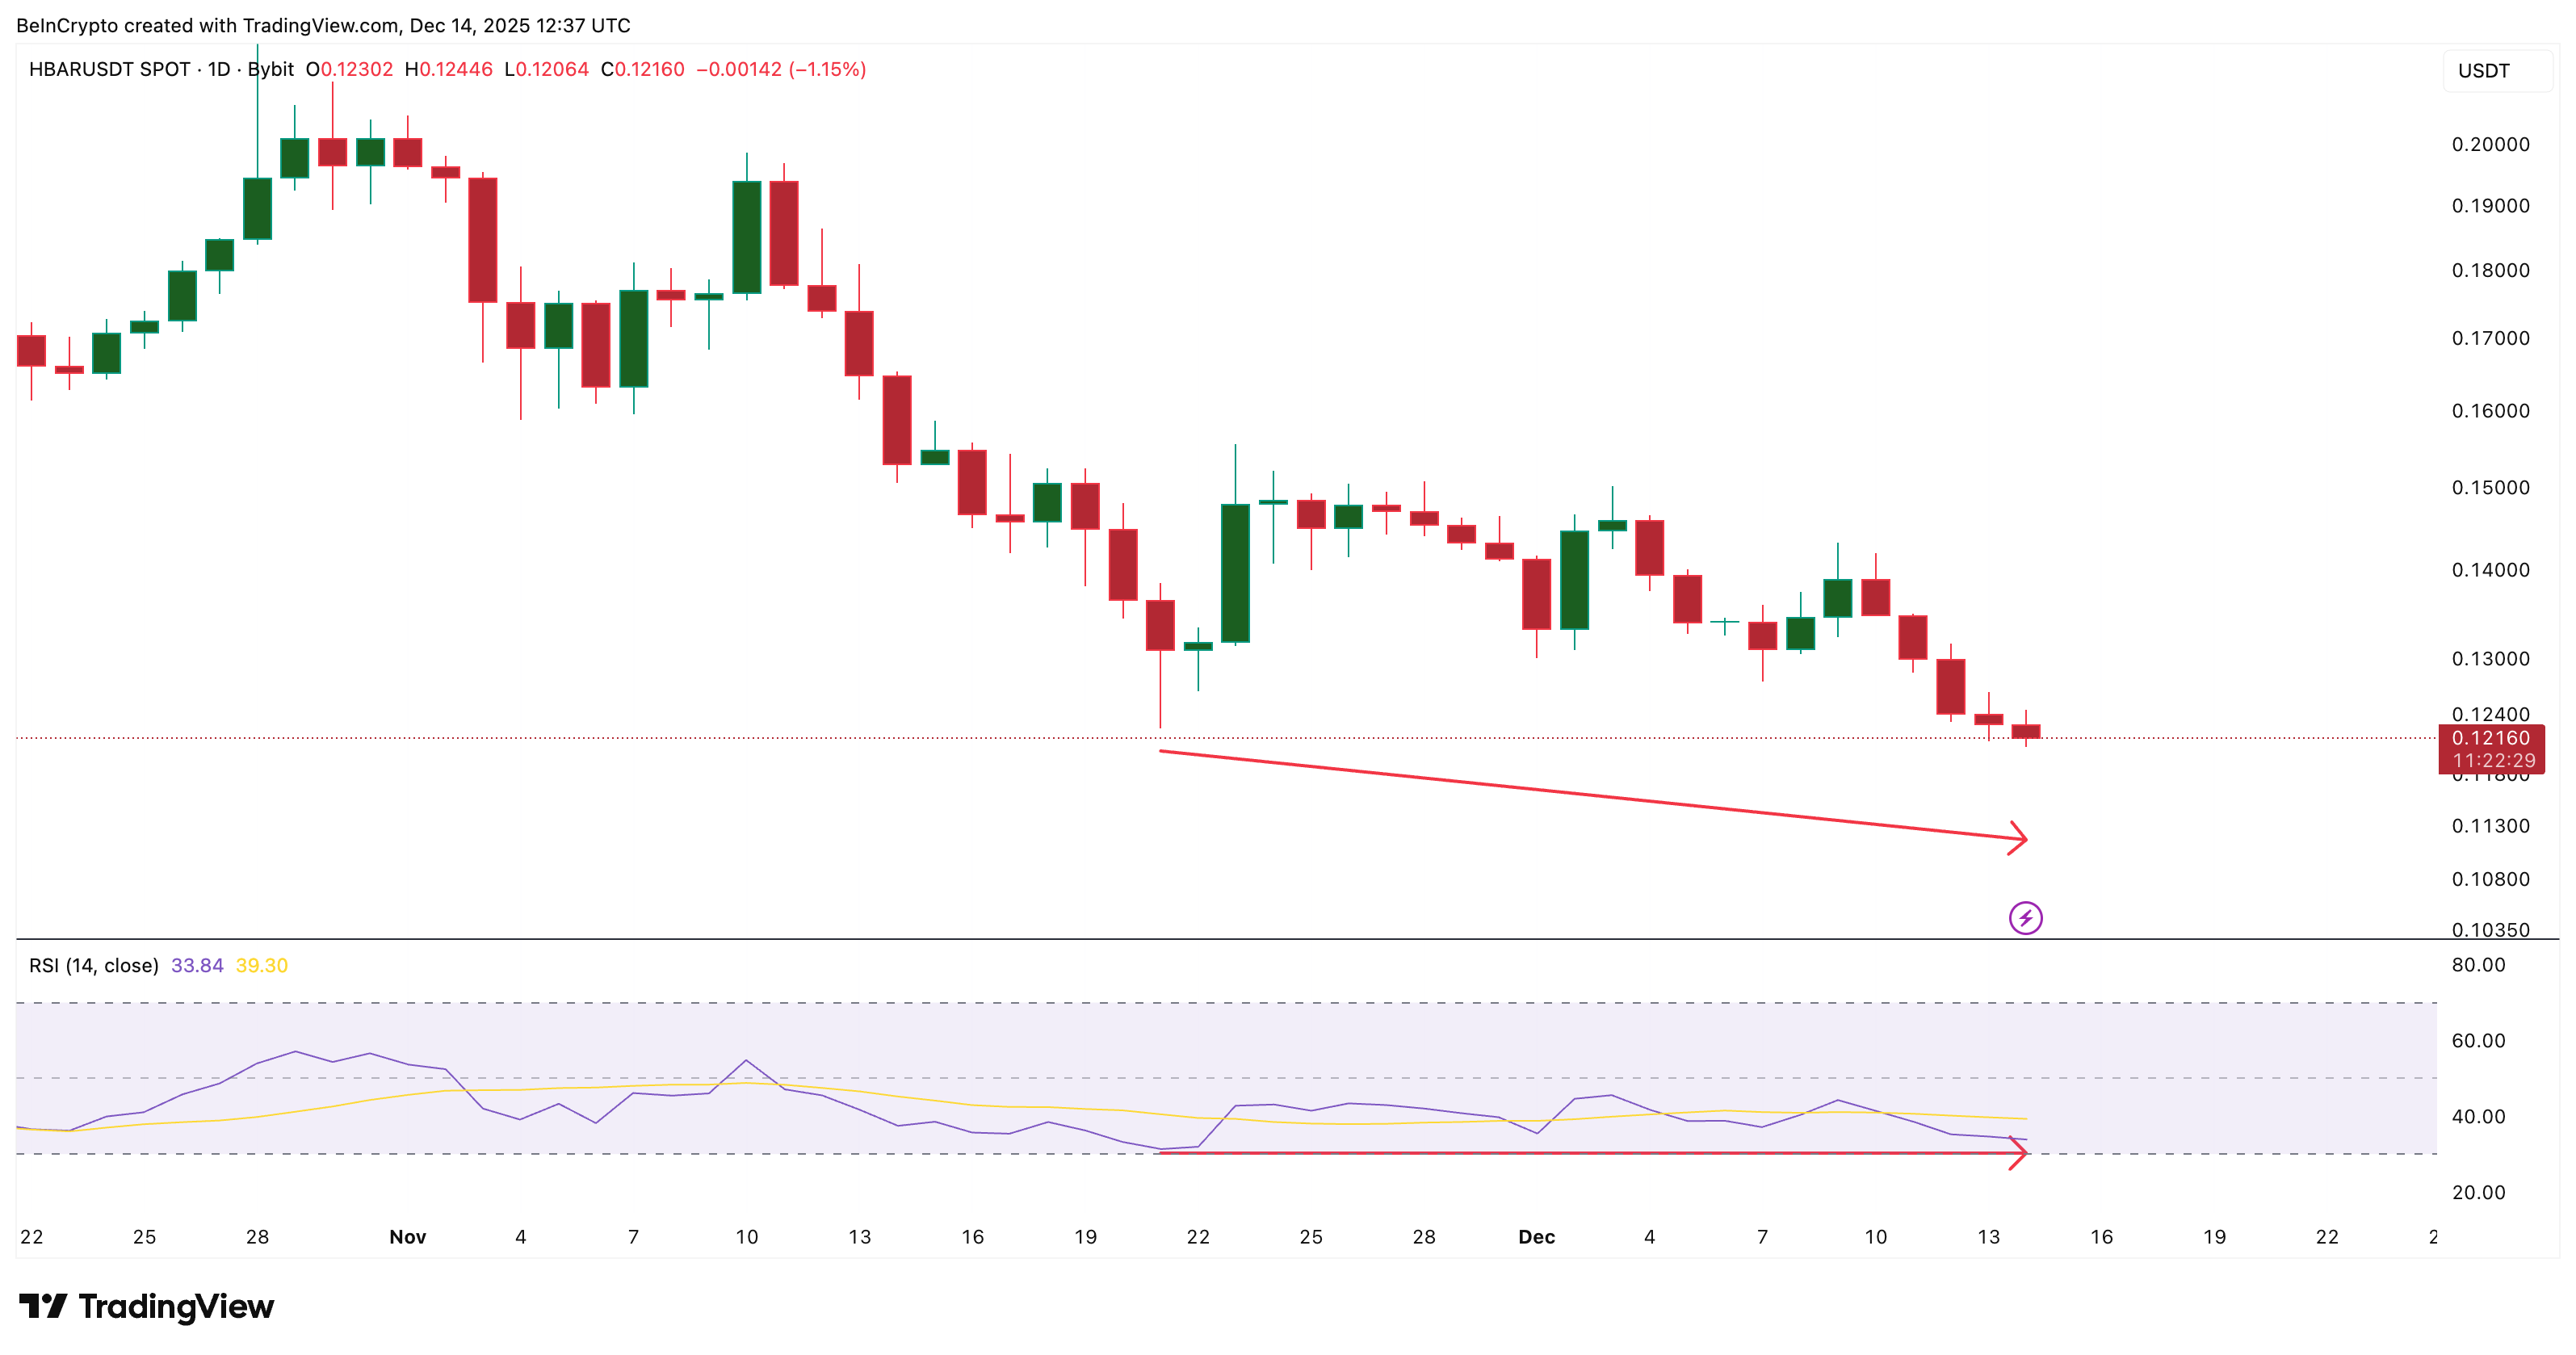
This tells us sellers are still pushing prices lower, but with less force each time. The decline continues, but the seller-driven momentum behind it is weakening. At the moment, this RSI divergence is the only bullish play HBAR has left.
HBAR Price Breaks Down or Turns the Tide?
Price action defines the final outcome. HBAR is trading below a descending trend line that has capped every rally for weeks. At the same time, price is sitting on a trend-based Fibonacci support near $0.12. That line acts as the base of the descending triangle pattern, completed by the descending trendline.
This zone is the last line of defense.
If $0.12 breaks decisively, the next major support sits near $0.10. That move would confirm a 12% to 13% breakdown and extend the bearish trend.
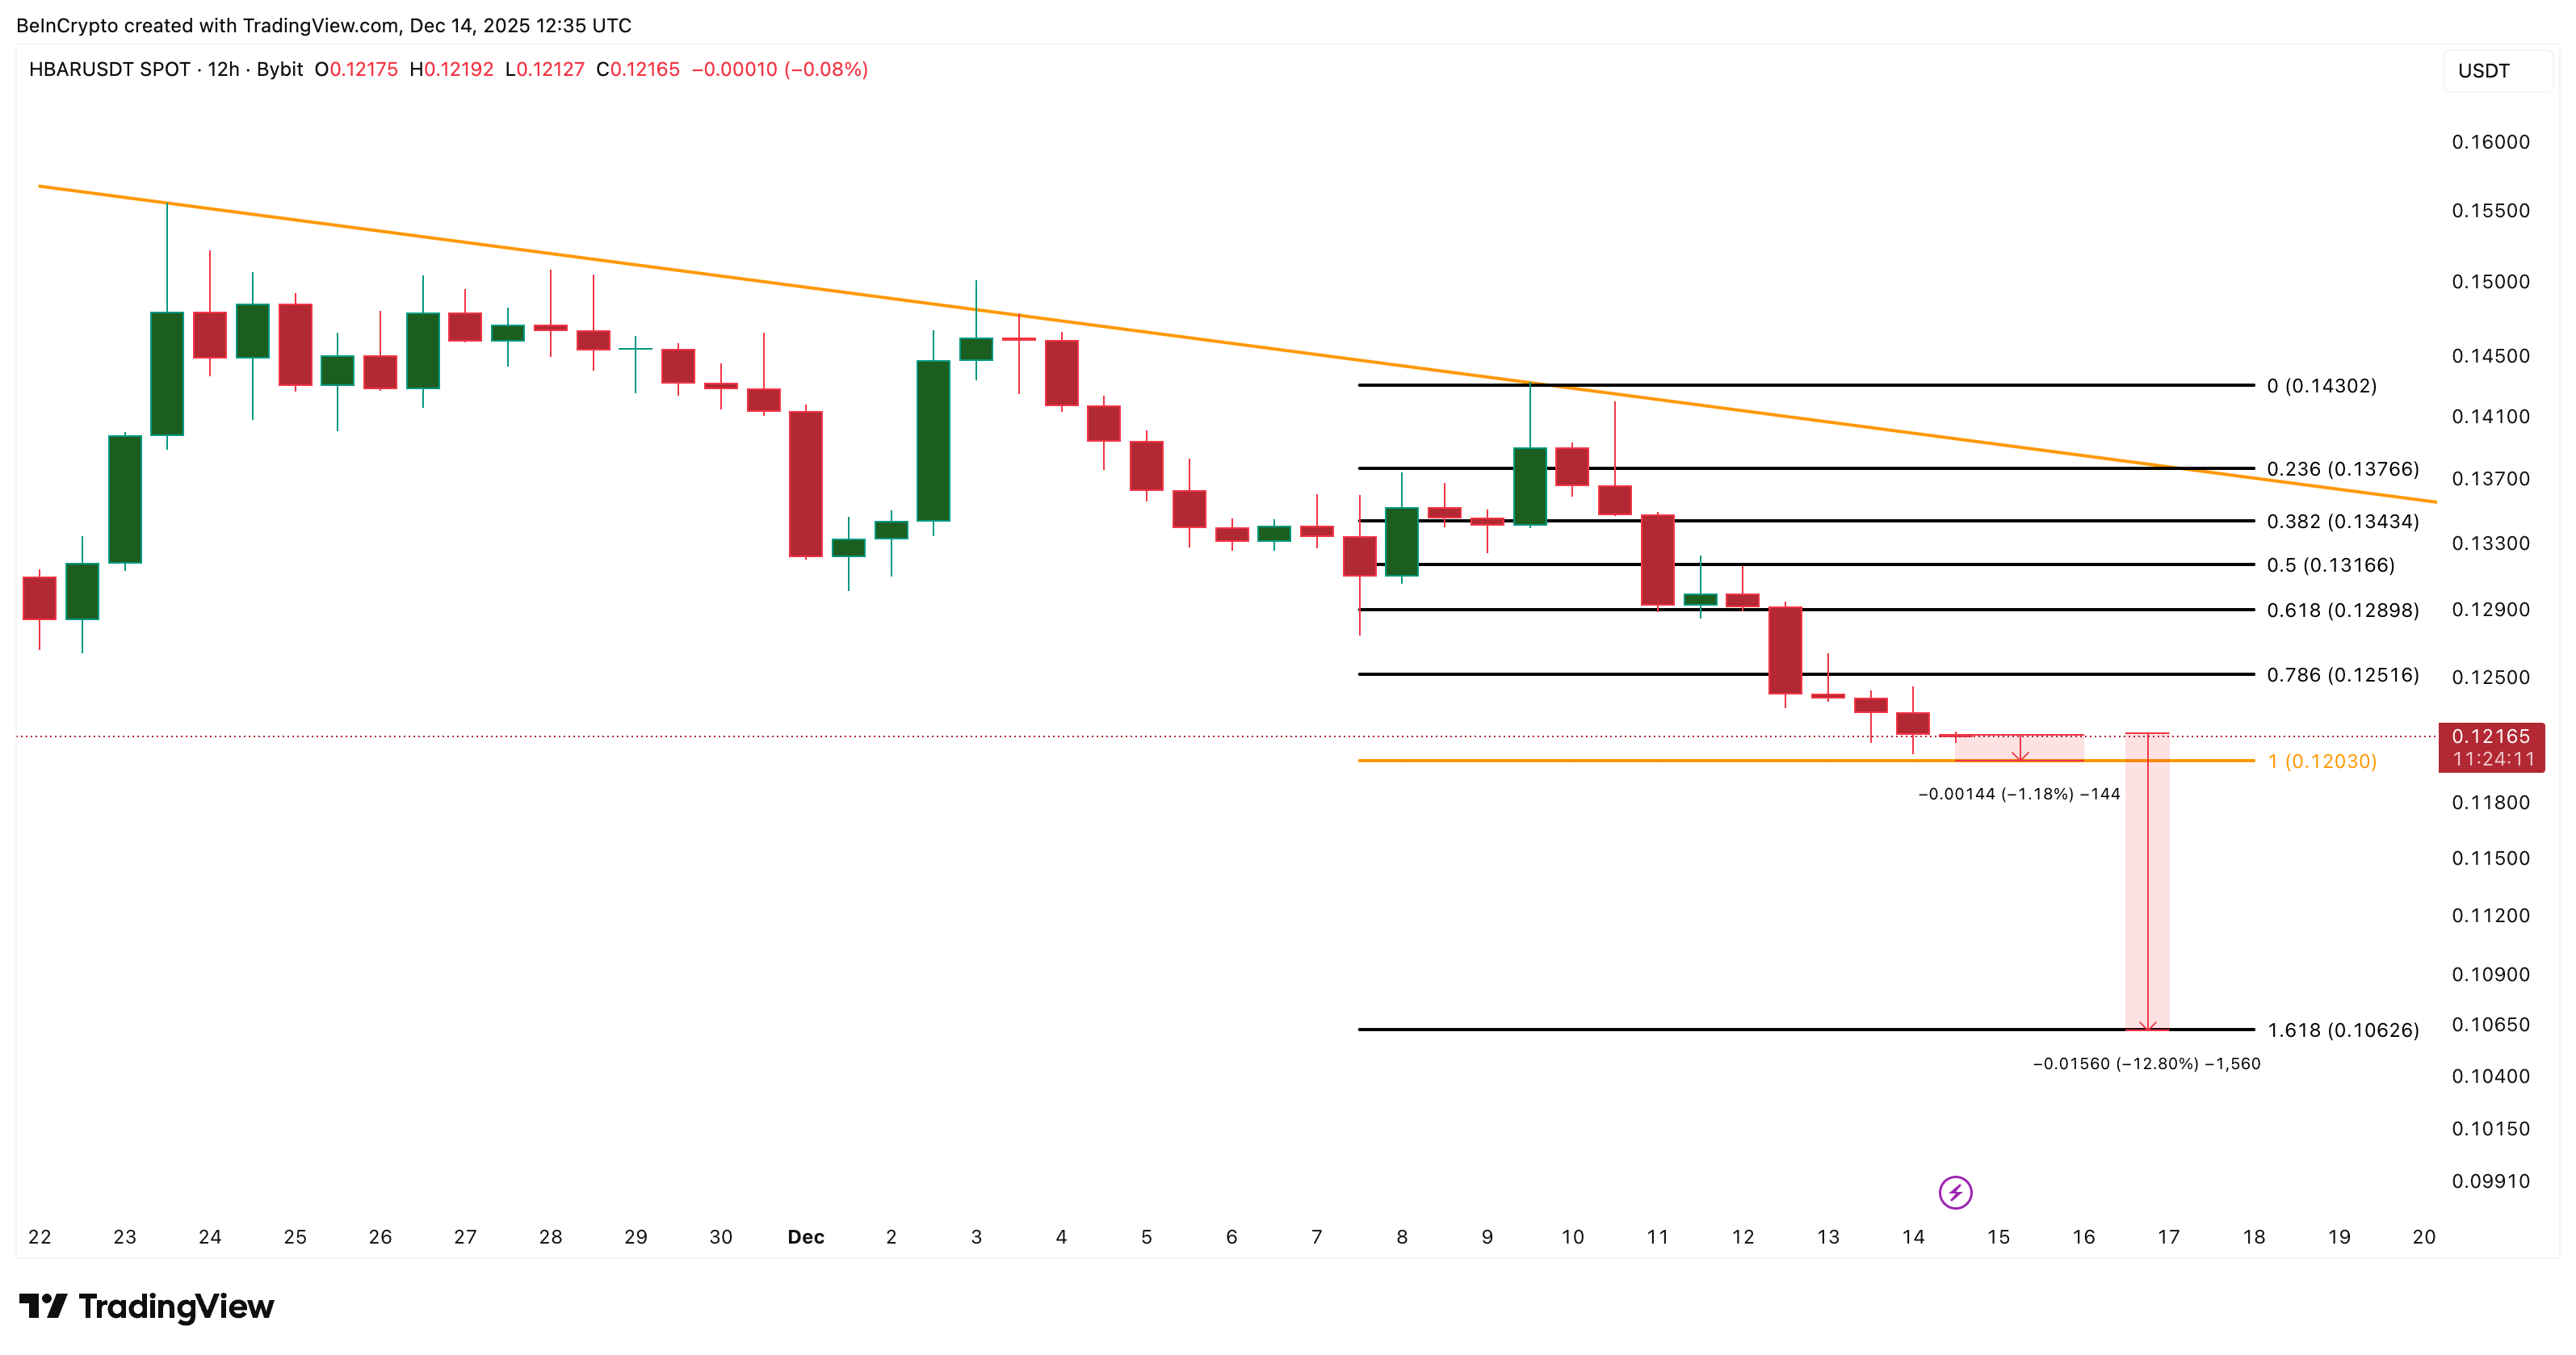
To stabilize, the HBAR price must reclaim $0.13. That level lines up with a key Fibonacci retracement zone and would signal buyers stepping back in.
A stronger shift would only come above $0.13. That would place the price back above the descending trend line and reset the structure from bearish to neutral.
The post HBAR Has One Bullish Play Left — Is It Enough to Avoid a 13% Breakdown? appeared first on BeInCrypto.