
Bitcoin price rose about 2.6% in the past 24 hours, briefly touching the $72,000 level before easing slightly. The move came as the market attempted to break a short-term resistance zone that had capped price action for several days.
At first glance, the latest price structure suggests a possible bull trap, a setup where a breakout quickly reverses and catches buyers off guard. But a closer look at derivatives positioning and spot market activity suggests the opposite may happen. Instead of trapping bullish traders, the market may still have enough bearish positioning left to fuel another push higher.
Bitcoin’s Cup Pattern Looks Bullish, but Momentum Signals a Possible Trap
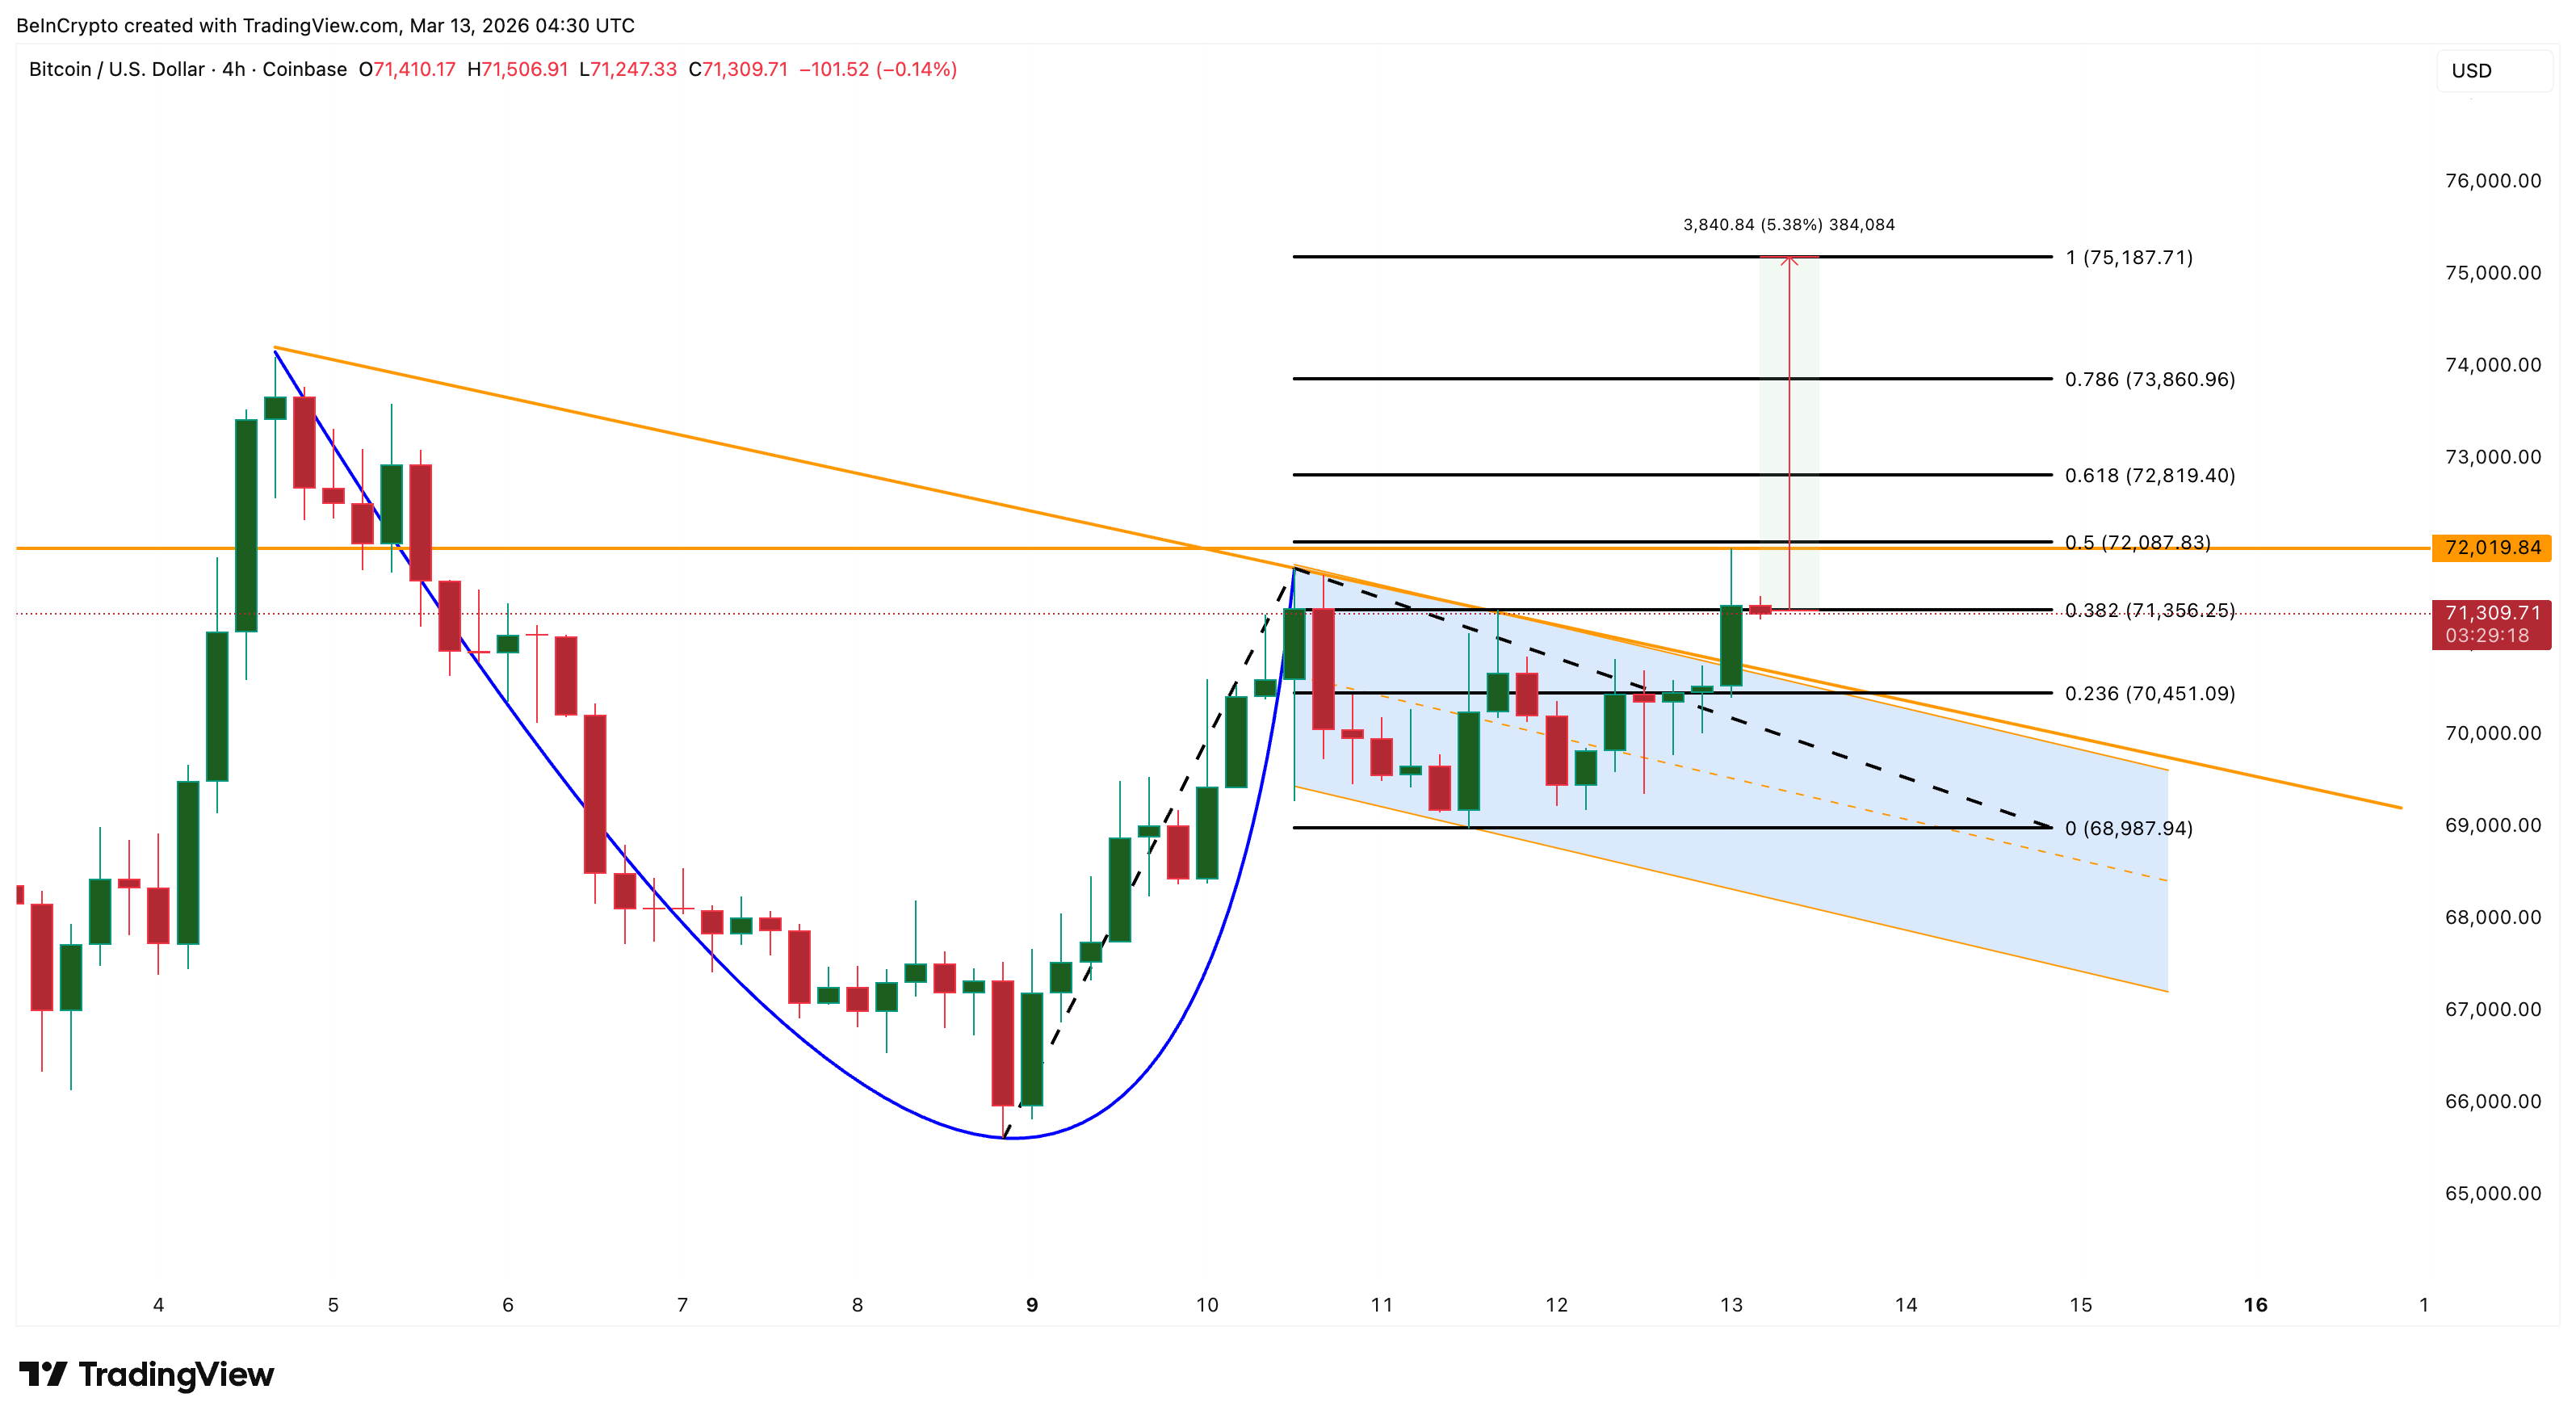
The short-term 4-hour chart shows Bitcoin forming a cup-and-handle pattern, a structure traders often view as a bullish continuation signal.
An interesting detail appears in the structure. The neckline of the cup slopes downward, and the upper trendline of the handle follows almost the same slope. This means the breakout level for the handle and the cup’s neckline are nearly identical. Because both resistance levels overlap, a breakout above this line would simultaneously confirm the cup pattern and break the short-term downtrend, but it also increases the risk of a false breakout if sellers defend that same level.
Want more token insights like this? Sign up for Editor Harsh Notariya’s Daily Crypto Newsletter here.
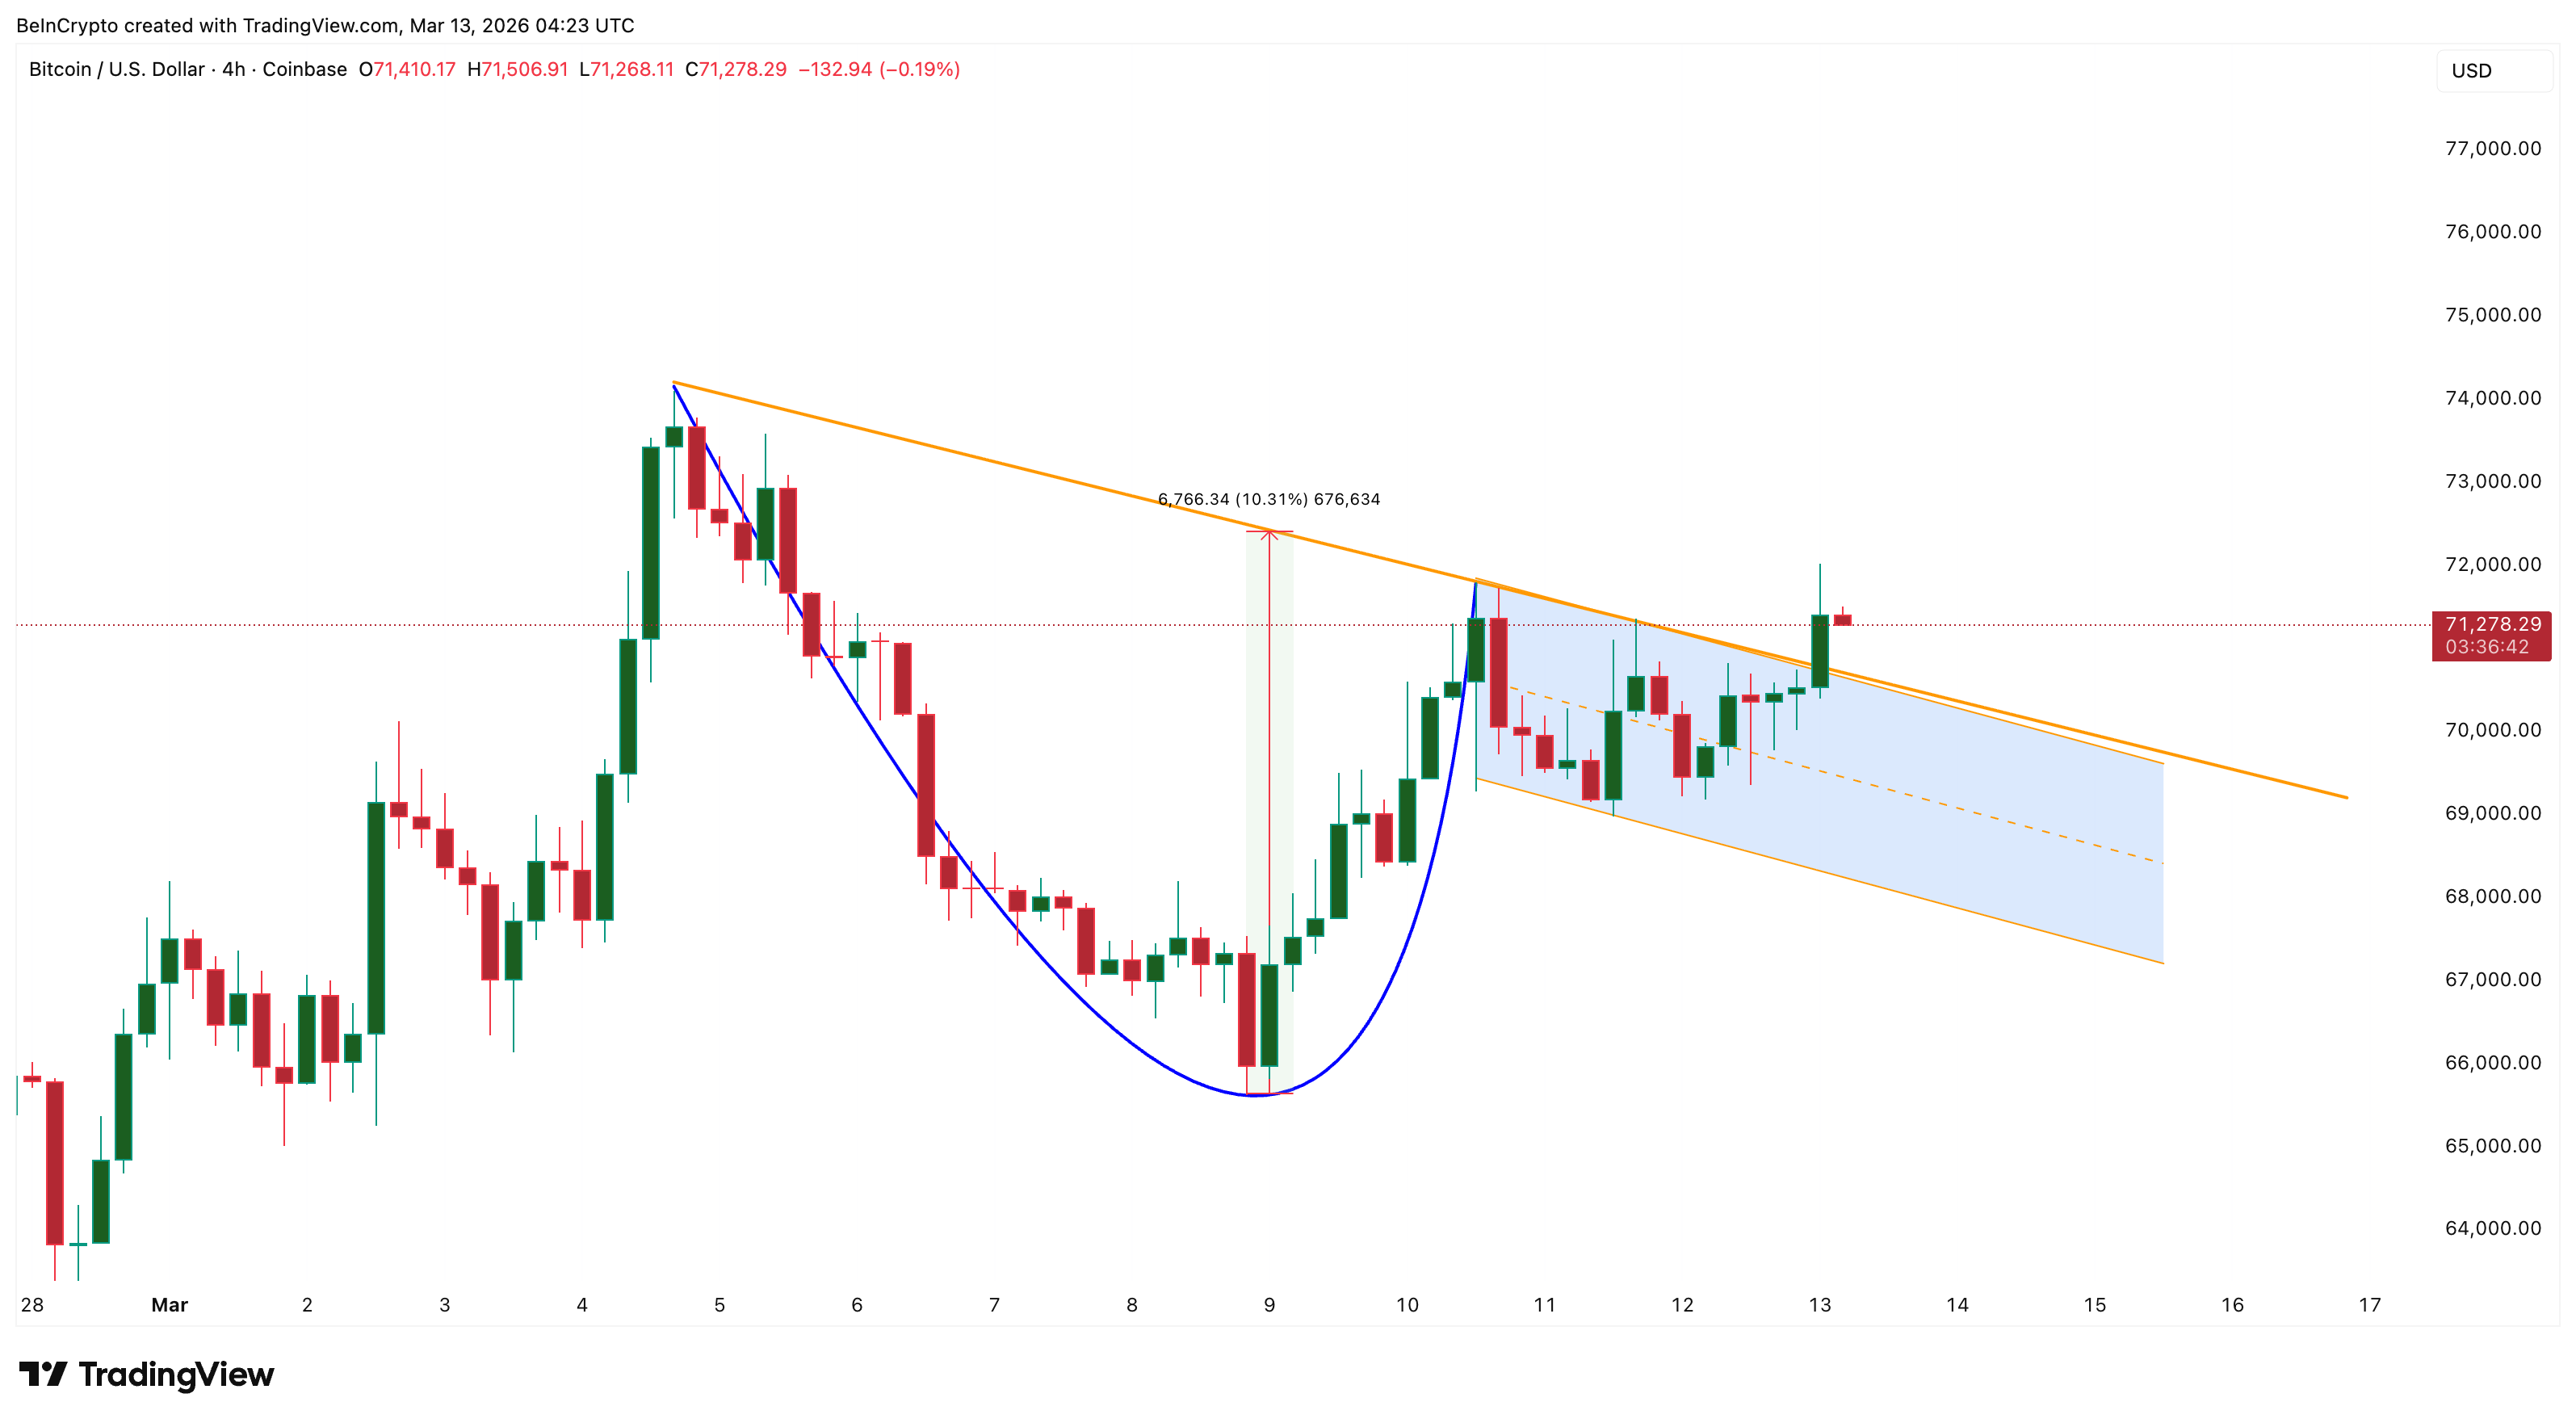
When Bitcoin moved above that shared resistance level, the pattern appeared to confirm a breakout. The theoretical target for a cup-and-handle pattern is measured from the bottom of the cup to the neckline, which in this case points to a move of about 10% from the breakout area. However, the breakout also introduced a potential risk signal.
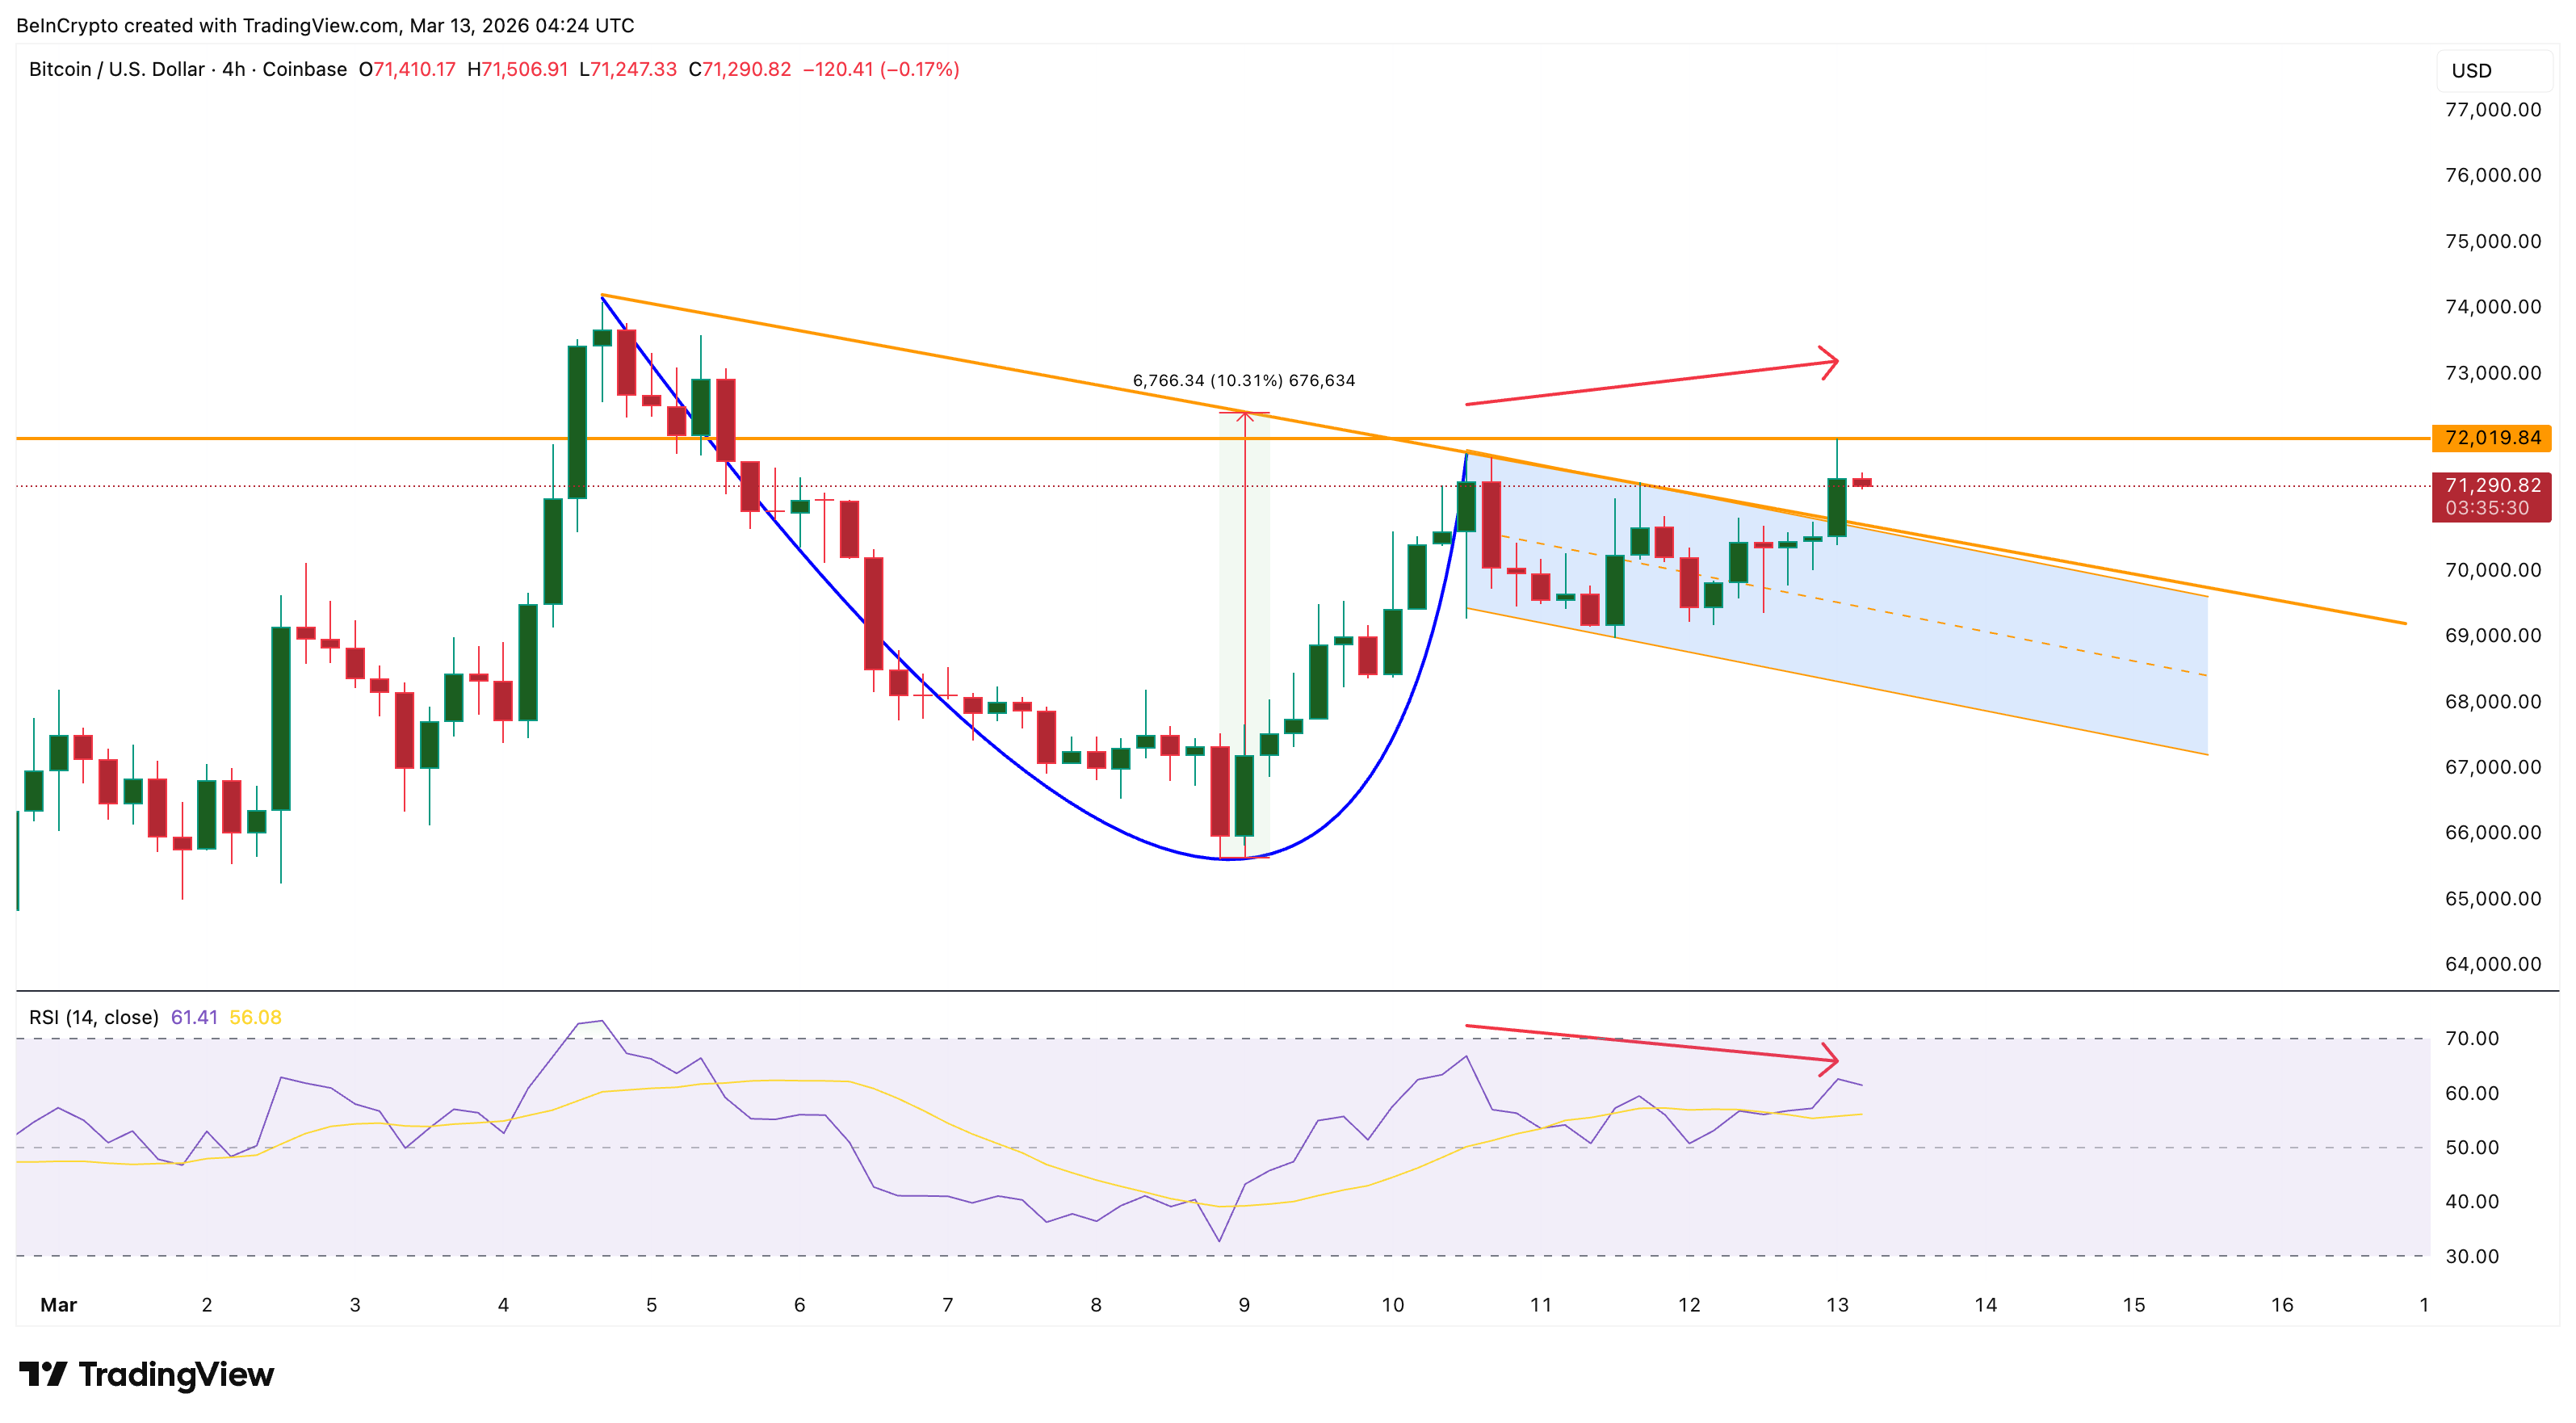
Bitcoin briefly moved above $72,000, but sellers quickly appeared, leaving a long upper wick on the candle. When the Relative Strength Index (RSI), a momentum indicator, is added to the same chart, another warning becomes visible.
Between March 10 and March 13, Bitcoin’s price formed a higher high, while RSI formed a lower high.
This mismatch is called bearish divergence, which often signals that buying momentum is weakening even as the price rises. If Bitcoin fails to reclaim the $72,000 resistance level on the 4-hour timeframe, the divergence could trigger a short-term pullback.
But technical traps only work when traders are positioned the wrong way.
Derivatives Traders Remain Bearish Despite the Breakout
Derivatives market data suggests that traders are not aggressively chasing the breakout.
Open interest, which tracks the total value of active futures contracts, has increased during the move higher. On March 9, Bitcoin’s open interest stood near $21.4 billion. It has since risen to about $23.49 billion, representing an increase of roughly 10%.
Normally, rising open interest alongside rising prices can signal growing speculative enthusiasm. But another key metric tells a different story.
Funding rates, which measure whether futures traders are predominantly long or short, remain negative. The rates are currently around –0.014%.
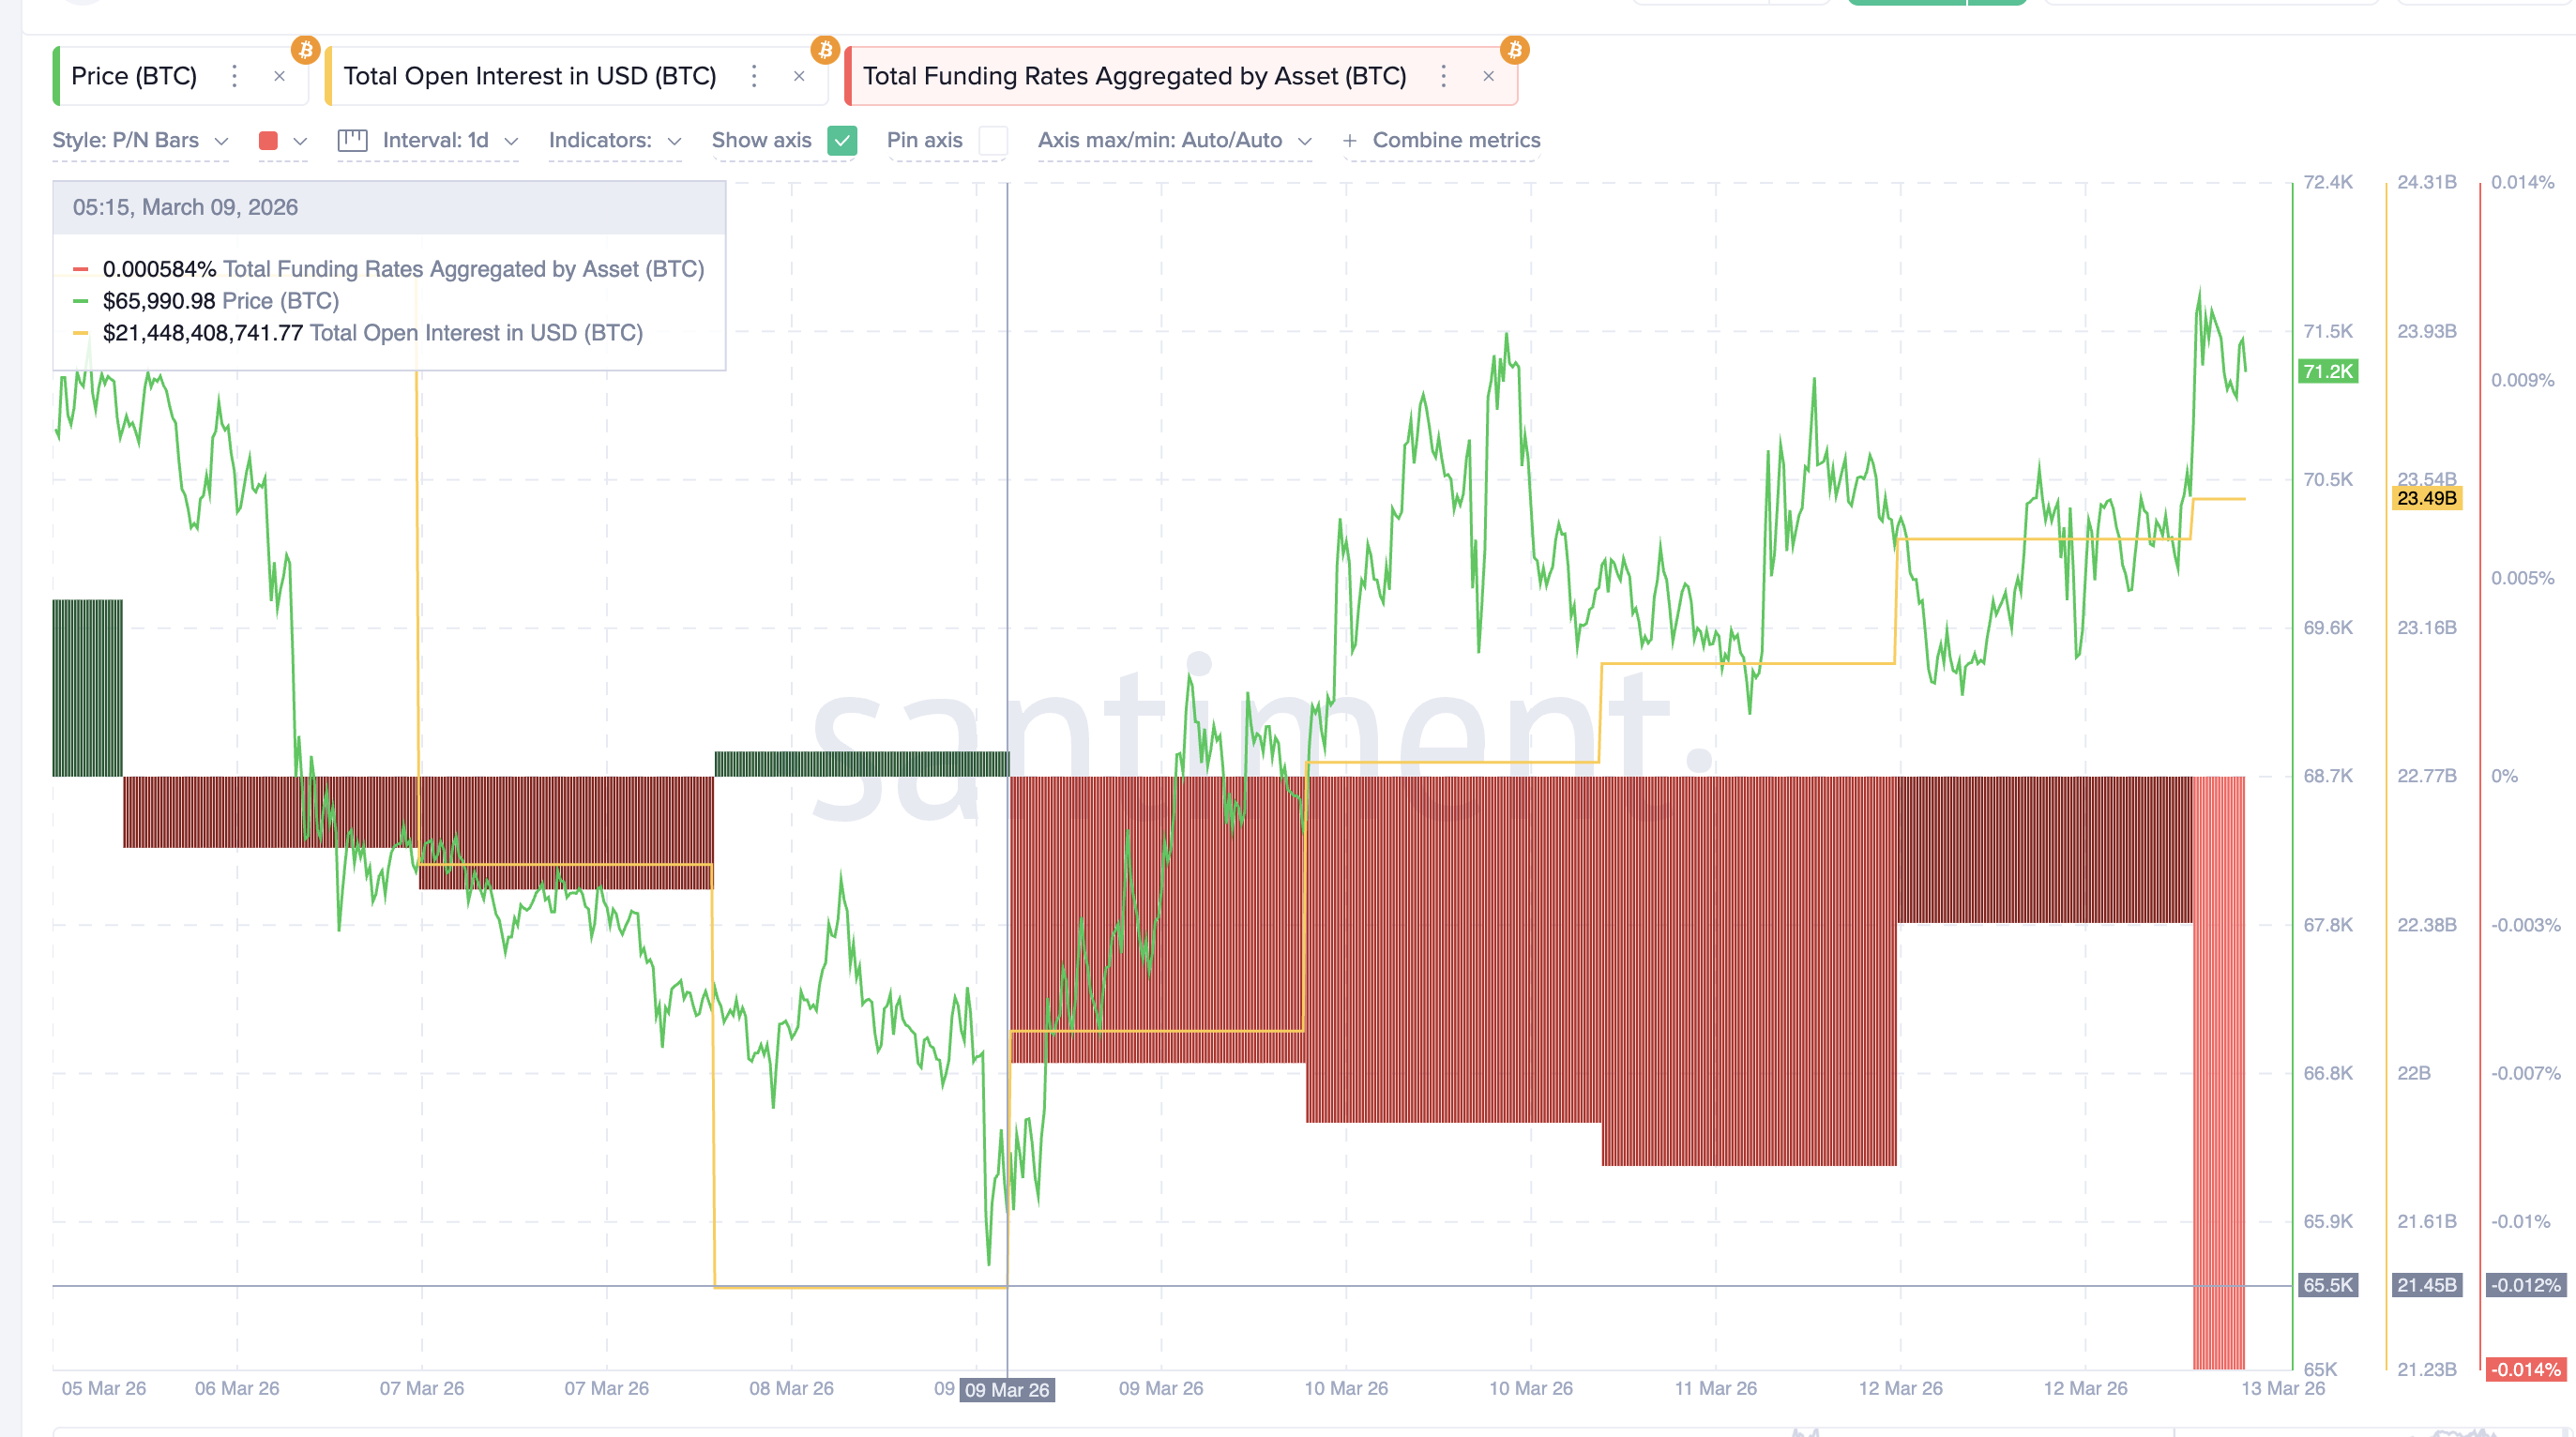
Negative funding means short traders dominate the market, suggesting that many participants continue betting on downside despite the price breakout.
This creates a situation where the expected bull trap may struggle to trigger because the market is not excessively bullish. Instead, the presence of heavy short positioning leaves room for a short squeeze, in which rising prices force bearish traders to close their positions, pushing the market higher. Spot market flows add another important piece to the puzzle.
Spot Outflows Suggest Buying Pressure Could Push Bitcoin Price Higher
Exchange flow data shows that coins continue leaving trading platforms, which often signals accumulation.
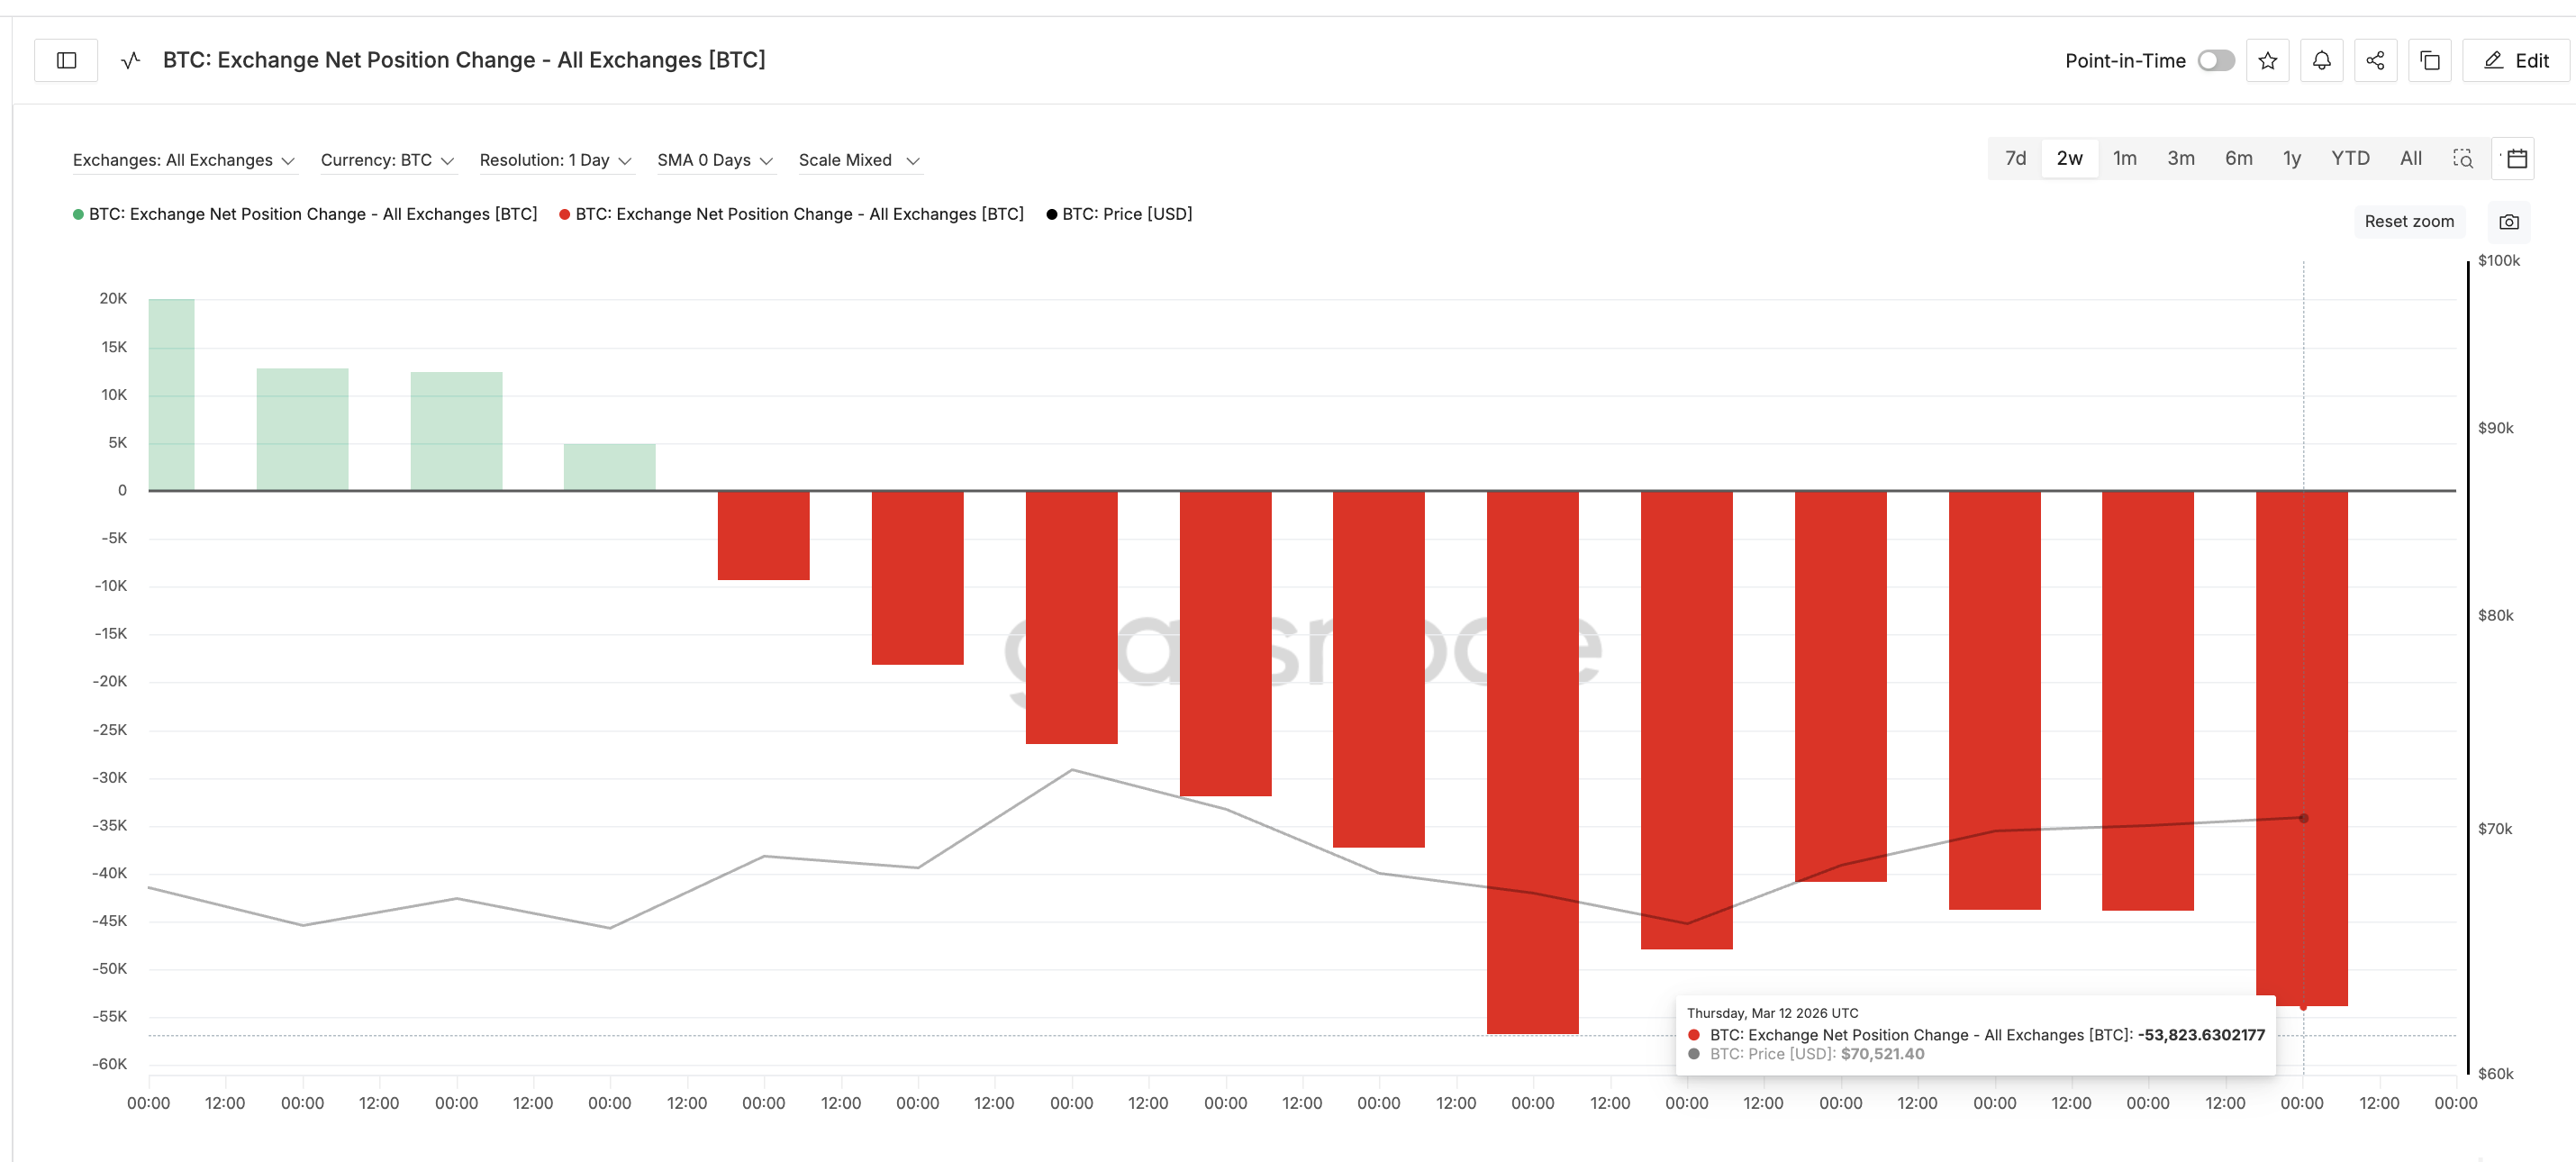
The Exchange Net Position Change metric tracks how many coins move into or out of exchanges. When the metric becomes more negative, it means investors are withdrawing Bitcoin from exchanges, usually indicating reduced selling pressure.
On March 9, the metric showed roughly –40,840 BTC leaving exchanges. That figure has since increased to around –53,823 BTC, a change of about 31.7% toward deeper outflows. This suggests that spot investors have been buying and withdrawing Bitcoin, which typically reduces the available supply for immediate selling.
The combination of bearish derivatives positioning and increasing spot outflows creates a supportive environment for price continuation. While the chart structure initially suggests a bull trap, the broader market positioning indicates that many traders remain skeptical of the rally. That skepticism itself could fuel the next move higher.
If the Bitcoin price manages to reclaim the $72,000 level, the RSI divergence would likely weaken, and the breakout structure could regain momentum.
The next resistance levels appear near $73,800, followed by the $75,100 region. A move into that zone would represent roughly 5% upside from current prices. This would be in line with the 10% rally expectations, based on the cup-to-neckline projection.
On the downside, failure to reclaim resistance could push Bitcoin toward $70,400, with deeper support near $68,900. A drop below $68,900 would weaken the short-term bullish structure.
For now, Bitcoin’s chart may be signaling a potential bull trap, but the broader market does not appear eager to fall for it. With traders still heavily positioned on the short side and spot demand increasing, the setup leaves room for another push toward the $75,000 region.
The post Bitcoin’s Bull Trap Finds Few Takers as Market Preps for $75,000 Instead appeared first on BeInCrypto.