
In the first quarter of 2026, against the backdrop of overall pressure in the crypto market and a more cautious risk appetite among capital, high quality early stage assets remained one of the most attractive structural opportunities in the market.
Gate listed a total of 37 new spot assets in Q1, covering 77.1% of the newly added projects across major exchanges during the same period, of which 27 were first listings, accounting for 73% of Gate’s new listings for the quarter; additionally, 14 were exclusive listings, representing 37.8%.
Amid heightened market volatility, Gate maintained a steady listing pace, strong capability in onboarding high quality projects, and a consistent ability to deliver positive return opportunities.
Overall Overview
From the perspective of total sample size, in the first quarter of 2026, using seven major platforms including Gate as the sample, a total of 48 new projects were listed across leading exchanges.
Among them, Gate listed 37 projects during the quarter, corresponding to a coverage rate of 77.1%, meaning that among the newly added high quality supply competed for by major platforms in Q1, Gate covered more than three quarters of the projects.
For general users, the importance of coverage is self evident. It directly determines whether users can access a sufficiently complete set of core new market listings on a single platform. If a platform has relatively low coverage, even if a few projects perform well, it can still leave users with the impression that important projects are not fully represented.
A coverage rate of 77.1% indicates that at least during Q1, Gate remained closely aligned with the mainstream pipeline of new project supply, allowing users to access most of the new assets worth paying attention to on the platform.
However, what truly defines Gate’s competitiveness is not only the breadth of coverage, but also the structure of that coverage.
Among the 37 new assets listed by Gate in Q1, 27 were first listings, accounting for 73%, while 14 were exclusive listings, representing 37.8%. If calculated based on the overall sample of major exchanges, Gate’s first listing coverage reached 56.3%. In other words, among the 48 new projects listed across major exchanges in Q1, more than half were first listed on Gate.
A high proportion of first listings indicates that Gate has strong attractiveness at the critical stage when projects transition from primary market narratives into secondary market trading. Projects choosing Gate as one of their initial public trading venues essentially reflects recognition of Gate’s user base, liquidity absorption capacity, initial price discovery efficiency, and market distribution capability. A platform that consistently secures first listings is often in a relatively proactive position in competition for project resources.
A meaningful share of exclusive listings reflects another layer of capability with substantial value. First listings demonstrate a platform’s ability to participate in mainstream high quality supply, while exclusive listings indicate whether the platform possesses independent judgment and differentiated sourcing capabilities.
Especially in a weak market environment, the selection difficulty for exclusive projects is higher, as exclusivity implies a lack of sufficient external validation from other platforms, requiring the platform to bear the responsibility of early judgment. If selection proves inaccurate, post listing performance will quickly reflect the issue; if exclusive projects perform well after listing, it not only indicates access to resources but also strong forward looking evaluation capability.
From this overall overview, Gate’s core foundation in Q1 can be summarized in three key characteristics.
(1) Broad coverage, indicating continuous participation in top tier new supply;
(2) High proportion of first listings, indicating strong capability to capture high quality projects at their entry into the market;
(3) A meaningful share of exclusive listings, showing that the platform is not merely following the market, but actively identifying and positioning differentiated assets in advance.
Taken together, these three factors form the foundation of Gate’s spot listing system in Q1. Only when coverage, first listings, and exclusivity all hold simultaneously can a platform’s listing framework be considered complete.
Post Listing Performance: Consistent Positive Return Coverage Across Short Term and 7 Day Windows
The quality of a platform’s listing performance cannot be evaluated solely by whether it secures projects, but also by whether those projects demonstrate stable performance after listing. A key characteristic of Gate in Q1 is that newly listed projects exhibited relatively consistent time series behavior across multiple holding periods, with overall positive return coverage remaining relatively stable.
Figure 1: Share of Gate New Listings With Price Increases Across Timeframes (5m–7d)
From the perspective of the share of price increases, among newly listed projects in Q1, 58.3% rose within the first 5 minutes after listing, 54.1% maintained gains at the 1 hour interval, 56.8% still recorded positive returns after 24 hours, 54.1% were up after 3 days, and 50.0% remained in an upward trend after 7 days. The data shows that the positive return coverage of Gate’s listed projects remained relatively stable across multiple holding periods.
Many new projects are driven by early speculative capital, short term sentiment, and traffic momentum at the opening stage, often leading to rapid initial price surges. However, if the project lacks fundamental support or if the platform’s liquidity absorption is insufficient, such gains tend to fade quickly, resulting in significantly weaker performance after 24 hours.
This is not the case for Gate’s Q1 sample. Across 5 minutes, 1 hour, 24 hours, and 3 days, the share of projects with price increases consistently remains above 50%, indicating that most listed projects did not exhibit a typical pattern of opening high and trending downward during the core price discovery window.
The 24 hour and 3 day intervals are particularly meaningful as reference points. Most participants in new listings are not ultra short term traders, and many operate on intraday, overnight, or short cycle holding strategies.
For these users, the fact that 56.8% of projects are up after 24 hours and 54.1% are up after 3 days reflects a more realistic trading experience. It indicates that positive return opportunities for Gate’s new listings are not limited to the initial opening phase, but show a degree of continuity during the key post listing holding window.
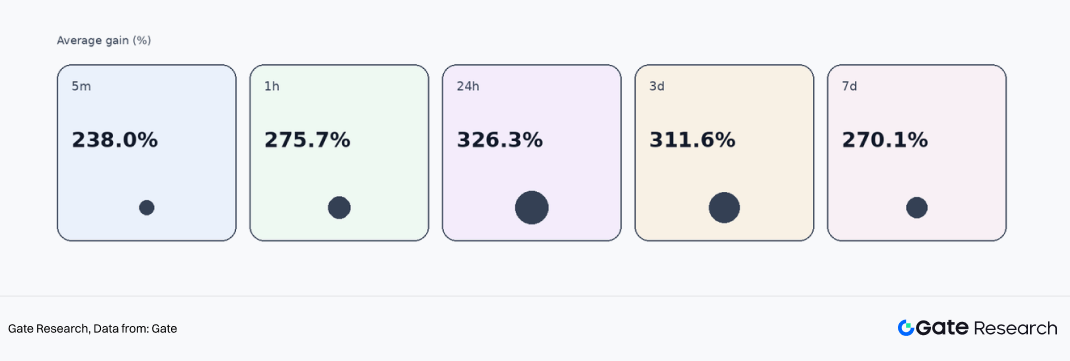
Further examining the average gains of projects that recorded price increases provides a clearer view of return elasticity. In Q1, the average gains for rising projects across the 5 minute, 1 hour, 24 hour, 3 day, and 7 day intervals were 238.0%, 275.7%, 326.3%, 311.6%, and 270.1%, respectively.
This indicates that once high quality new listings on Gate establish early positive momentum, the potential for price expansion remains substantial. Notably, during the 24 hour and 3 day windows, average gains remain around 300%, suggesting that the wealth effect of high quality projects has not disappeared in a weak market, but is instead more concentrated in a subset of carefully selected assets.
Figure 2: Average Gains of Rising Gate New Listings Across Timeframes (5m–7d)
Of course, looking at average gains alone does not provide a complete picture, as averages are easily influenced by extreme outliers, which can obscure the typical performance of most projects. Therefore, the median is particularly important in this context.
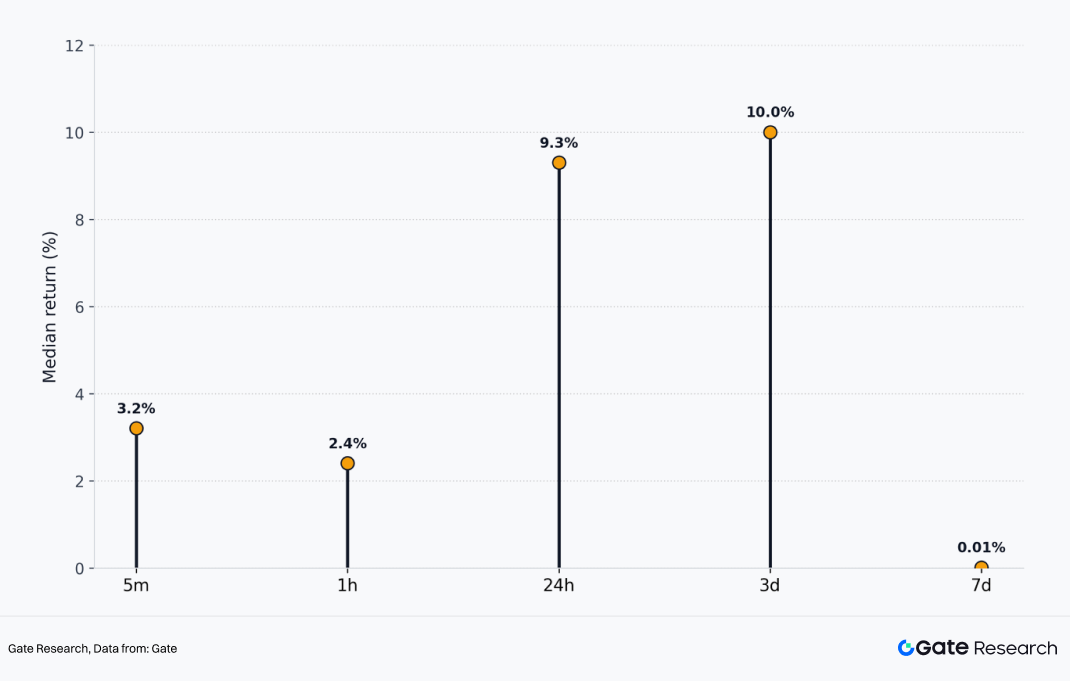
The median gains of newly listed projects in Q1 were +3.2% at 5 minutes, +2.4% at 1 hour, +9.3% at 24 hours, +10.0% at 3 days, and +0.01% at 7 days. Even when excluding the impact of extreme high multiple projects, the typical project performance within the sample still shows clearly positive returns at the 24 hour and 3 day stages.
This indicates that the overall performance of Gate’s spot listings during the quarter was not driven solely by a small number of outliers lifting the average, but rather that most projects maintained a certain level of positive return potential during the core post listing observation window.
Figure 3: Median Price Increase of Gate New Listings Across Timeframes (5m–7d)
For general users, what truly determines the participation experience is not whether there are one or two projects with extremely high returns, but whether the overall quality of new listings on the platform is consistent and whether it demonstrates a certain level of repeatability.
Based on the median data, Gate provided a clear answer in Q1, at least within the 24 hour to 3 day window: its spot listings exhibited strong consistency and a certain level of positive expected returns.
At the same time, the near flat median at 7 days also reflects another fact. The advantage of new listings is primarily concentrated in the early stage of post listing price discovery rather than extending indefinitely.
After 7 days, the market enters a more advanced phase of differentiation and elimination, where disparities between projects expand rapidly. Therefore, for users, not all new listings are suitable for long term holding; instead, within the first 24 hours to 3 day window after listing, the market presents a clearer and more stable density of return opportunities.
First Listings and Non-First Listings: A Dual Track Structure
When discussing a platform’s listing capability, many tend to focus entirely on first listings. While first listings are important, a platform with a truly mature listing system demonstrates its strength not only through first listings, but through the ability of different types of projects to form their own clear return logic. Based on Q1 data, this characteristic is particularly evident for Gate.
First Listings: Dominant in Quantity with Stronger Return Elasticity
In Q1, Gate recorded 27 first listings, accounting for 73% of all new listings. First listings formed the core of Gate’s listing structure in Q1, meaning that in most cases, the platform directly participated in the initial stage when projects entered the secondary market.
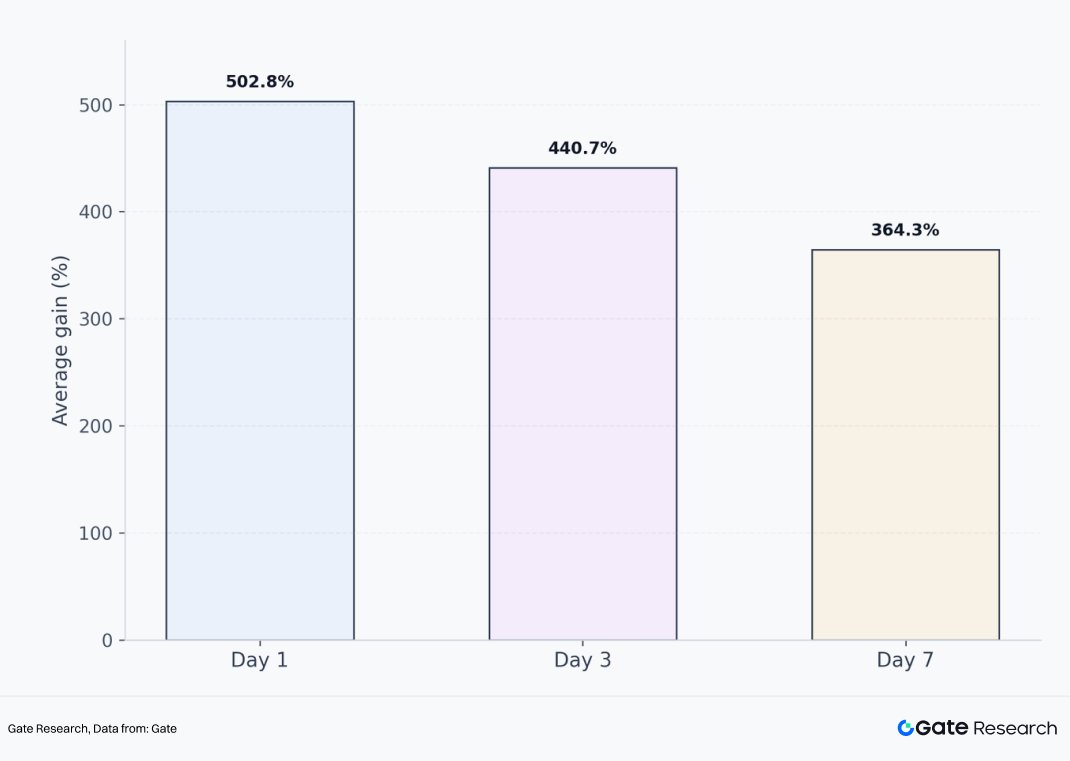
In terms of performance, the most notable characteristic of first listings is their strong return elasticity. Data shows that nearly 46% of first listed projects remained in an upward trend after 7 days; among the projects that increased in price, the average gains reached 502.8%, 440.7%, and 364.3% on the first day, 3 day, and 7 day intervals, respectively.
This indicates that the core advantage of Gate’s first listings lies not only in early access, but in their ability to build market momentum starting from Gate, often resulting in stronger price expansion potential.
Figure 4: Average Returns of Rising Gate Listings Across Holding Periods (1d, 3d, 7d)
From the perspective of extreme return distribution, this high elasticity is further validated. Among first listings in Q1, 7.4% of projects recorded gains exceeding 500% and even 1,000% within 24 hours. This indicates that within Gate’s listing system, the first listing segment serves as an entry point for high payoff opportunities.
Not every project is guaranteed to surge, but once a selected first listing aligns with market attention, narrative strength, and traffic momentum, the resulting price response is often more pronounced.
The underlying logic is straightforward. First listings occur at the earliest stage of public trading, where price discovery is still incomplete, market understanding is rapidly forming, and capital can concentrate more easily within a short period.
For platforms, the ability to secure high quality projects at this stage determines their capacity to provide users with high payoff, high attention early trading opportunities. For users, first listings offer the potential for earlier participation and higher return elasticity, but also come with greater volatility and faster divergence.
Non-First Listings: Smaller in Number but More Stable in Trend
Compared with first listings, Gate recorded 10 non-first listings in Q1, representing a significantly smaller share. However, in terms of performance, these projects demonstrate more stable median returns.
Figure 5: Win Rate and Median Price Increase of Gate Non-Initial Listings Across Timeframes (5m–7d)
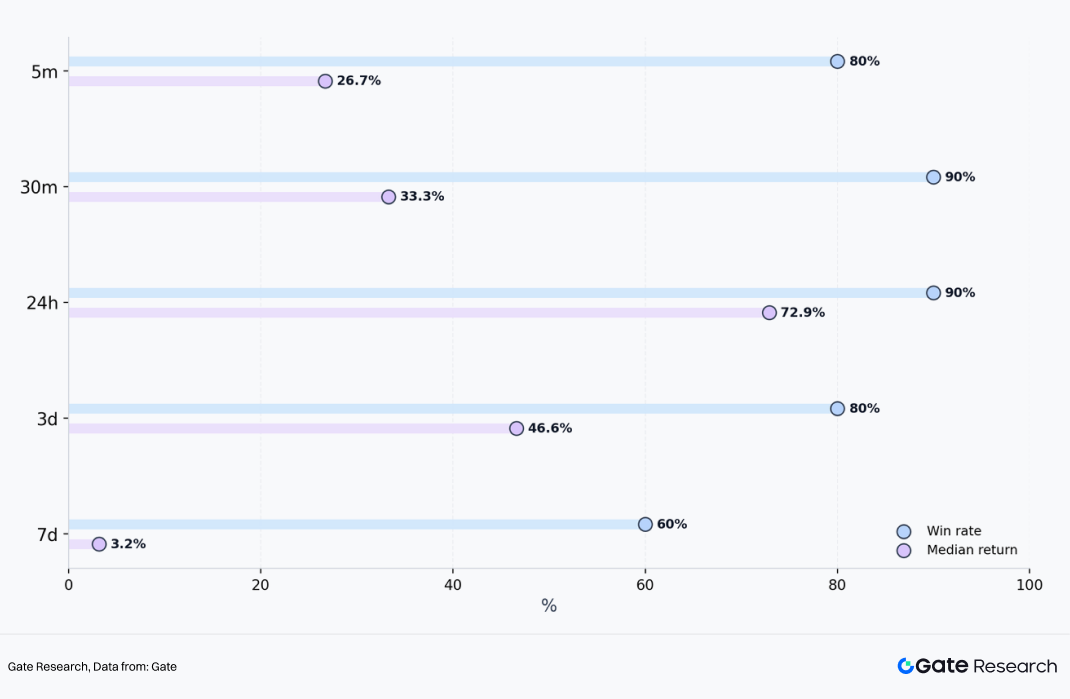
Data shows that non-first listings recorded price increase shares of 80%, 90%, 90%, 80%, and 60% across the 5 minute, 30 minute, 24 hour, 3 day, and 7 day intervals, respectively; the corresponding median gains were +26.7%, +33.3%, +72.9%, +46.6%, and +3.2%. In addition, 40% of non-first listing projects achieved gains exceeding 100% within 24 hours.
The data indicates that although non-first listings do not possess the same initial pricing advantage as first listings, they demonstrate higher success rates of price increases under Gate’s screening mechanism.
This is because non-first listing projects have typically undergone initial market validation, allowing the platform to conduct a second layer of selection based on more comprehensive factors such as price performance, community attention, narrative diffusion, and market absorption conditions, thereby offering greater certainty compared to first listings.
Overall, Gate’s listing structure does not rely solely on first listings to demonstrate its advantage, but instead forms two complementary pathways: first listings provide higher elasticity and stronger wealth effects, while non-first listings deliver more stable median returns.
The former is more aligned with an aggressive approach, while the latter is more aligned with a stable strategy, together enabling the platform to serve different user preferences. From the platform perspective, this dual track structure is more mature than relying solely on first listings.
It shows that Gate is not mechanically pursuing a higher number of first listings, but is also able to continuously provide effective opportunities through the timing and secondary selection of non-first listing projects.
Exclusive Listings: The Segment That Best Reflects Gate’s Proactive Judgment Capability
If first listings reflect a platform’s ability to participate in mainstream high quality supply, exclusive listings reflect a more proactive capability in project selection, resource acquisition, and forward looking judgment. Exclusive listings directly reveal a platform’s project evaluation standards, risk control capability, and execution efficiency.
In Q1, Gate exclusively listed 14 projects, accounting for 37.8% of all new listings. This proportion itself indicates that Gate was not merely passively following the mainstream market listing cycle during the quarter, but instead maintained a differentiated project pipeline to a significant extent. More importantly, these exclusive projects did not underperform after listing; on the contrary, they demonstrated strong competitiveness across multiple key time windows.
Figure 6: Win Rate and Median Price Increase of Gate Exclusive Listings Across Timeframes (24h–7d)
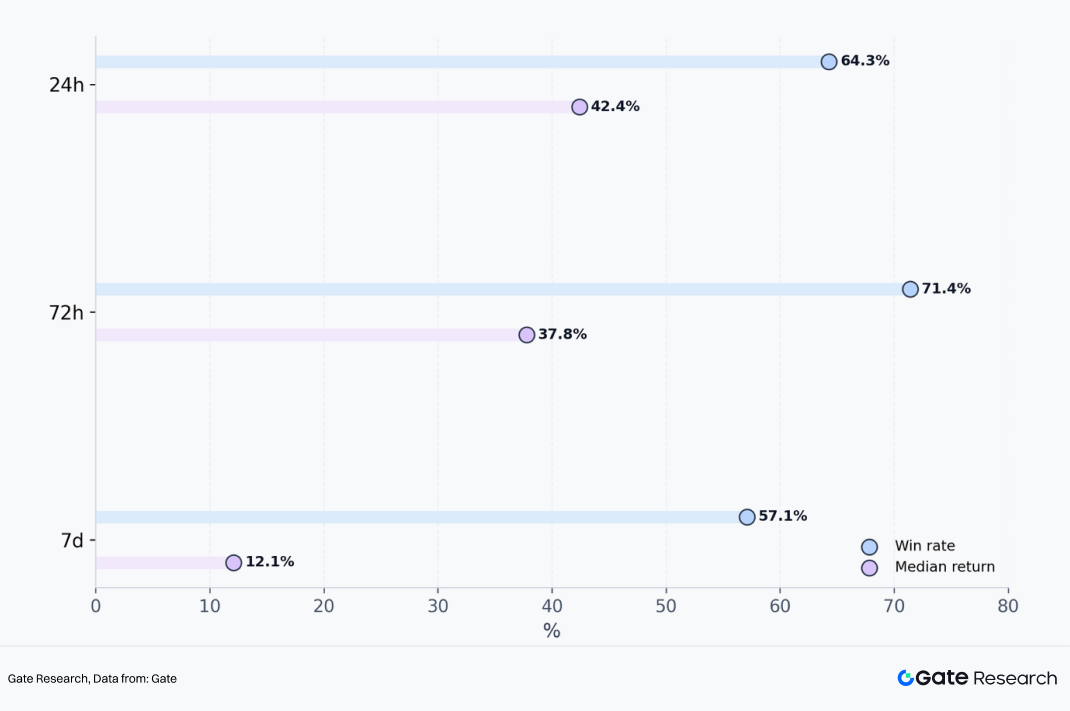
From the perspective of success rate, exclusive listings recorded price increase rates of 64.3%, 71.4%, and 57.1% across the 24 hour, 72 hour, and 7 day intervals, respectively, with the 72 hour window showing the strongest performance. This means that during the period from day 2 to day 3 after listing, Gate’s exclusive projects did not weaken rapidly as initial listing momentum faded, but instead demonstrated clearer capital absorption and upward price momentum.
From the perspective of median returns, exclusive listings achieved +42.4%, +37.8%, and +12.1% across the 24 hour, 72 hour, and 7 day intervals, respectively. This indicates that exclusive projects not only have a relatively high share of price increases, but also deliver median returns that are significantly higher than the overall sample. This suggests that the strong performance of exclusive listings is not driven by a small number of extreme cases, but rather that most projects provide solid return quality within the core observation windows.
Further examining the distribution of extreme returns makes the characteristics of exclusive listings even clearer. From 30 minutes after listing up to 30 days, more than 20% of exclusive projects consistently achieved gains exceeding 100%; during the 3 to 7 day window, the share of projects with gains above 100% reached as high as 35.7%, significantly higher than the 15.4% observed among all first listings; even when extended to a 30 day horizon, 12.5% of exclusive projects still recorded gains exceeding 500% and even 1,000%.
Taken together, these data points indicate that Gate’s exclusive listings do not rely solely on initial scarcity driven momentum at the opening stage, but are able to sustain price discovery and attract consistent buying support across multiple post listing time windows, with a relatively high probability of delivering more pronounced return trajectories.
Case Review
Based on Q1 cases, Gate’s project selection broadly followed three pathways: one category consists of high attention projects where Gate completed early first listings or priority onboarding, followed by validation from other platforms; another category includes exclusive listings on Gate that delivered strong subsequent performance, reflecting the platform’s independent selection capability; the third category consists of narrative driven projects with strong community traction and topic diffusion, demonstrating the platform’s sensitivity to sentiment driven sectors.
Solana Mobile (SKR): Early First Listing Execution on High Attention Projects
Solana Mobile belongs to the DePIN sector, achieving an ATH increase of 2,459% after TGE and a 30 day gain of 715%. As a combination of Solana’s official hardware phone and Web3 applications, Solana Mobile benefits from inherent brand endorsement, a strong community foundation, and significant dissemination advantages. Gate conducted a simultaneous first listing with two other CEXs and went live one day ahead of B*** Alpha to capture market share, indicating that Gate maintained strong responsiveness to globally high attention projects in Q1.
From the SKR listing, it can be seen that Gate is able to enter the key early window for projects with high traffic, strong narratives, and elevated expectations, allowing users to participate before broader market coverage occurs. This capability reflects Gate’s competitive position in accessing mainstream high quality project supply.
CodexField (CODEX): A Representative High Return Exclusive Listing
CodexField belongs to the content creation sector and is one of the most representative exclusive listings on Gate in Q1. It recorded an ATH increase of 4,900% and maintained a gain of 2,566% as of March 25, while B***, B***, and B*** had not yet listed the project.
If exclusive listings best reflect a platform’s proactive selection capability, then CodexField serves as a clear demonstration of Gate’s strength in this area. The project received institutional investment from Gate Labs prior to listing, and Gate provided the initial secondary market pricing venue, ultimately generating a strong wealth effect.
For projects that are not yet widely covered but possess strong growth potential and market imagination, Gate has the ability to establish early positioning and, through its platform liquidity and user base, convert these opportunities into verifiable market outcomes.
Lobster: An Early Positioning Case in AI plus Meme Narratives
The combination of AI and Meme was a high attention yet highly differentiated direction in Q1. Many projects had strong narratives but lacked sustainability, while others demonstrated strong dissemination capability without translating into trading results. Lobster belongs to the AI plus Meme category and was first listed on Gate, achieving an ATH increase of 286% and a 7 day gain of 164%; B*** Alpha followed with a listing the next day after observing Gate’s market signal. This case highlights Gate’s early positioning capability in highly viral narratives, as well as its ability to lead early price discovery.
Overall, these cases show that Gate’s spot listing performance in Q1 was not driven by a single type of project, but rather by a combination of multiple sectors, styles, and narratives. The platform is capable of onboarding high attention mainstream projects while also identifying exclusive growth oriented projects; it covers both technology and product driven projects, as well as community culture and sentiment driven assets. This diversity itself reflects the maturity of Gate’s listing system.
Conclusion
Overall, Gate’s spot listing performance in the first quarter of 2026 can be summarized in one sentence: in a market phase characterized by overall pressure, reduced opportunity density, and intensified project divergence, Gate continued to maintain a relatively high quality pipeline of new listings and convincing post listing performance.
During a period where strong outcomes are not easy to achieve, Gate’s overall sample maintained a relatively high share of price increases across multiple time windows, with median returns at 24 hours and 3 days remaining positive. New listings demonstrated a certain breadth of performance, where first listings provided stronger return elasticity, non-first listings delivered higher success rates, and exclusive listings reflected greater scarcity and stronger mid term performance. The platform’s listing capability is not driven by isolated strengths, but by a systematic and integrated framework.
For users, Gate provides a more complete and structured early stage participation framework. Users seeking higher return elasticity can focus on first listings for higher payoff opportunities; users preferring more stable pathways can look to the higher success rate characteristics of non first listings; users aiming to access differentiated assets before broad market coverage can pay closer attention to Gate’s exclusive listing segment. For project teams, Q1 data also demonstrates that Gate possesses strong capabilities in initial trading support, liquidity organization, and price discovery.
From a longer term perspective, the core competition in spot listing capability among exchanges ultimately lies in whether they can consistently maintain strong project sourcing, selection, and outcome realization across different market cycles. Gate’s Q1 data clearly demonstrates this point: even in a weak market, Gate is able to list accurately, select with stability, and deliver tangible results.
Gate Research is a comprehensive blockchain and cryptocurrency research platform that provides deep content for readers, including technical analysis, market insights, industry research, trend forecasting, and macroeconomic policy analysis.
Disclaimer: Investing in cryptocurrency markets involves high risk. Users are advised to conduct their own research and fully understand the nature of the assets and products before making any investment decisions. Gate is not responsible for any losses or damages arising from such decisions.
The post Gate 2026 Q1 Spot Listing Key Stats: 35.7% of Exclusive Listings Gained 100%+ in One Week appeared first on BeInCrypto.