
Ethereum’s rally in early August drove the largest altcoin to a cycle peak of $4,793 by August 14, marking one of its strongest performances of the year.
However, the sharp rise also triggered a wave of profit-taking, which has since put significant pressure on the asset and caused it to lose much of its recent gains. With selloffs intensifying in the derivatives market, ETH now faces the risk of a breakdown below the $4,000 price mark.
ETH Faces Heavy Sell Pressure
ETH’s price has been weighed down by the bearish tilt in sentiment among its derivatives traders. This is reflected by its taker-buy/sell ratio, which has mostly remained under one since the beginning of August.
At press time, this stands at 0.92 per CryptoQuant, indicating that sell orders dominate buy orders across the ETH futures market.
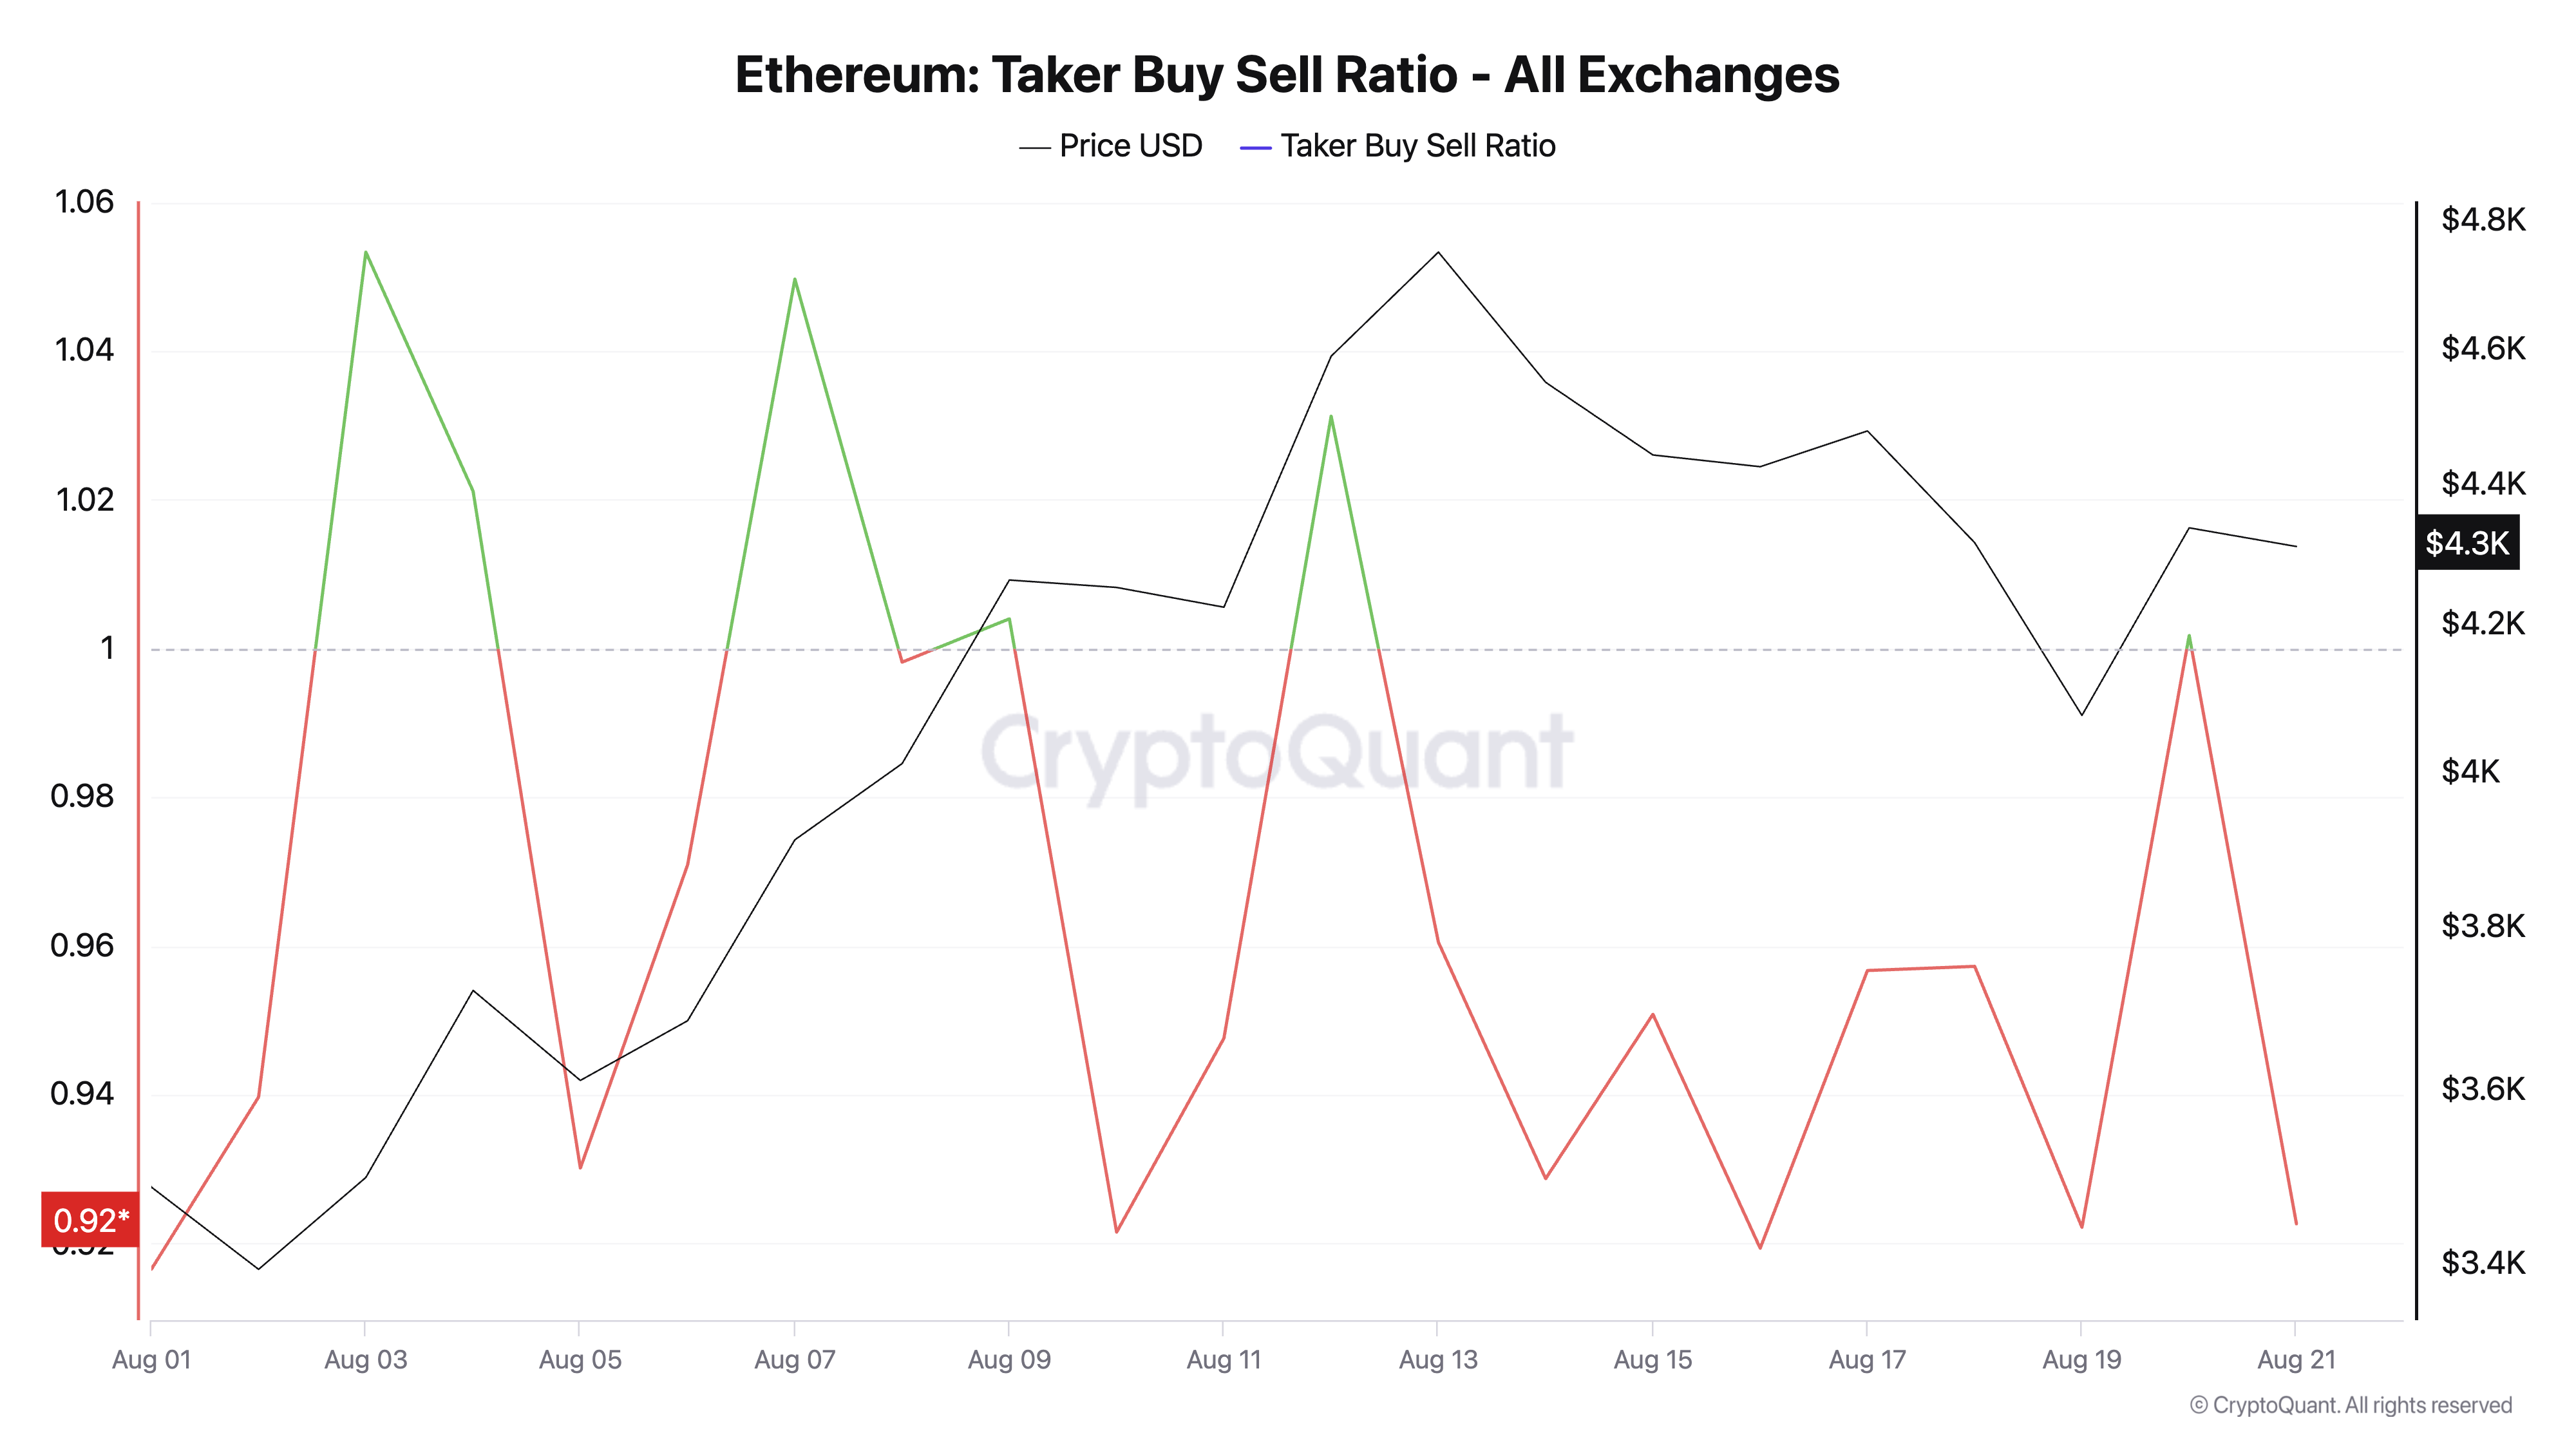
The taker buy-sell ratio measures the balance between buy and sell orders in an asset’s futures market. A ratio above one indicates stronger buying pressure, showing traders are actively chasing price gains. On the other hand, a value below one reflects dominant selling pressure, often linked to profit-taking or bearish sentiment.
Since August began, ETH’s taker buy/sell ratio has stayed mostly below one, confirming persistent sell-offs among futures traders.
For context, the coin’s performance had been largely muted for much of the year, so when an uptrend finally began in July and extended into early August, many traders seized the opportunity to lock in profits.
This mounting sell-side pressure confirms the weakening bullish sentiment and could worsen ETH’s price fall if it continues.
Traders Ditch High-Risk Bets Amid Price Pressure
The recent decline in ETH’s Estimated Leverage Ratio (ELR) also confirms the low confidence among coin holders. According to CryptoQuant, ETH’s ELR currently sits at 0.66 — its lowest value in the past five days.
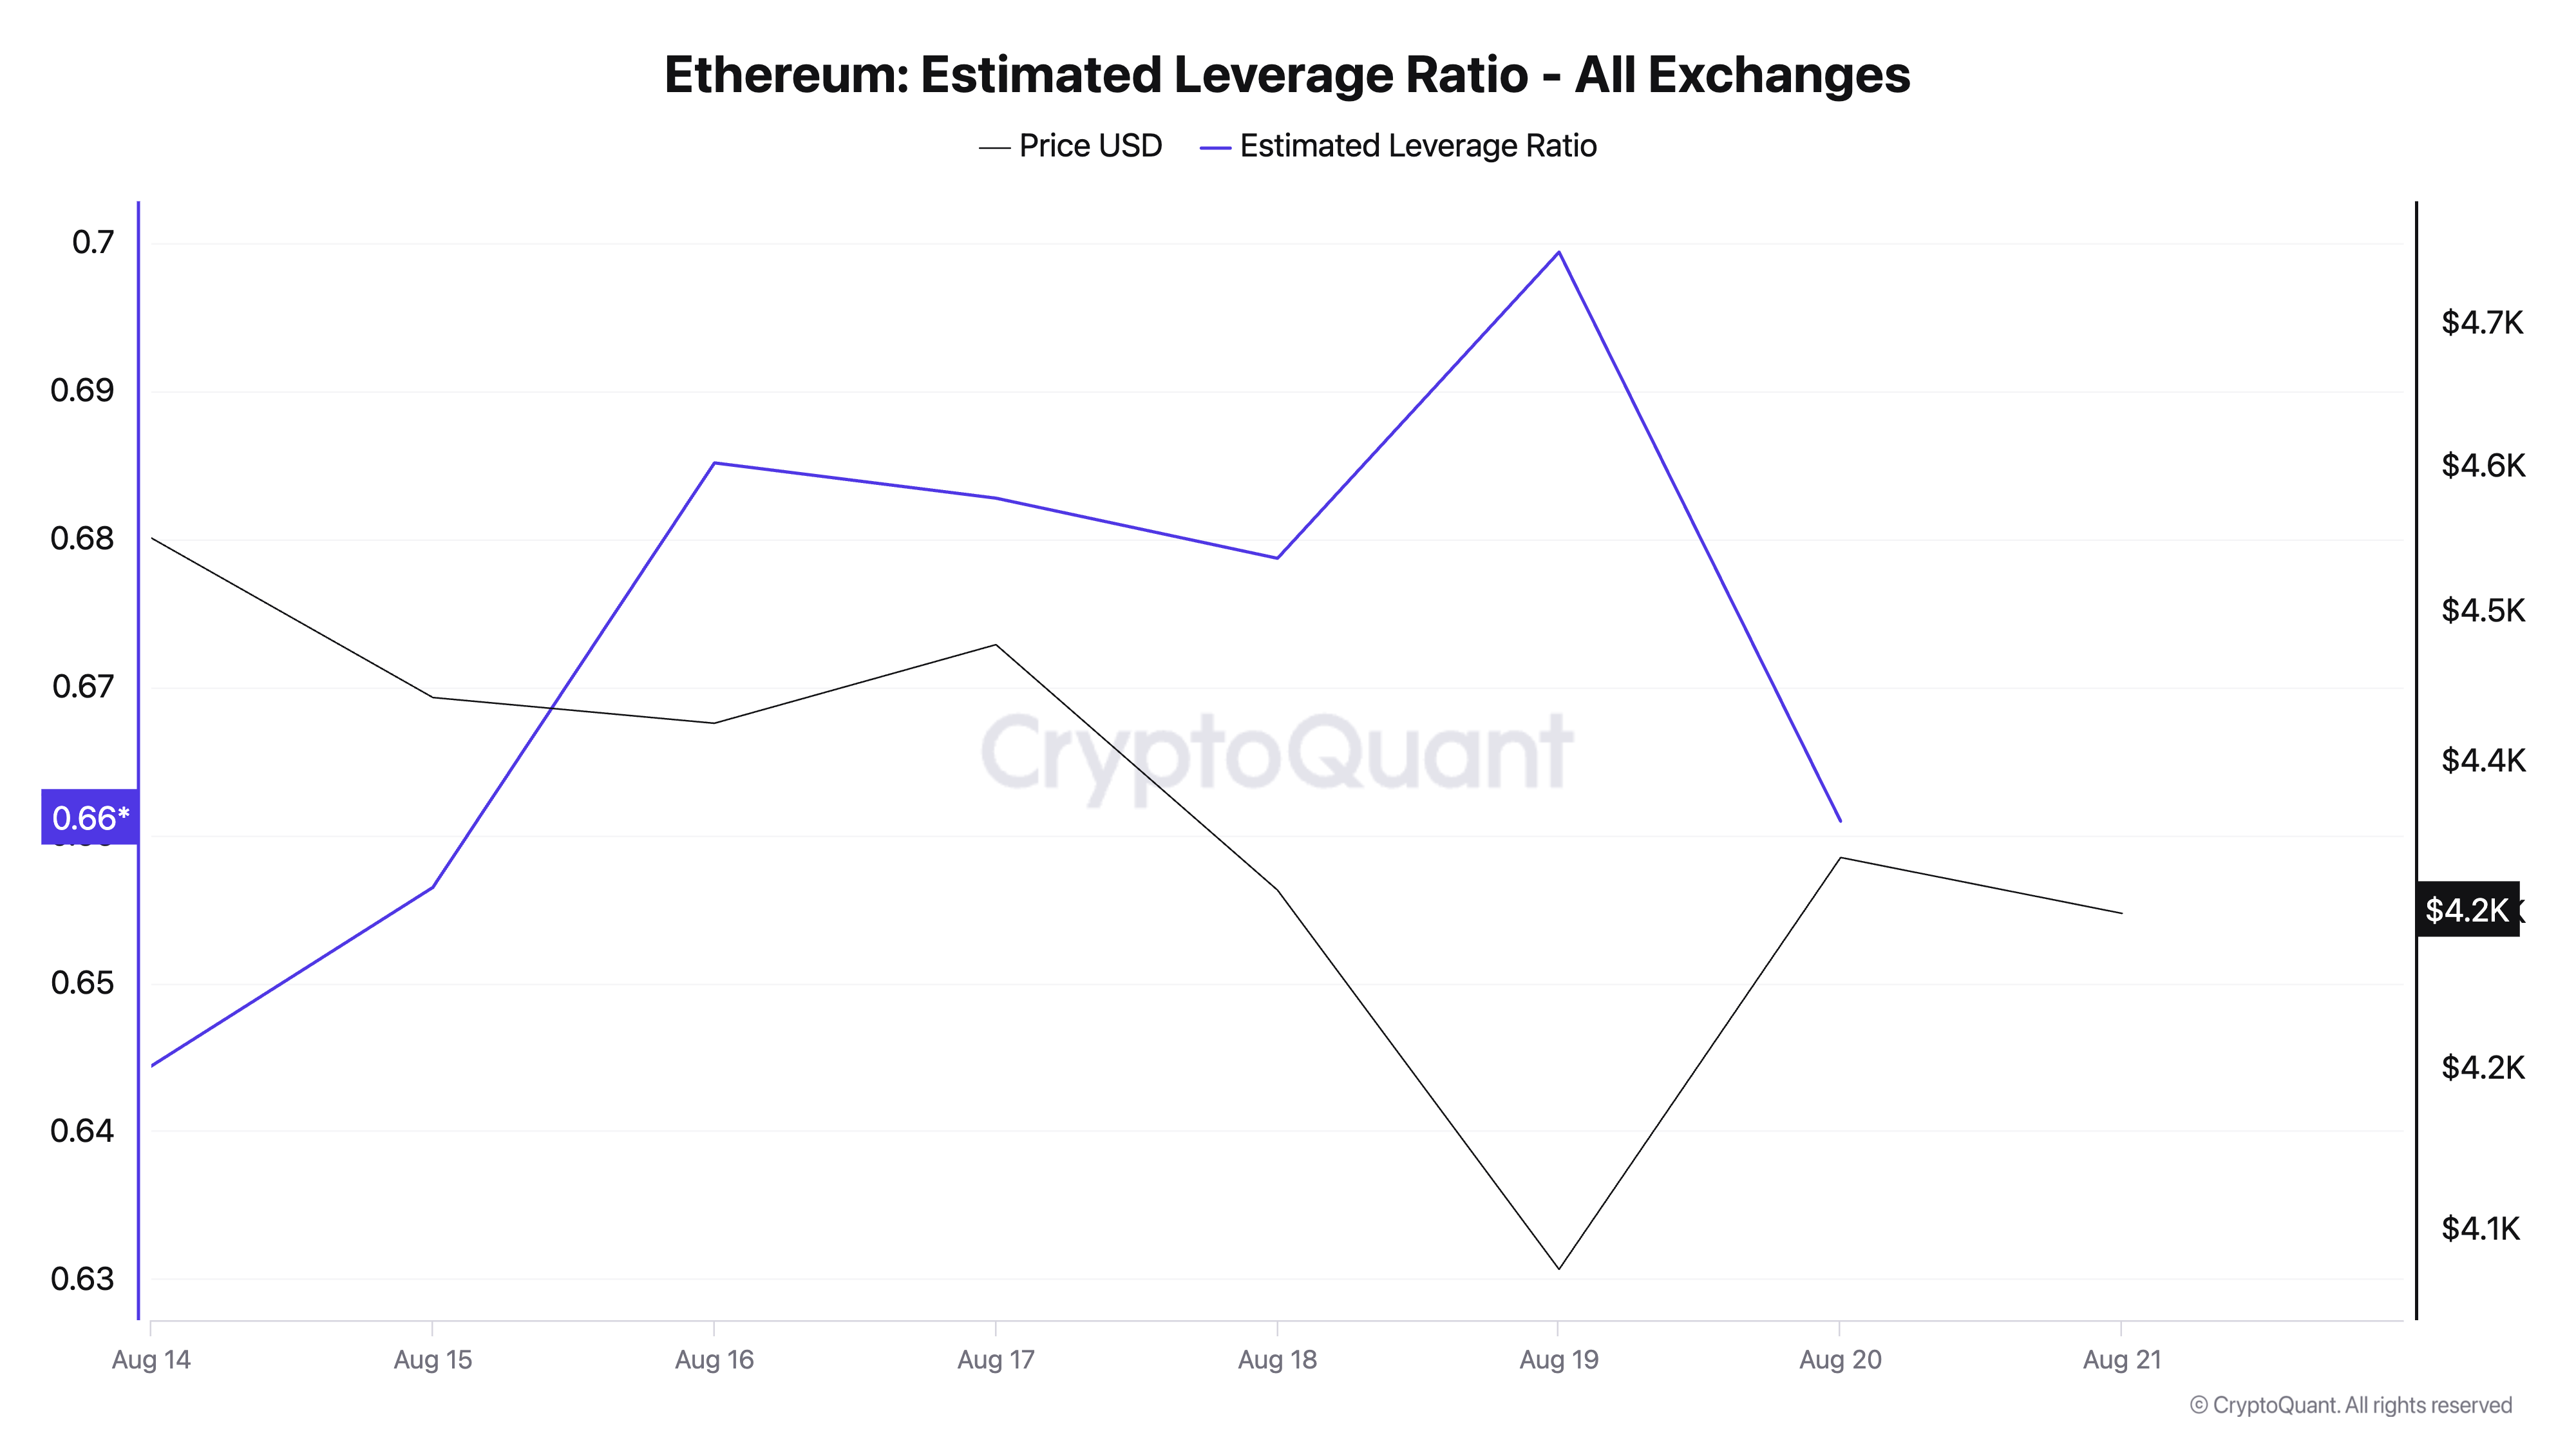
An asset’s ELR measures the average leverage its traders use to execute trades on a cryptocurrency exchange. It is calculated by dividing the asset’s open interest by the exchange’s reserve for that currency.
When an asset’s ELR falls, it indicates a reduced risk appetite among traders. This trend signals that ETH investors have grown increasingly cautious this week and are now avoiding high-leverage positions that could worsen potential losses.
Which Comes First: $3,491 or $4,793?
As of this writing, ETH trades at $4,295. If sell-side pressure strengthens, the altcoin could retest the support floor at $4,063. Should this key price mark give way, ETH could plunge to $3,491.
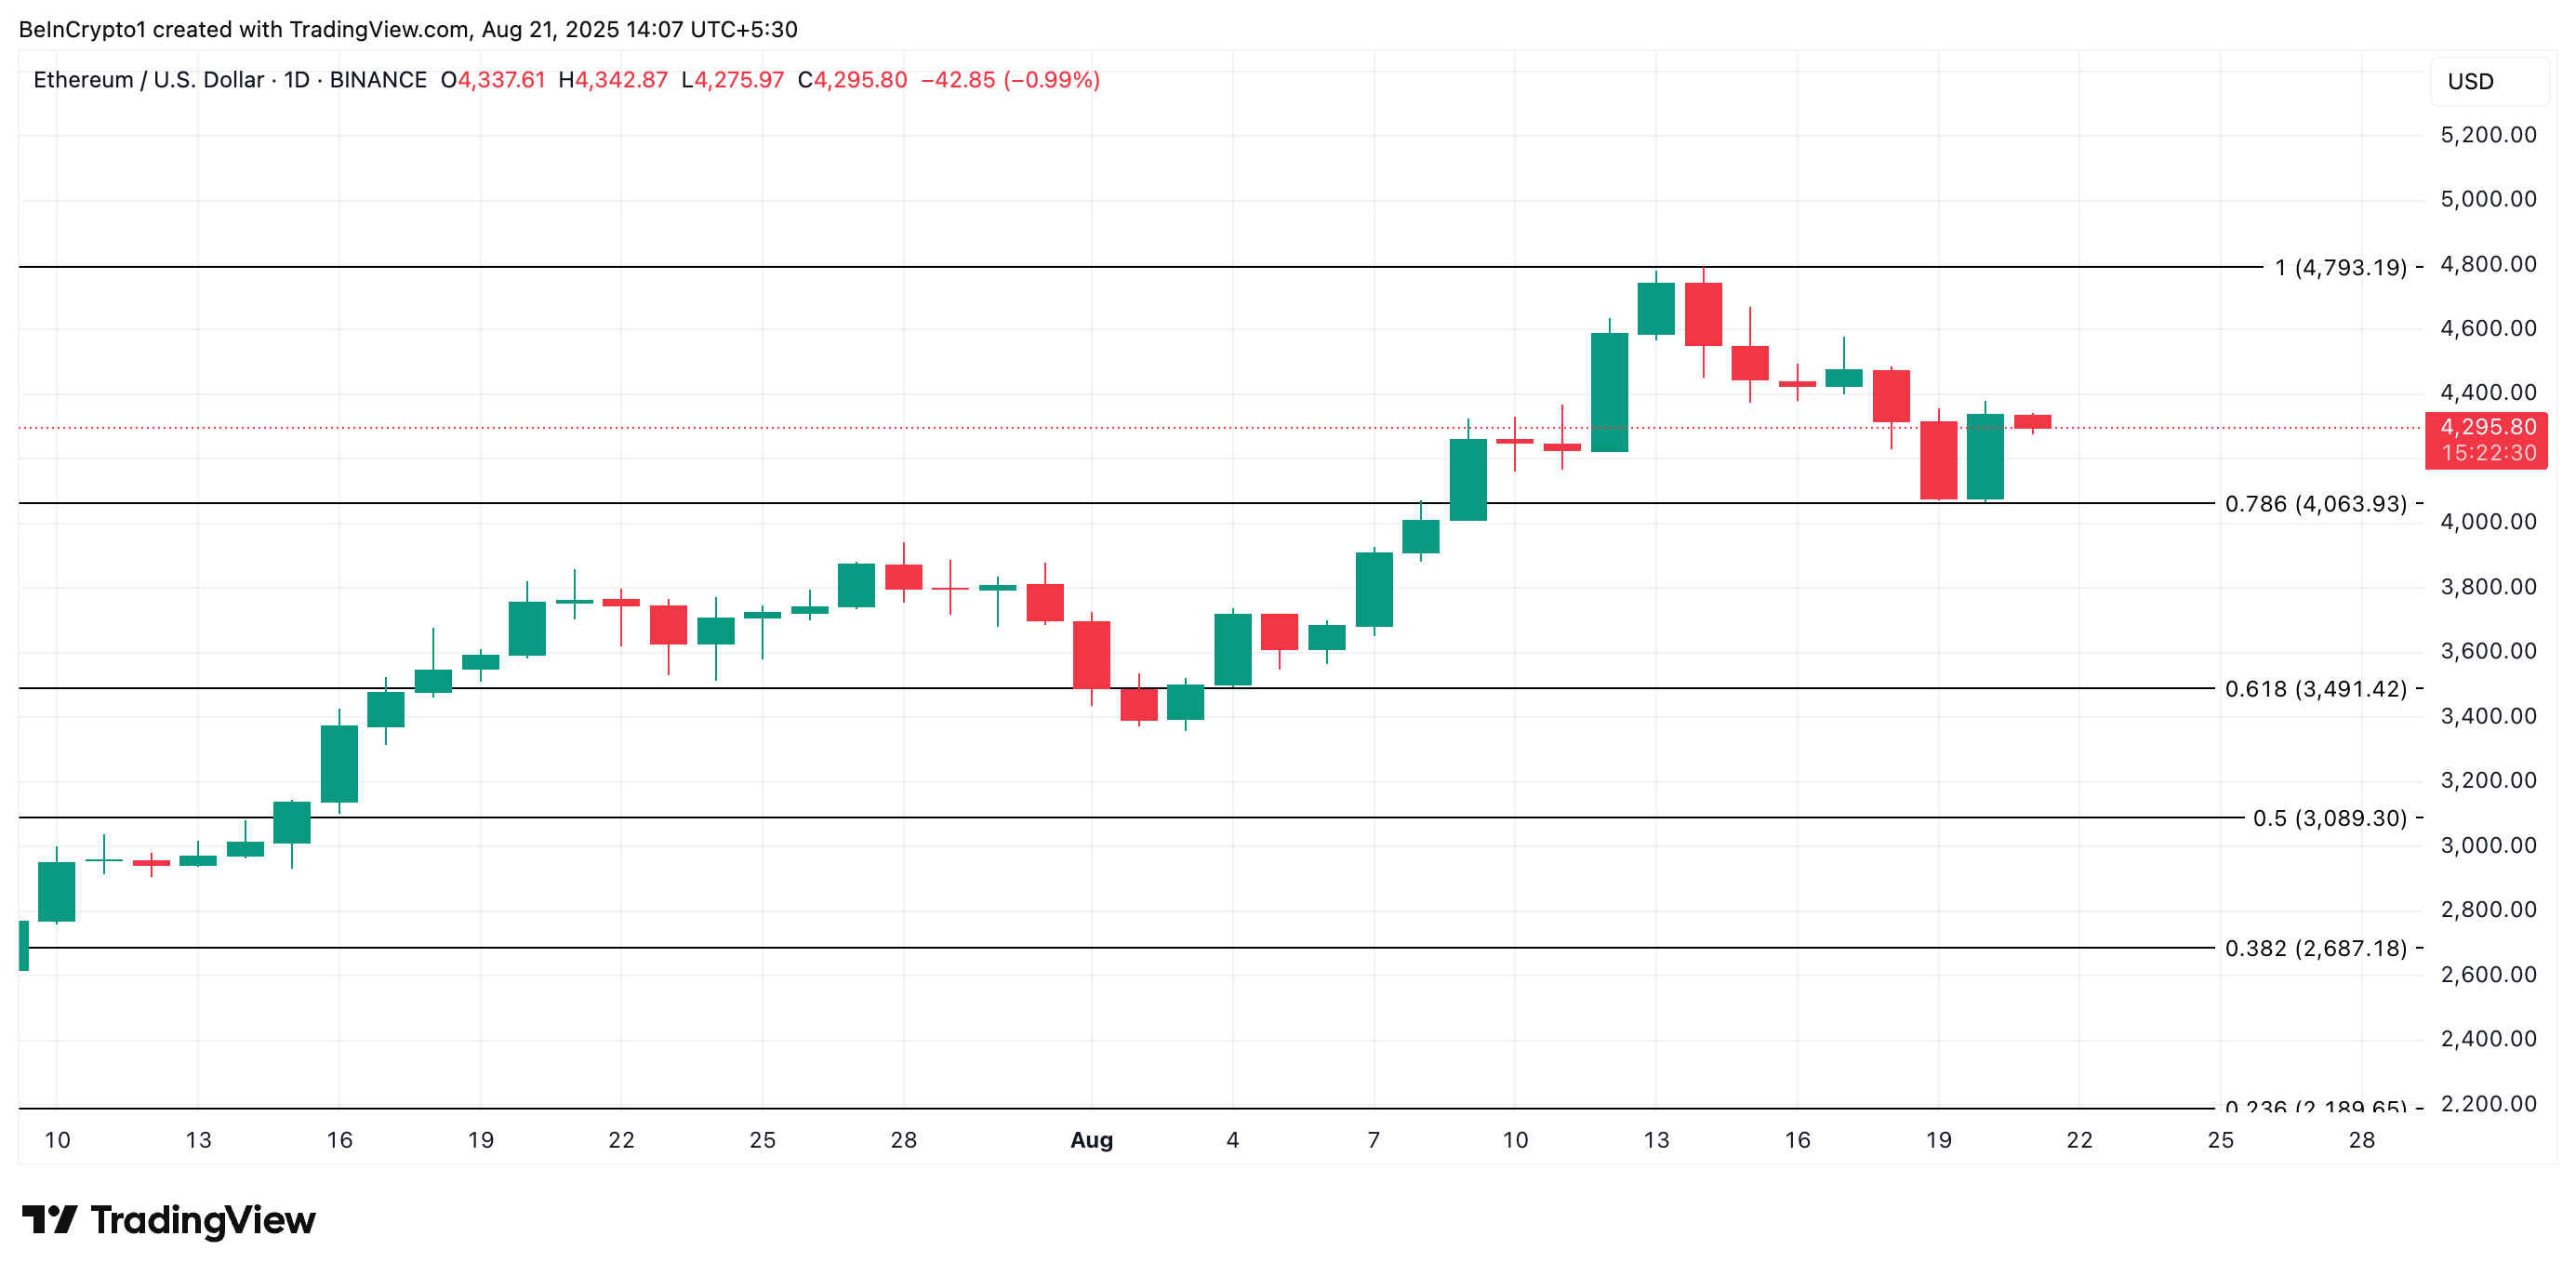
Conversely, ETH could see a rebound and rally to $4,793 if new demand enters the market.
The post Ethereum’s Early August Surge Meets Reality Check as Bears Eye Dip Below $4,000 appeared first on BeInCrypto.