
Ethereum price is rising again, up over 2% in the past 24 hours, and is still positive for the month. The rebound looks encouraging, but the structure underneath remains fragile.
A bearish pattern is still active, and unless key levels are defended, this bounce risks turning into a deeper pullback.
Ethereum Price Rises Inside a Fragile Bearish Structure
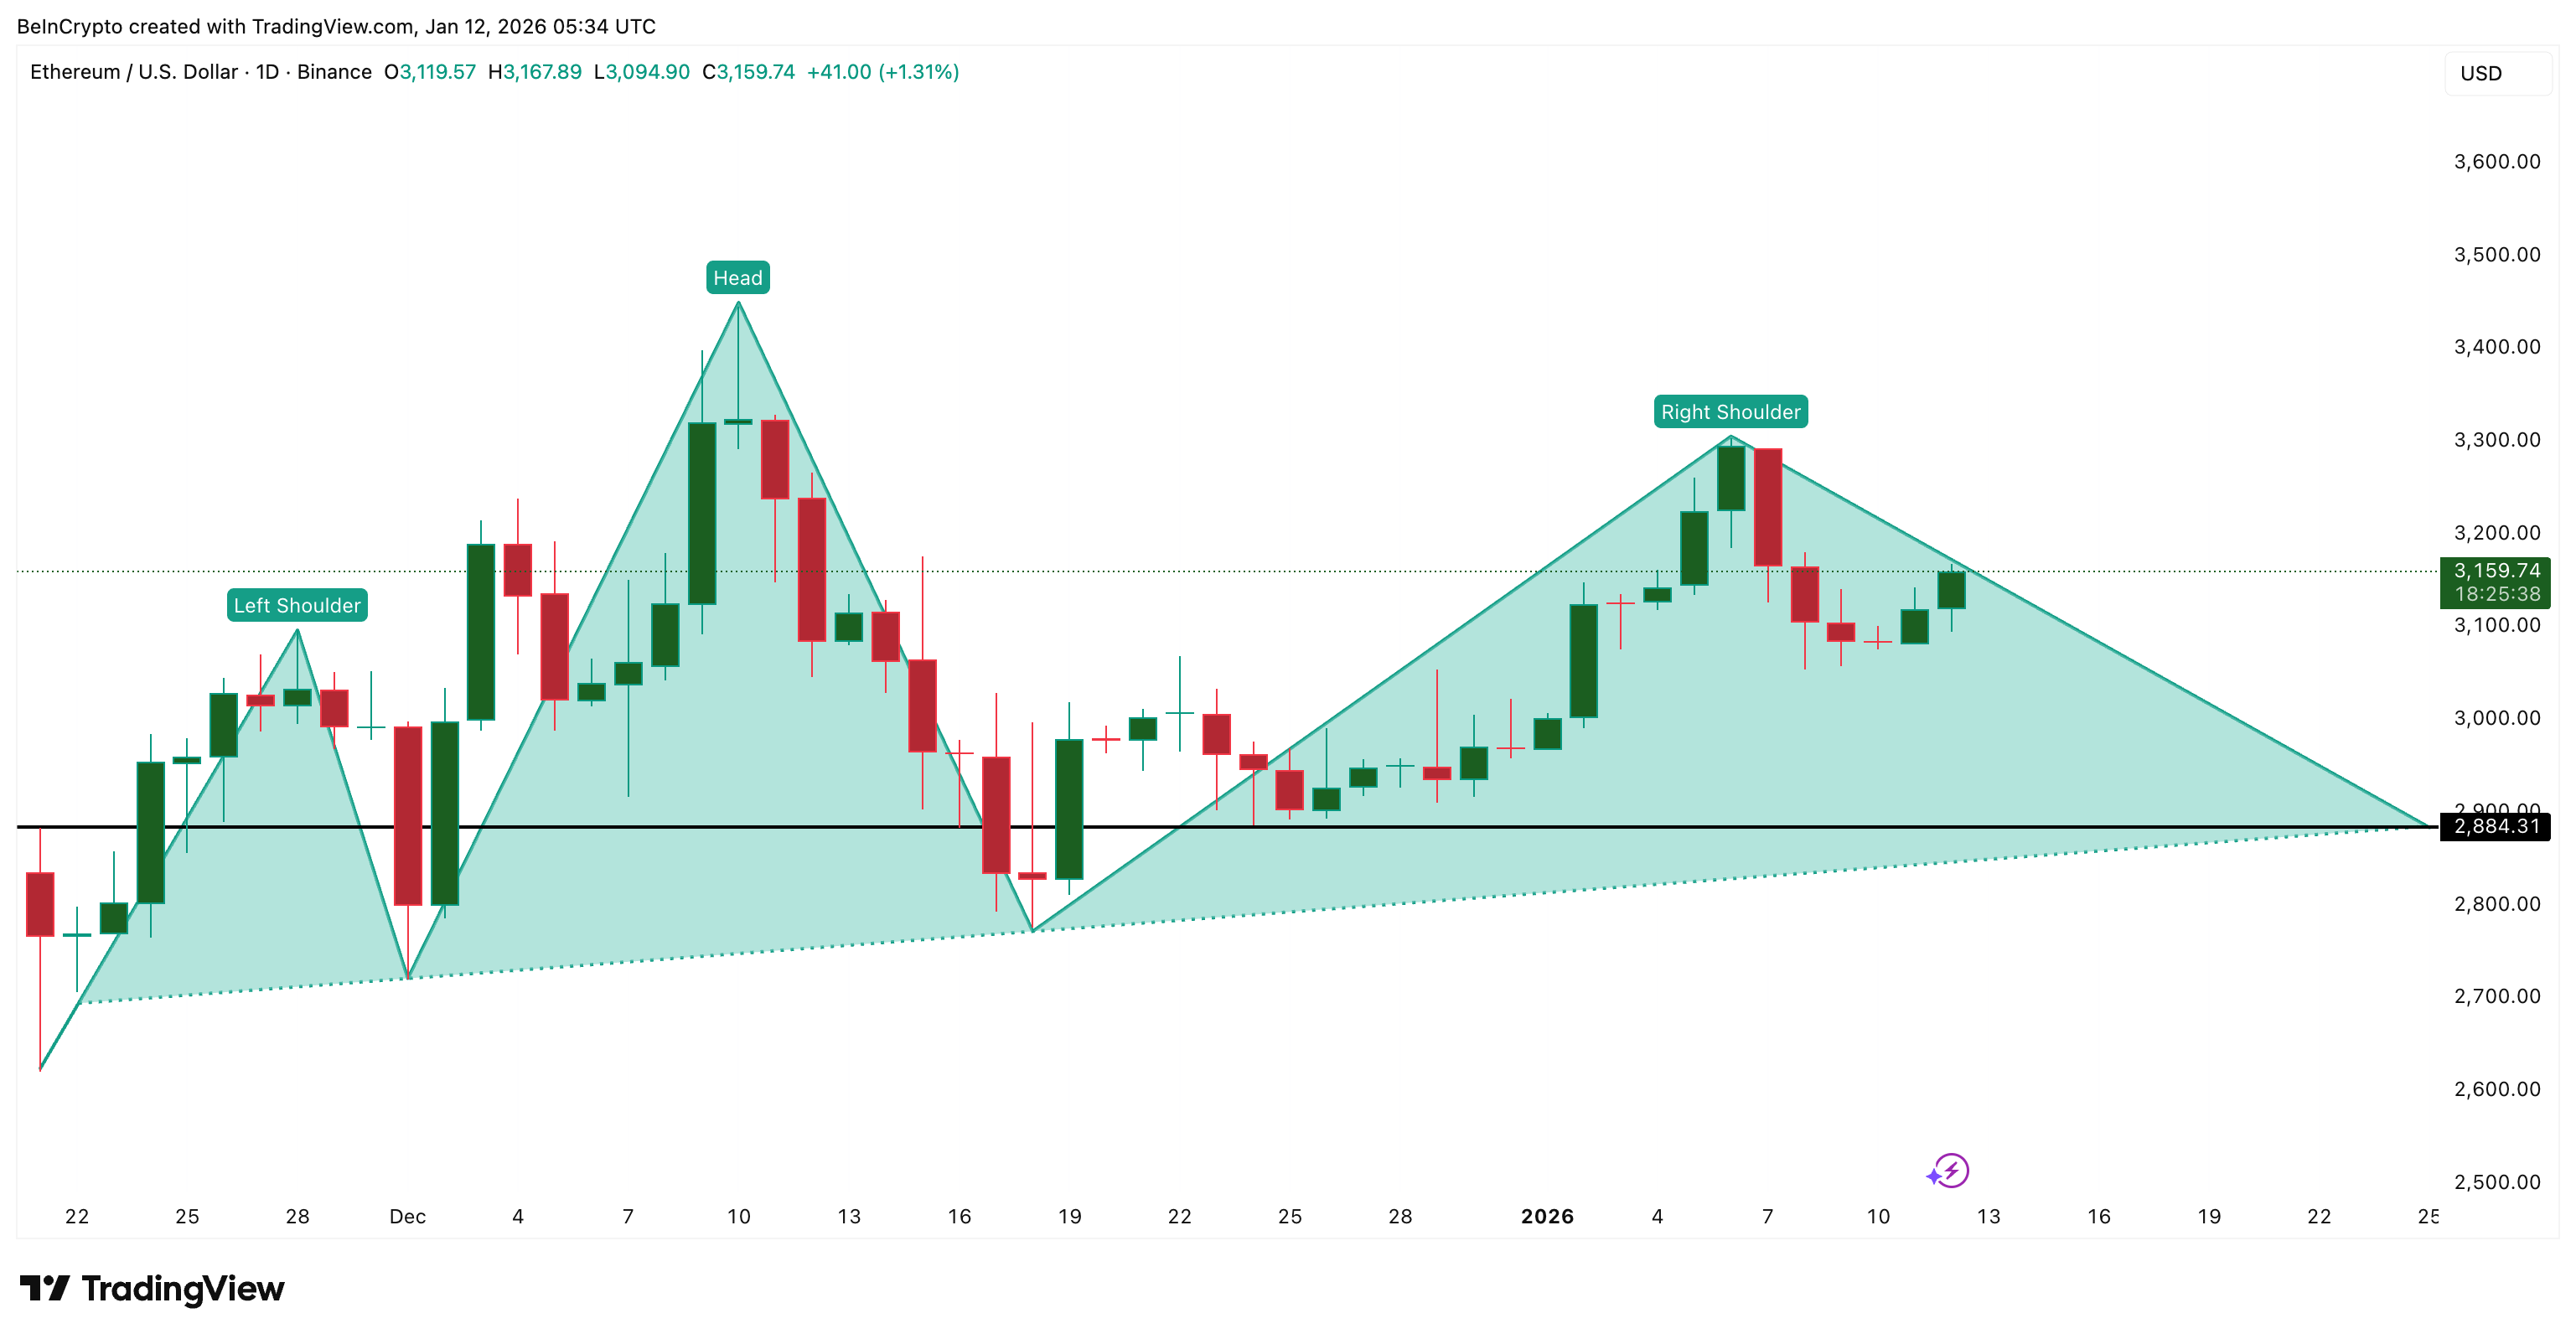
Despite the bounce, Ethereum is still trading inside a head and shoulders pattern on the daily chart. The January 6 peak formed the right shoulder, and the price is now attempting to stabilize without invalidating the structure.
This is important because head-and-shoulders patterns often fail gradually rather than immediately. Rallies can happen inside them, but they only become safe once the price decisively moves away from the neckline risk zone, around $2,880 in ETH’s case.
Want more token insights like this? Sign up for Editor Harsh Notariya’s Daily Crypto Newsletter here.
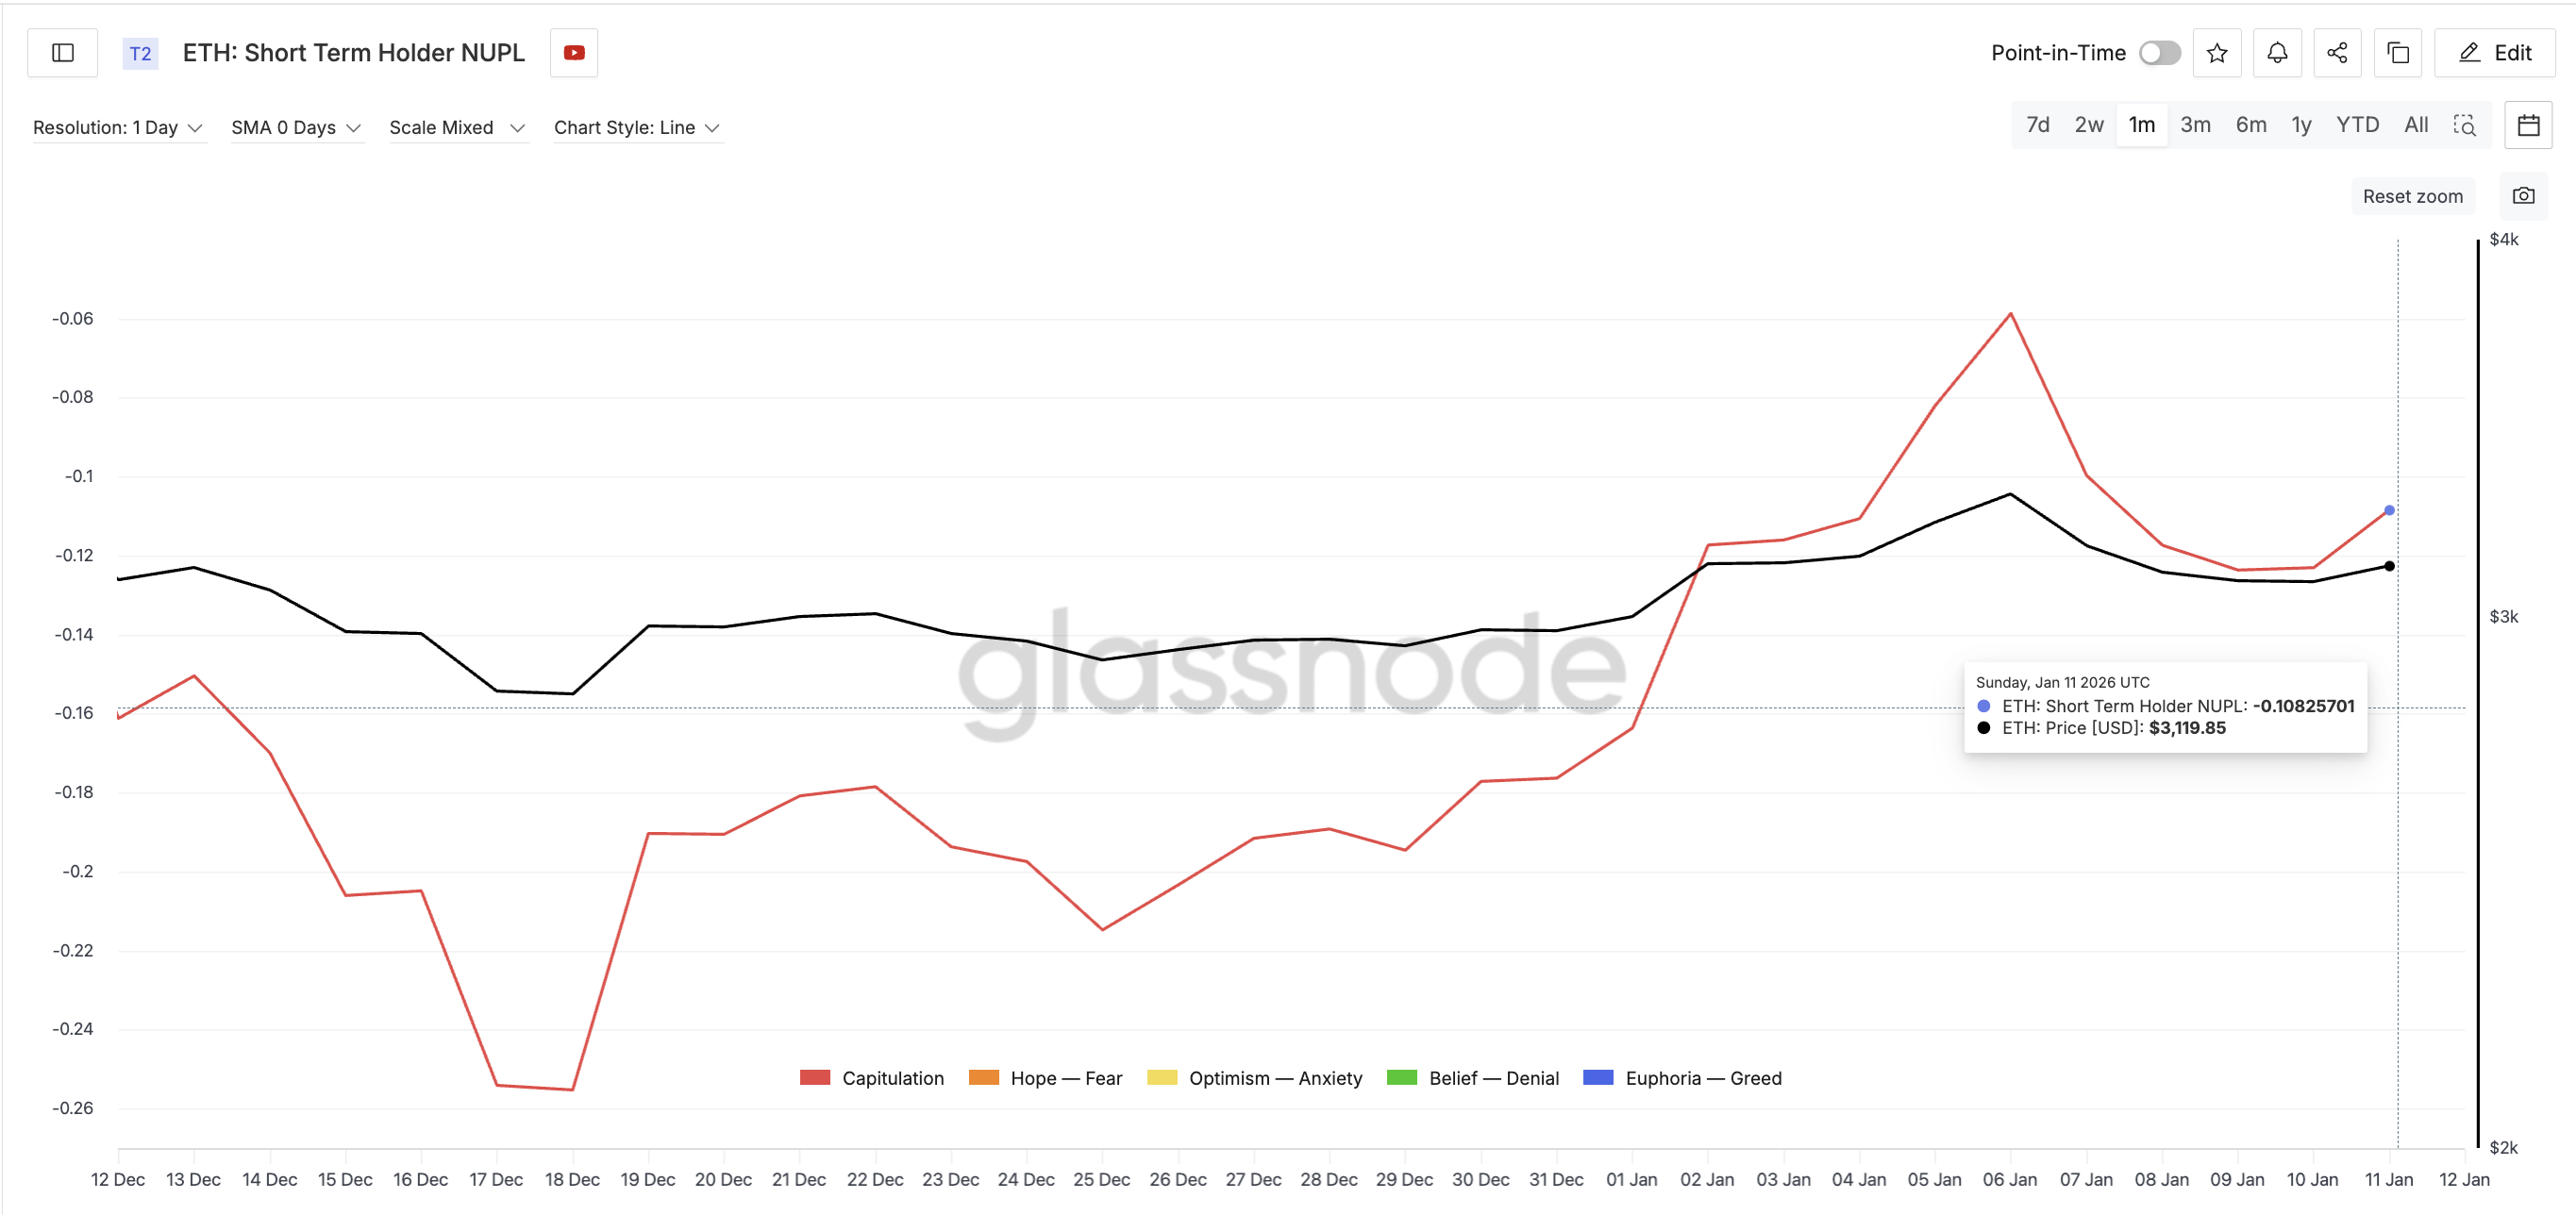
Short-term holder behavior adds caution. Short-term holder NUPL, which tracks paper profits/losses, remains in the capitulation zone but is rising toward monthly highs. It increases the chance of profit-taking if the price pushes higher.
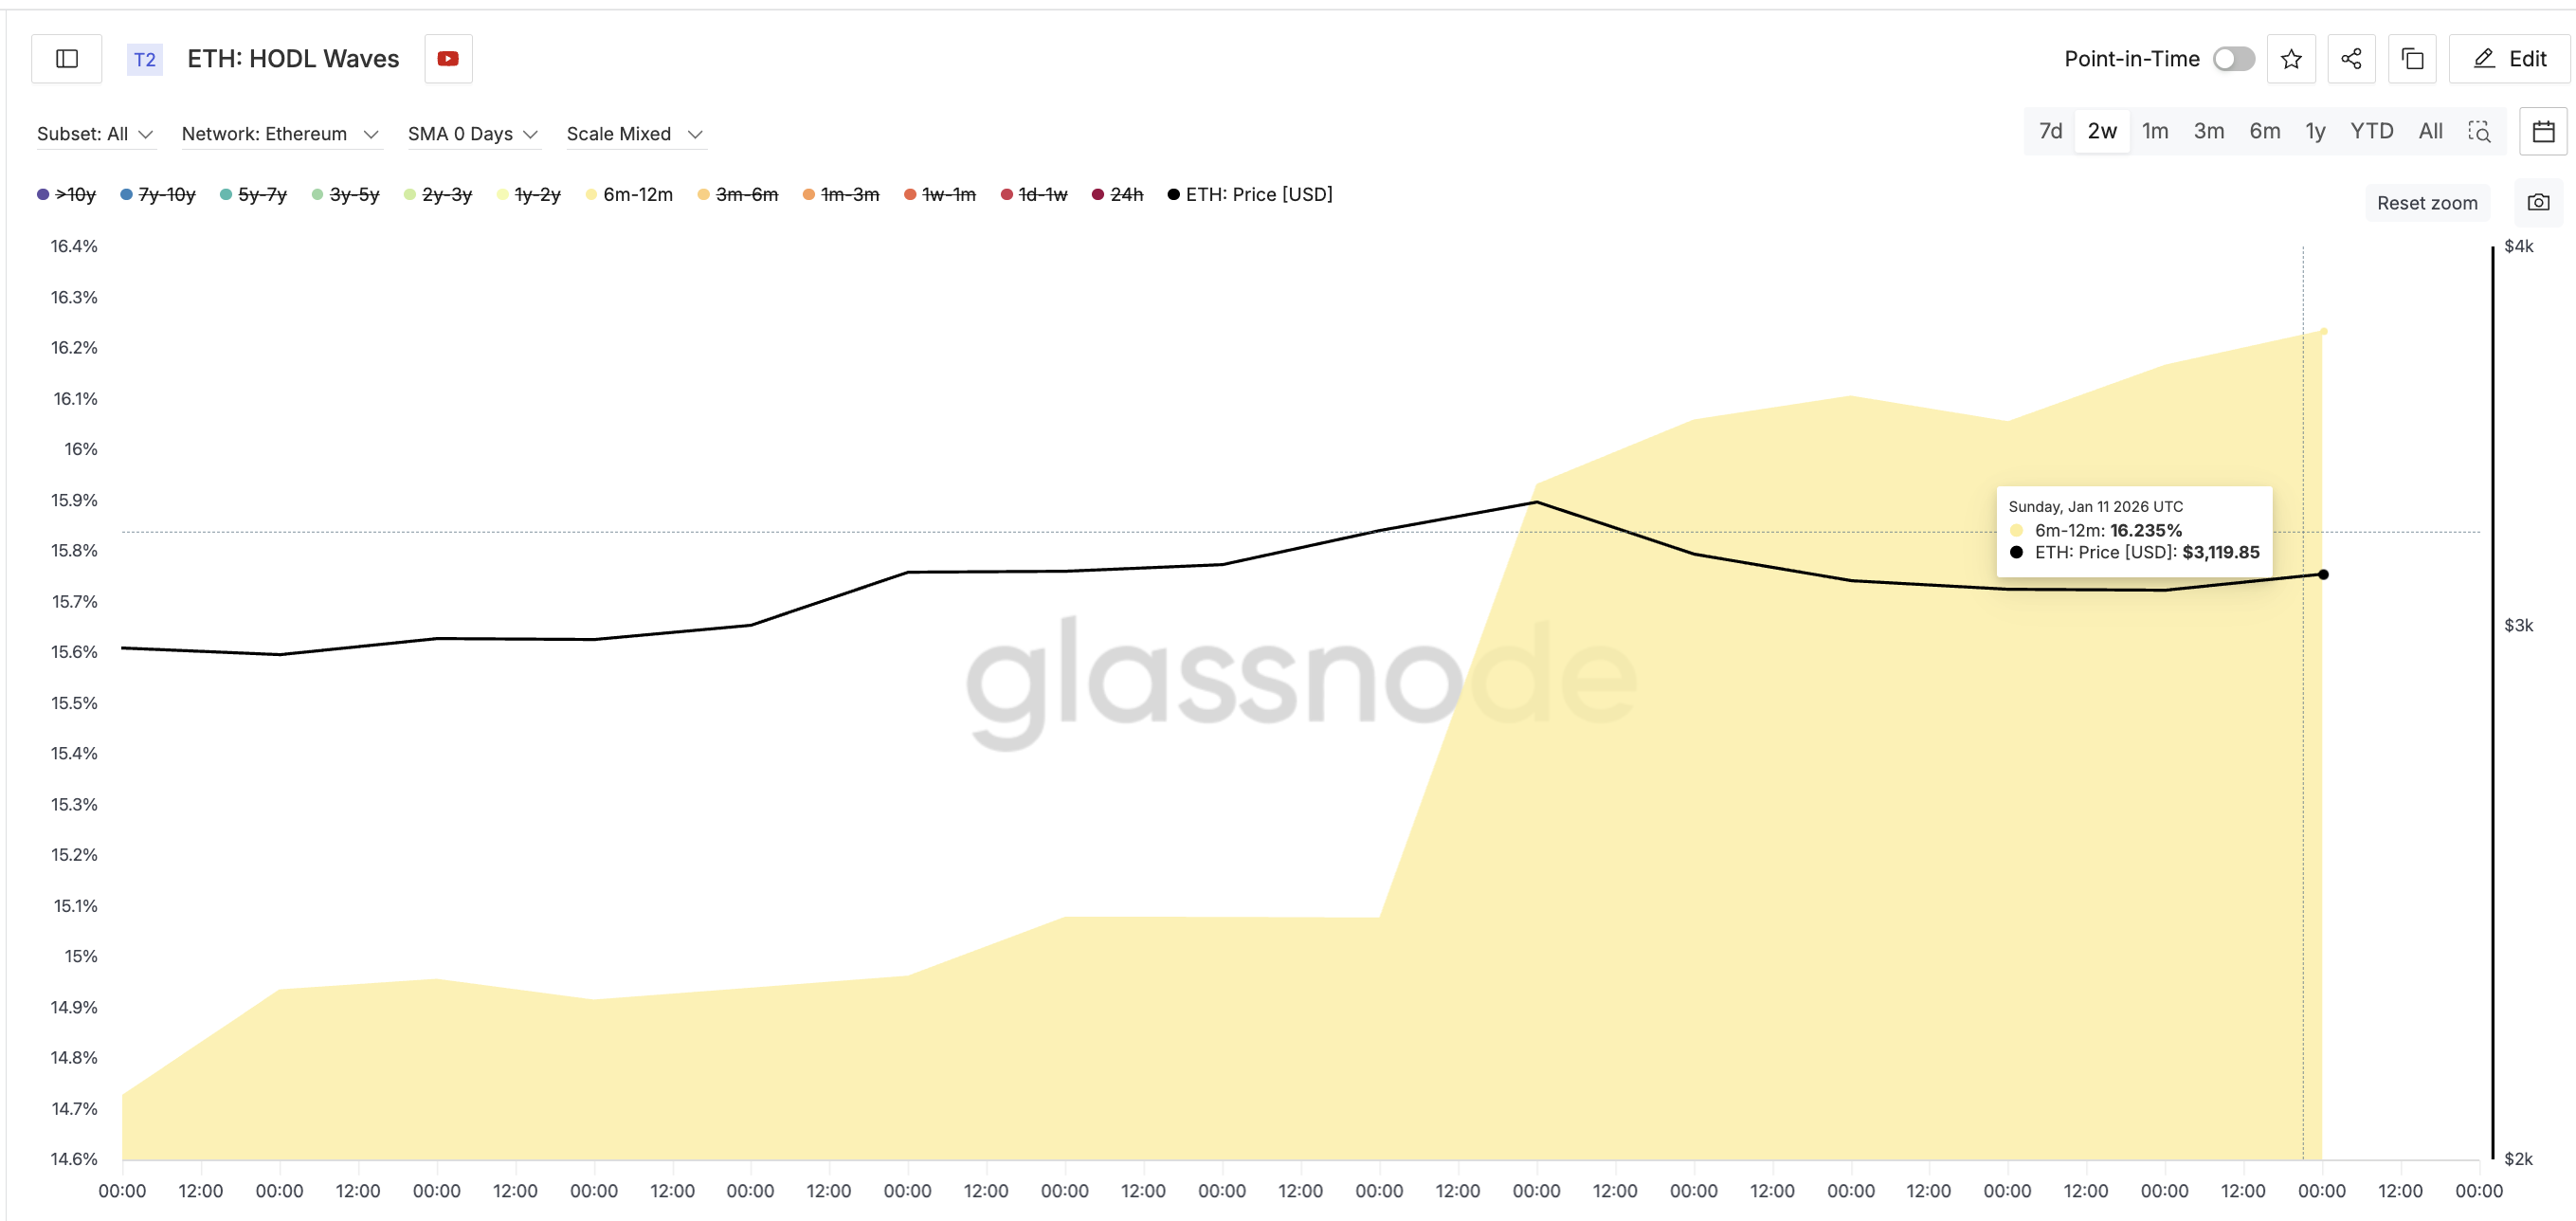
HODL Waves metric, which tracks cohorts based on time, confirms that many short-term holders have already exited. This means the NUPL risk might have already played out.
The 1-week to 1-month cohort dropped sharply from around 11.5% of supply in mid-December to about 3.9% now.
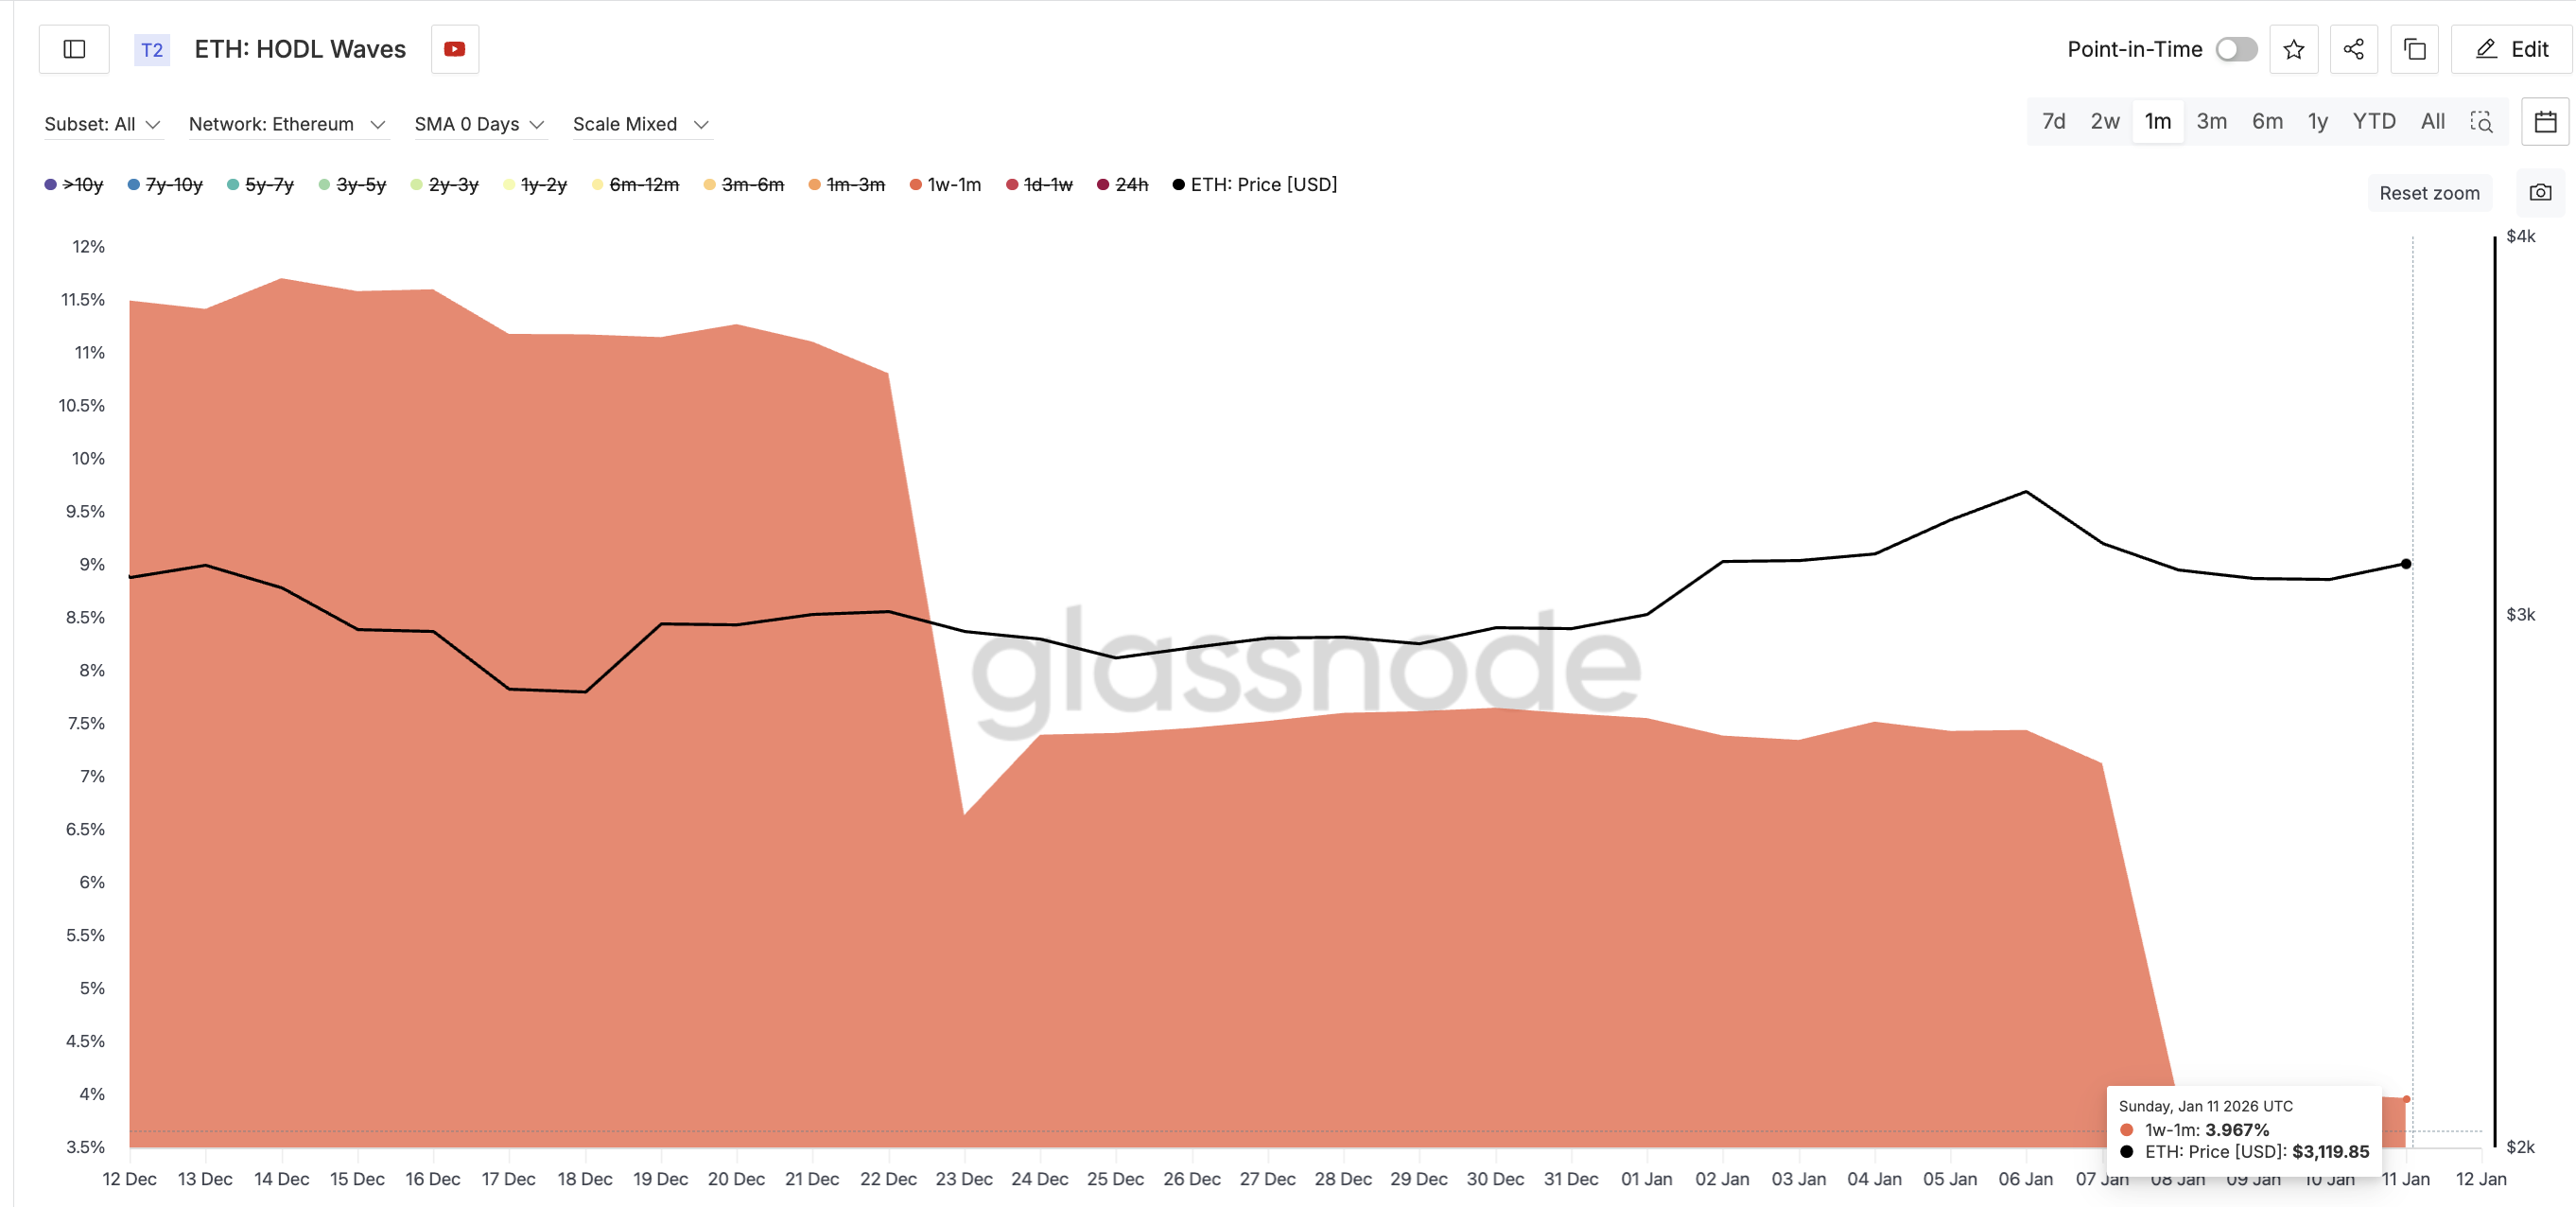
That reduces immediate selling pressure and also means this bounce is not being driven by aggressive and speculative new demand yet. While this might look like disinterest, the lack of short-term buyers can eventually help the ETH price move higher if other support remains.
Dip Buying and Longer-Term Holders Are Quietly Supporting Price
The reason Ethereum has not broken down comes from the underlying support.
The Money Flow Index (MFI), which tracks possible dip buying, shows a bullish divergence. Between mid-December and early January, the Ethereum price formed lower highs, whereas MFI formed higher highs. This signals dip buying. Buyers consistently stepped in during pullbacks instead of abandoning positions.
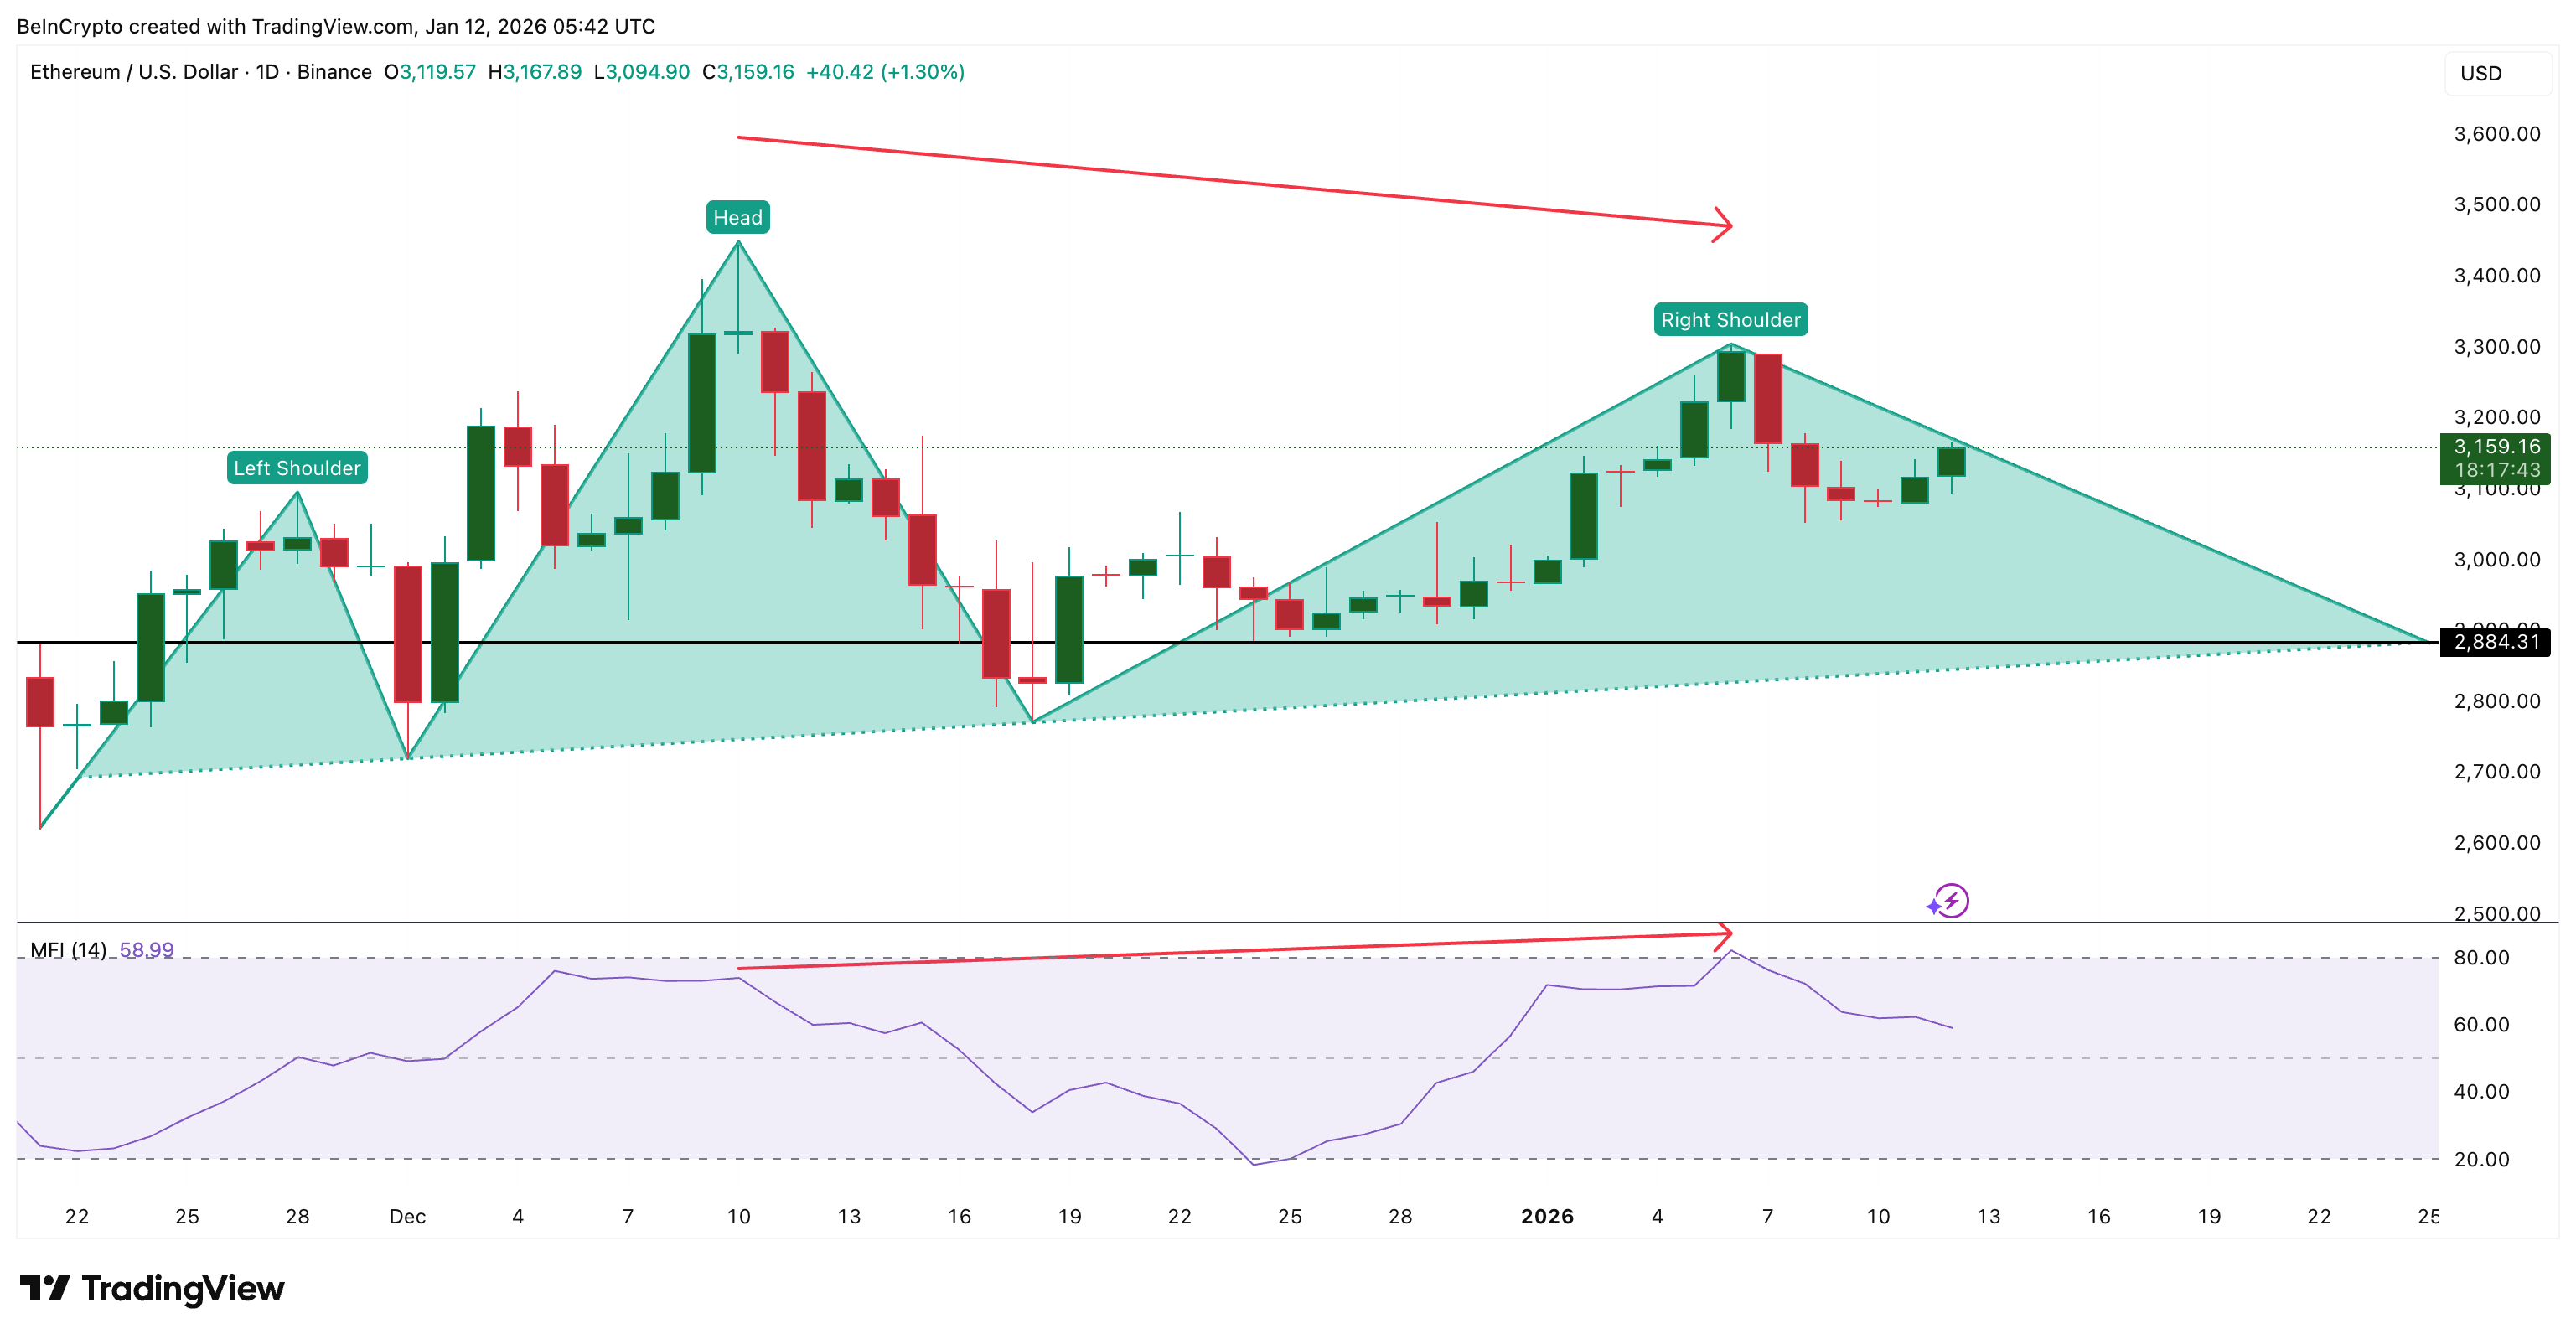
Even though MFI has cooled slightly, it remains well above its prior lows. As long as this holds, selling pressure continues to get absorbed rather than accelerating.
Longer-term holders reinforce this support. The 6-month to 12-month holder group increased its supply share from about 14.7% to roughly 16.2% since late December. This is steady accumulation, not speculative chasing.
Together, reduced short-term supply, ongoing dip buying, and mid-to-long-term holder accumulation explain why Ethereum is bouncing instead of collapsing.
But support alone does not remove risk. It only slows it.
Ethereum Price Levels That Decide Whether the Bounce Holds
Ethereum is now at a clear decision point.
The most important downside level is $2,880. This marks the neckline zone of the head and shoulders structure. A daily close below this level would activate the full pattern, opening the door to a roughly 20% dip risk based on the measured move from the head to the neckline.
Above that price, the first key zone sits between $3,090 and $3,110, average of $3,100, a level also visible on the price chart. This range is critical because it contains a dense on-chain cost-basis cluster where roughly 1.44 million ETH last changed hands. Markets often react strongly around such zones.
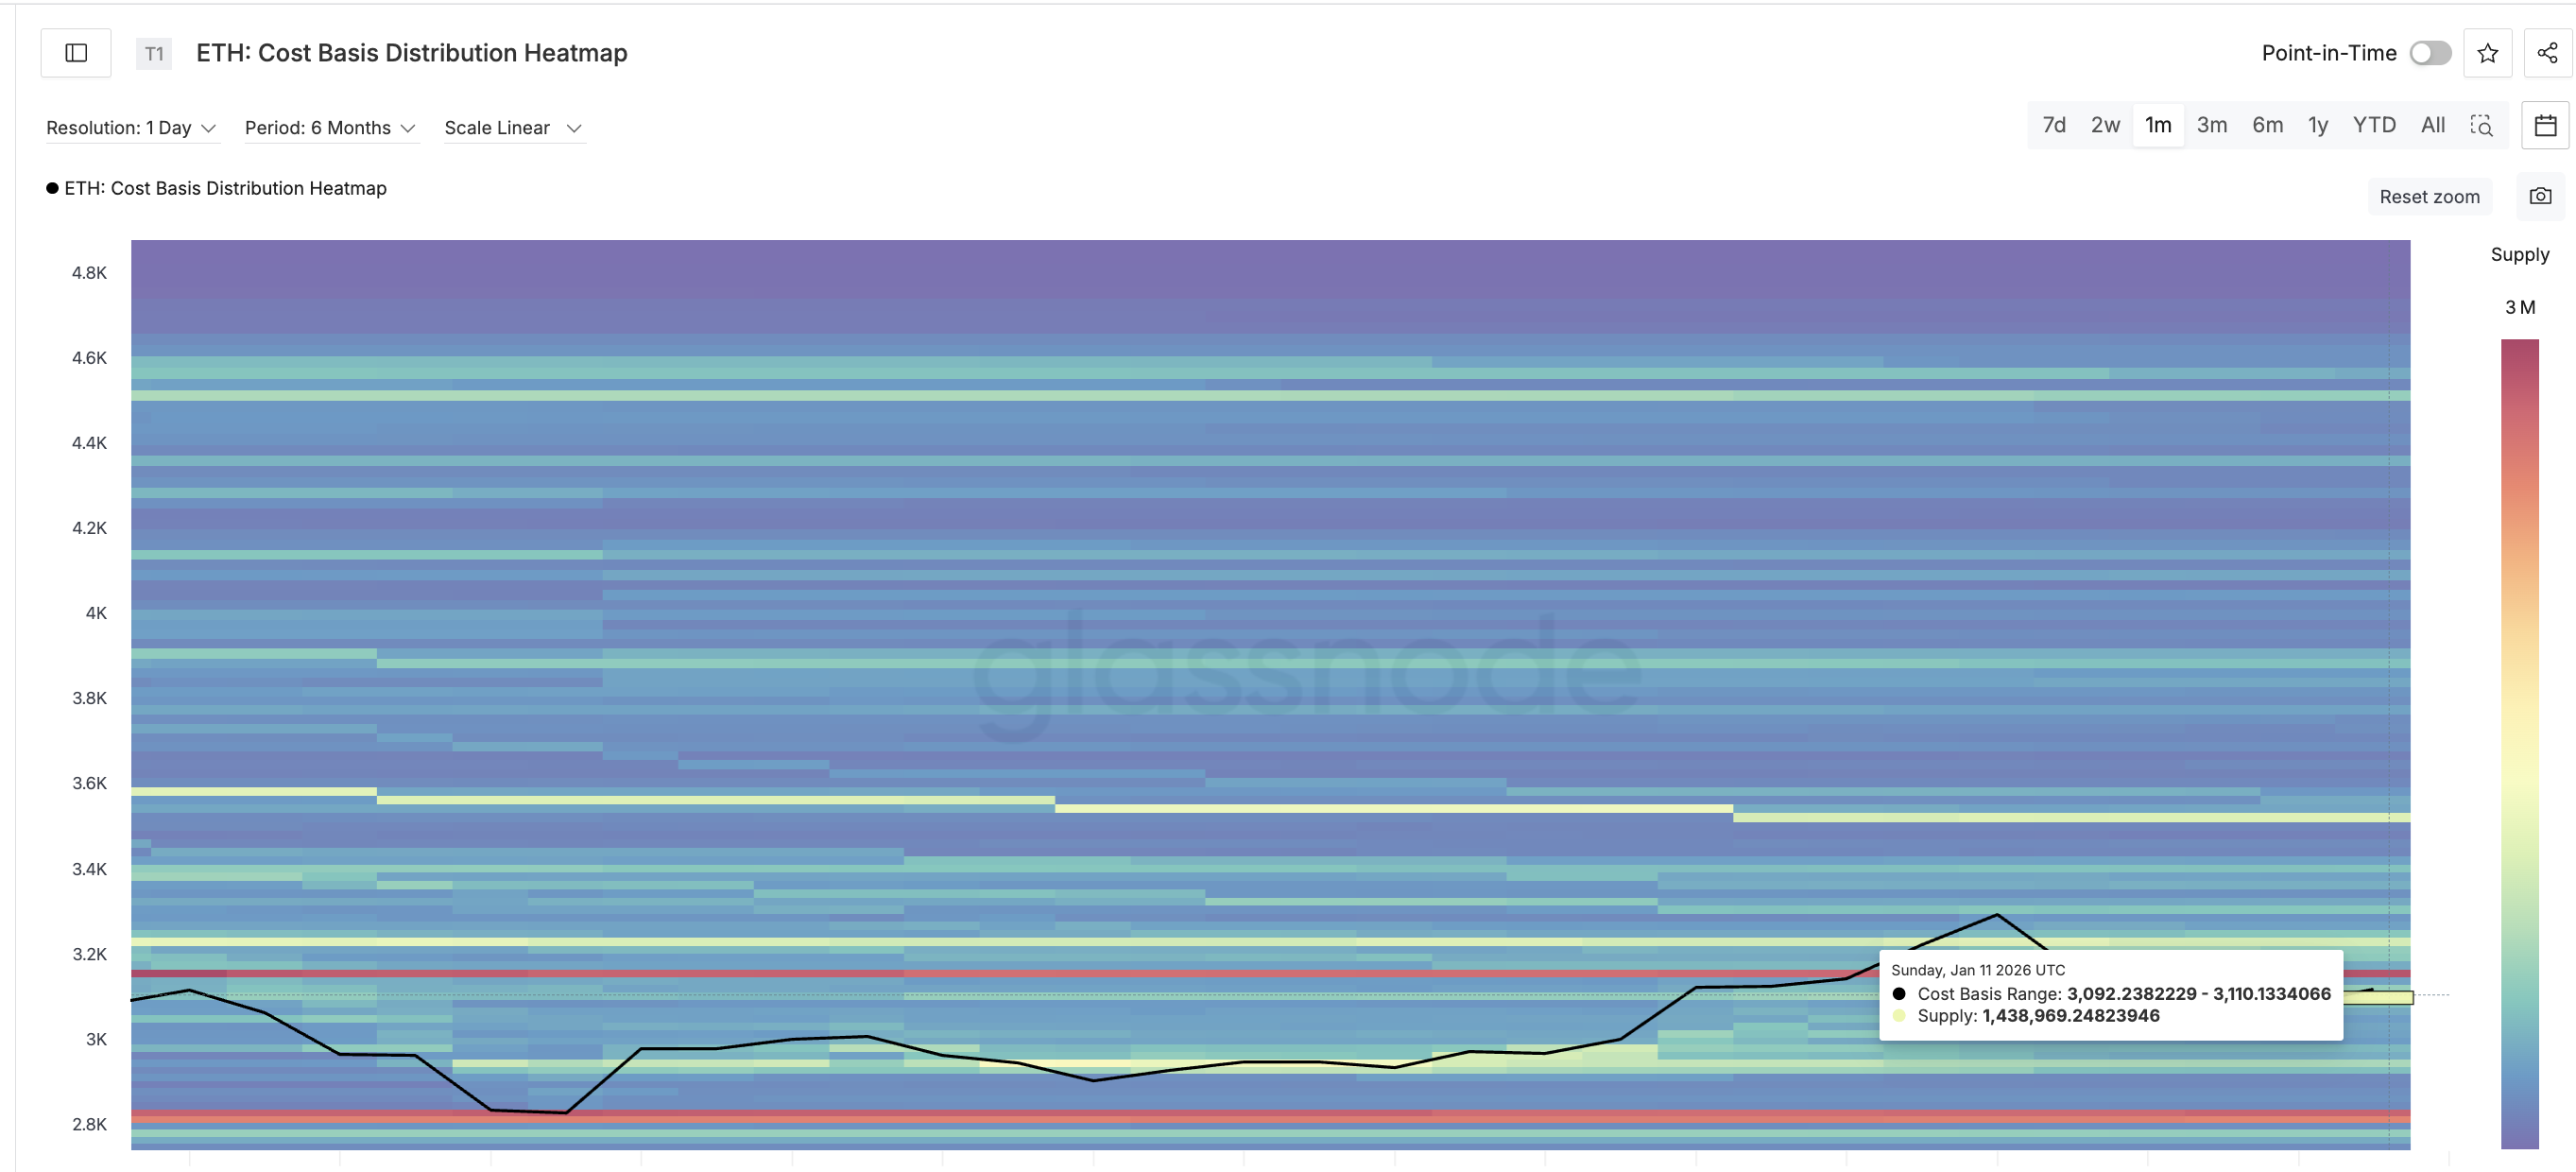
If Ethereum holds above this area, it strengthens the case that buyers are defending cost and absorbing supply. Failure to hold it would increase downside pressure toward $2,970, followed by the critical $2,880 level.
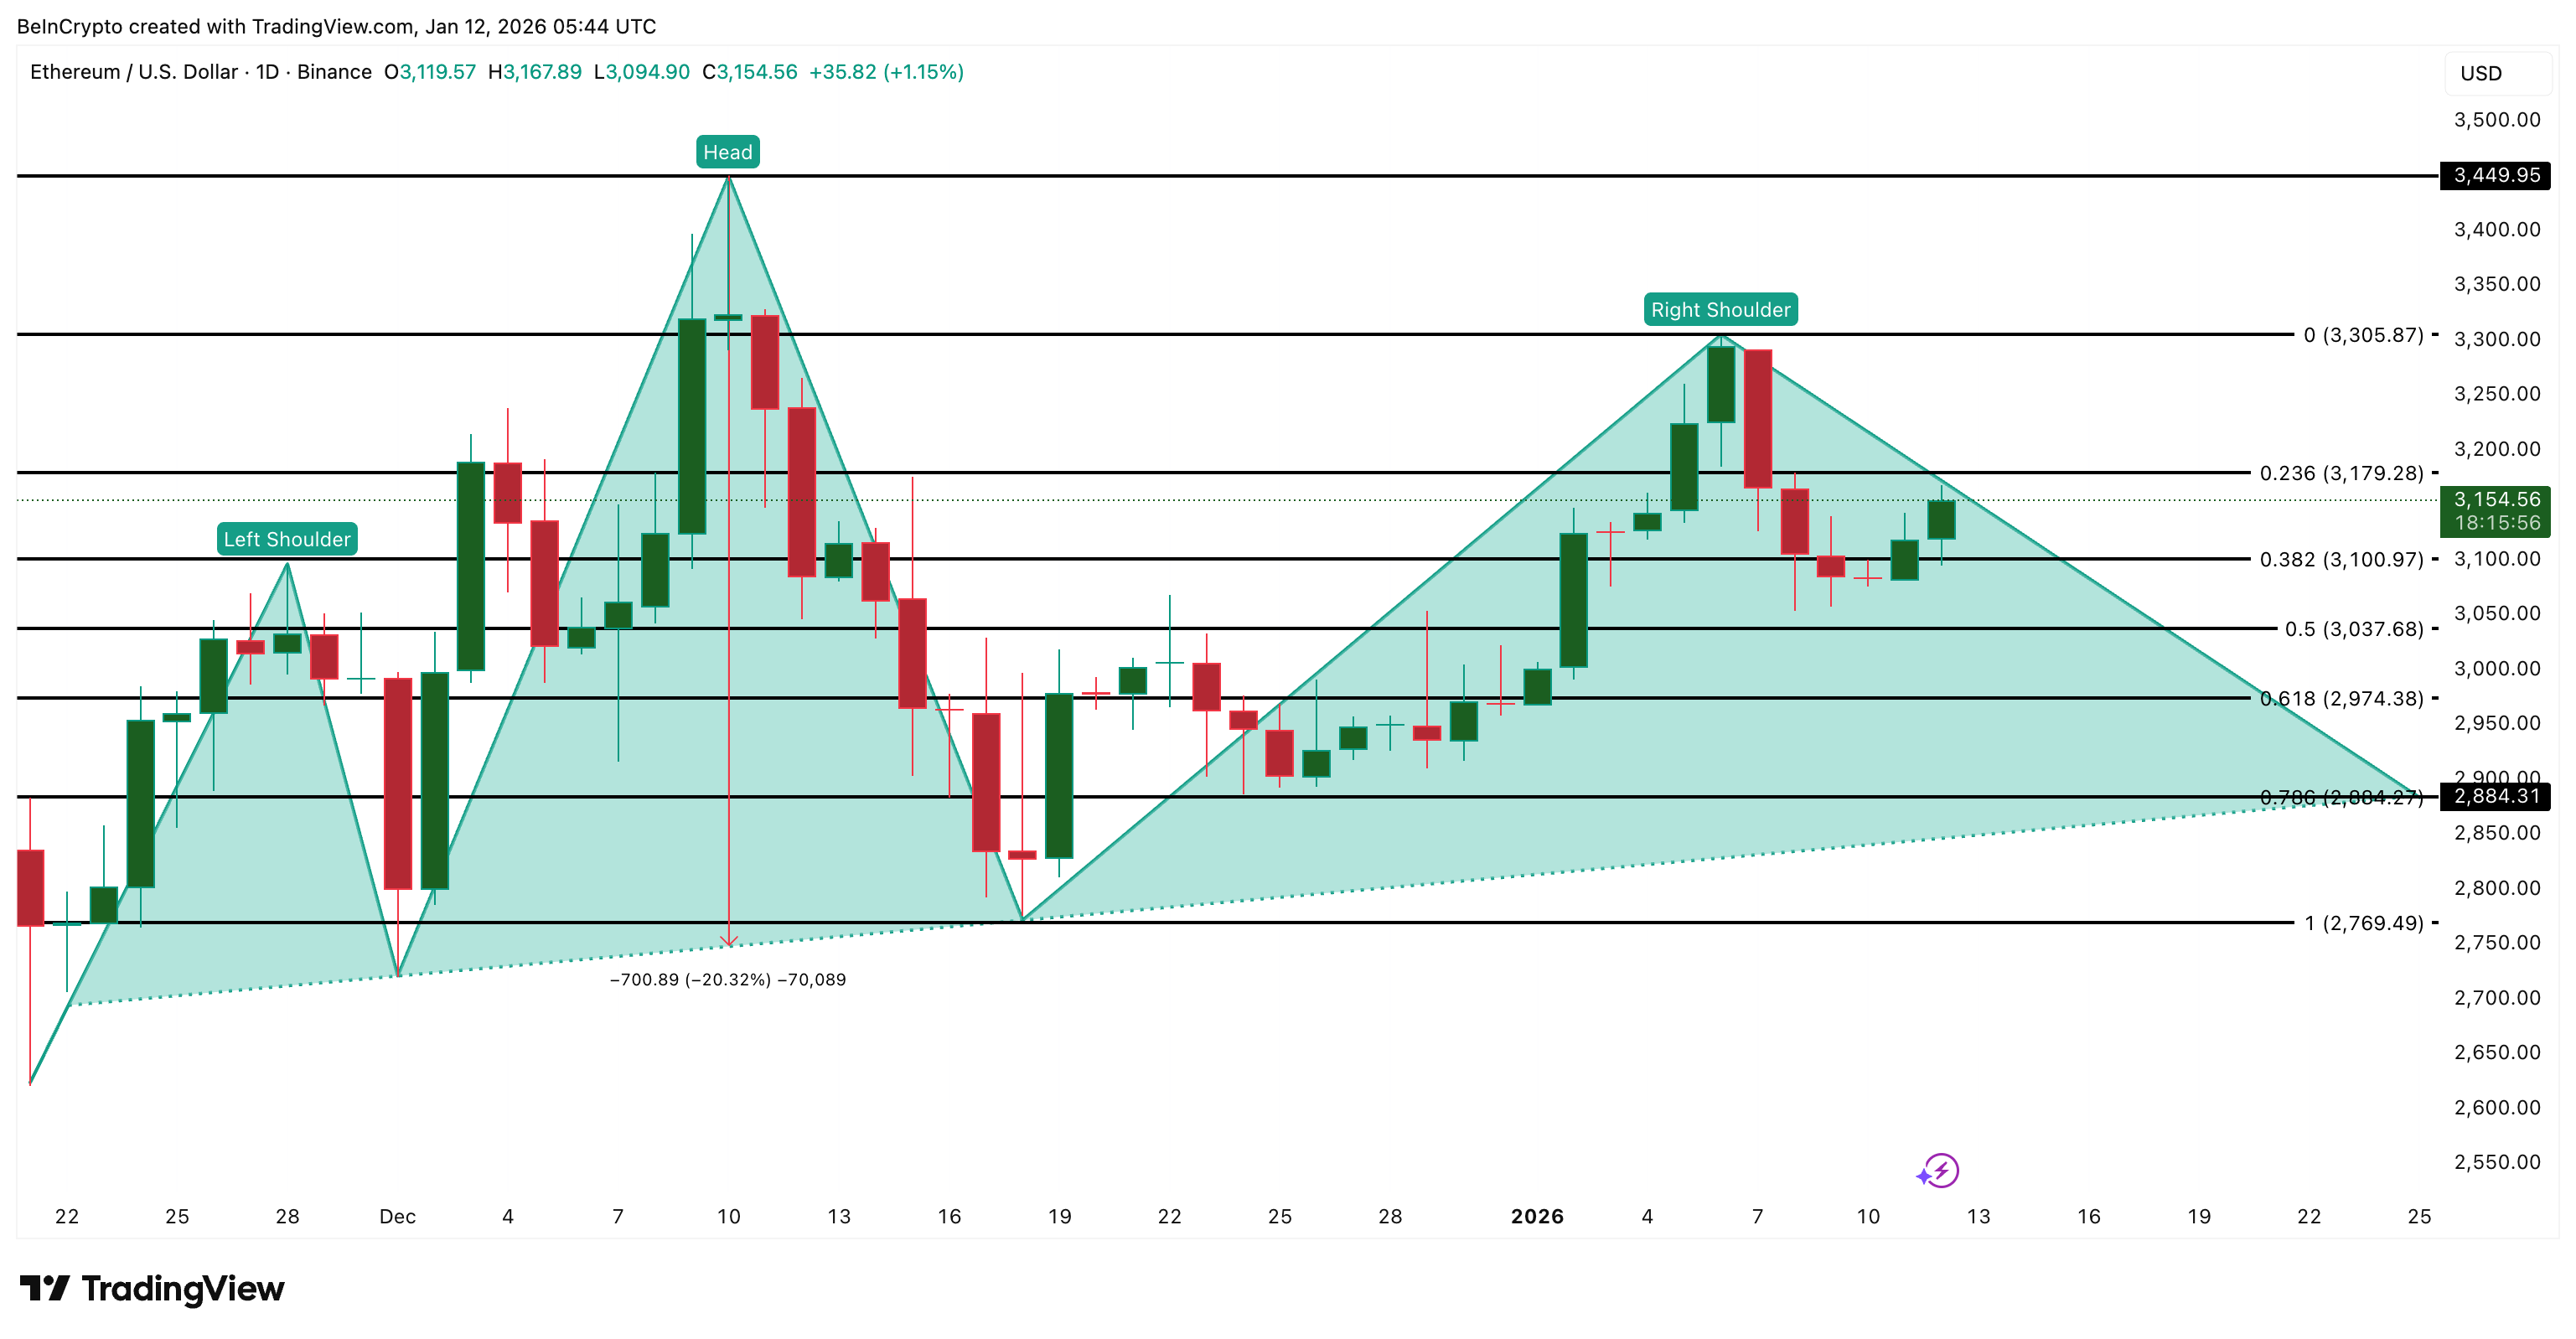
To fully invalidate the bearish structure, Ethereum needs sustained strength above $3,300. A move above $3,440 would erase the head and shoulders risk entirely.
The post Ethereum Bounces — But Is a 20% Trap Forming Beneath One Critical Level? appeared first on BeInCrypto.