Circle Internet Group (NYSE: CRCL) stock crashed almost 20% on March 24 after a new Senate draft of the CLARITY for Payment Stablecoins Act introduced a ban on passive yield for stablecoin balances. Circle is the issuer of USD Coin (USDC), the second-largest stablecoin by market cap.
The sell-off erased billions in market value. However, a closer look at the daily chart structure and institutional flow indicators suggests the drop may not be as bearish as the headline number implies.
Bullish Divergence Flashes, Keeping Hopes Alive
The Circle stock price started weakening on March 17. It might seem that the CLARITY Act draft triggered a 28% correction from the recent peak, but it is worth noting that the biggest chunk of the correction happened yesterday.
This could mean that the market was already pricing in some negative news regarding the CLARITY Act.
However, despite the correction, there is one silver lining. The Relative Strength Index (RSI), a momentum oscillator, adds weight to the bullish case. Between September 8, 2025, and March 24, 2026, the price has printed a lower low while the RSI has formed a higher low. That standard bullish divergence often precedes trend reversals.
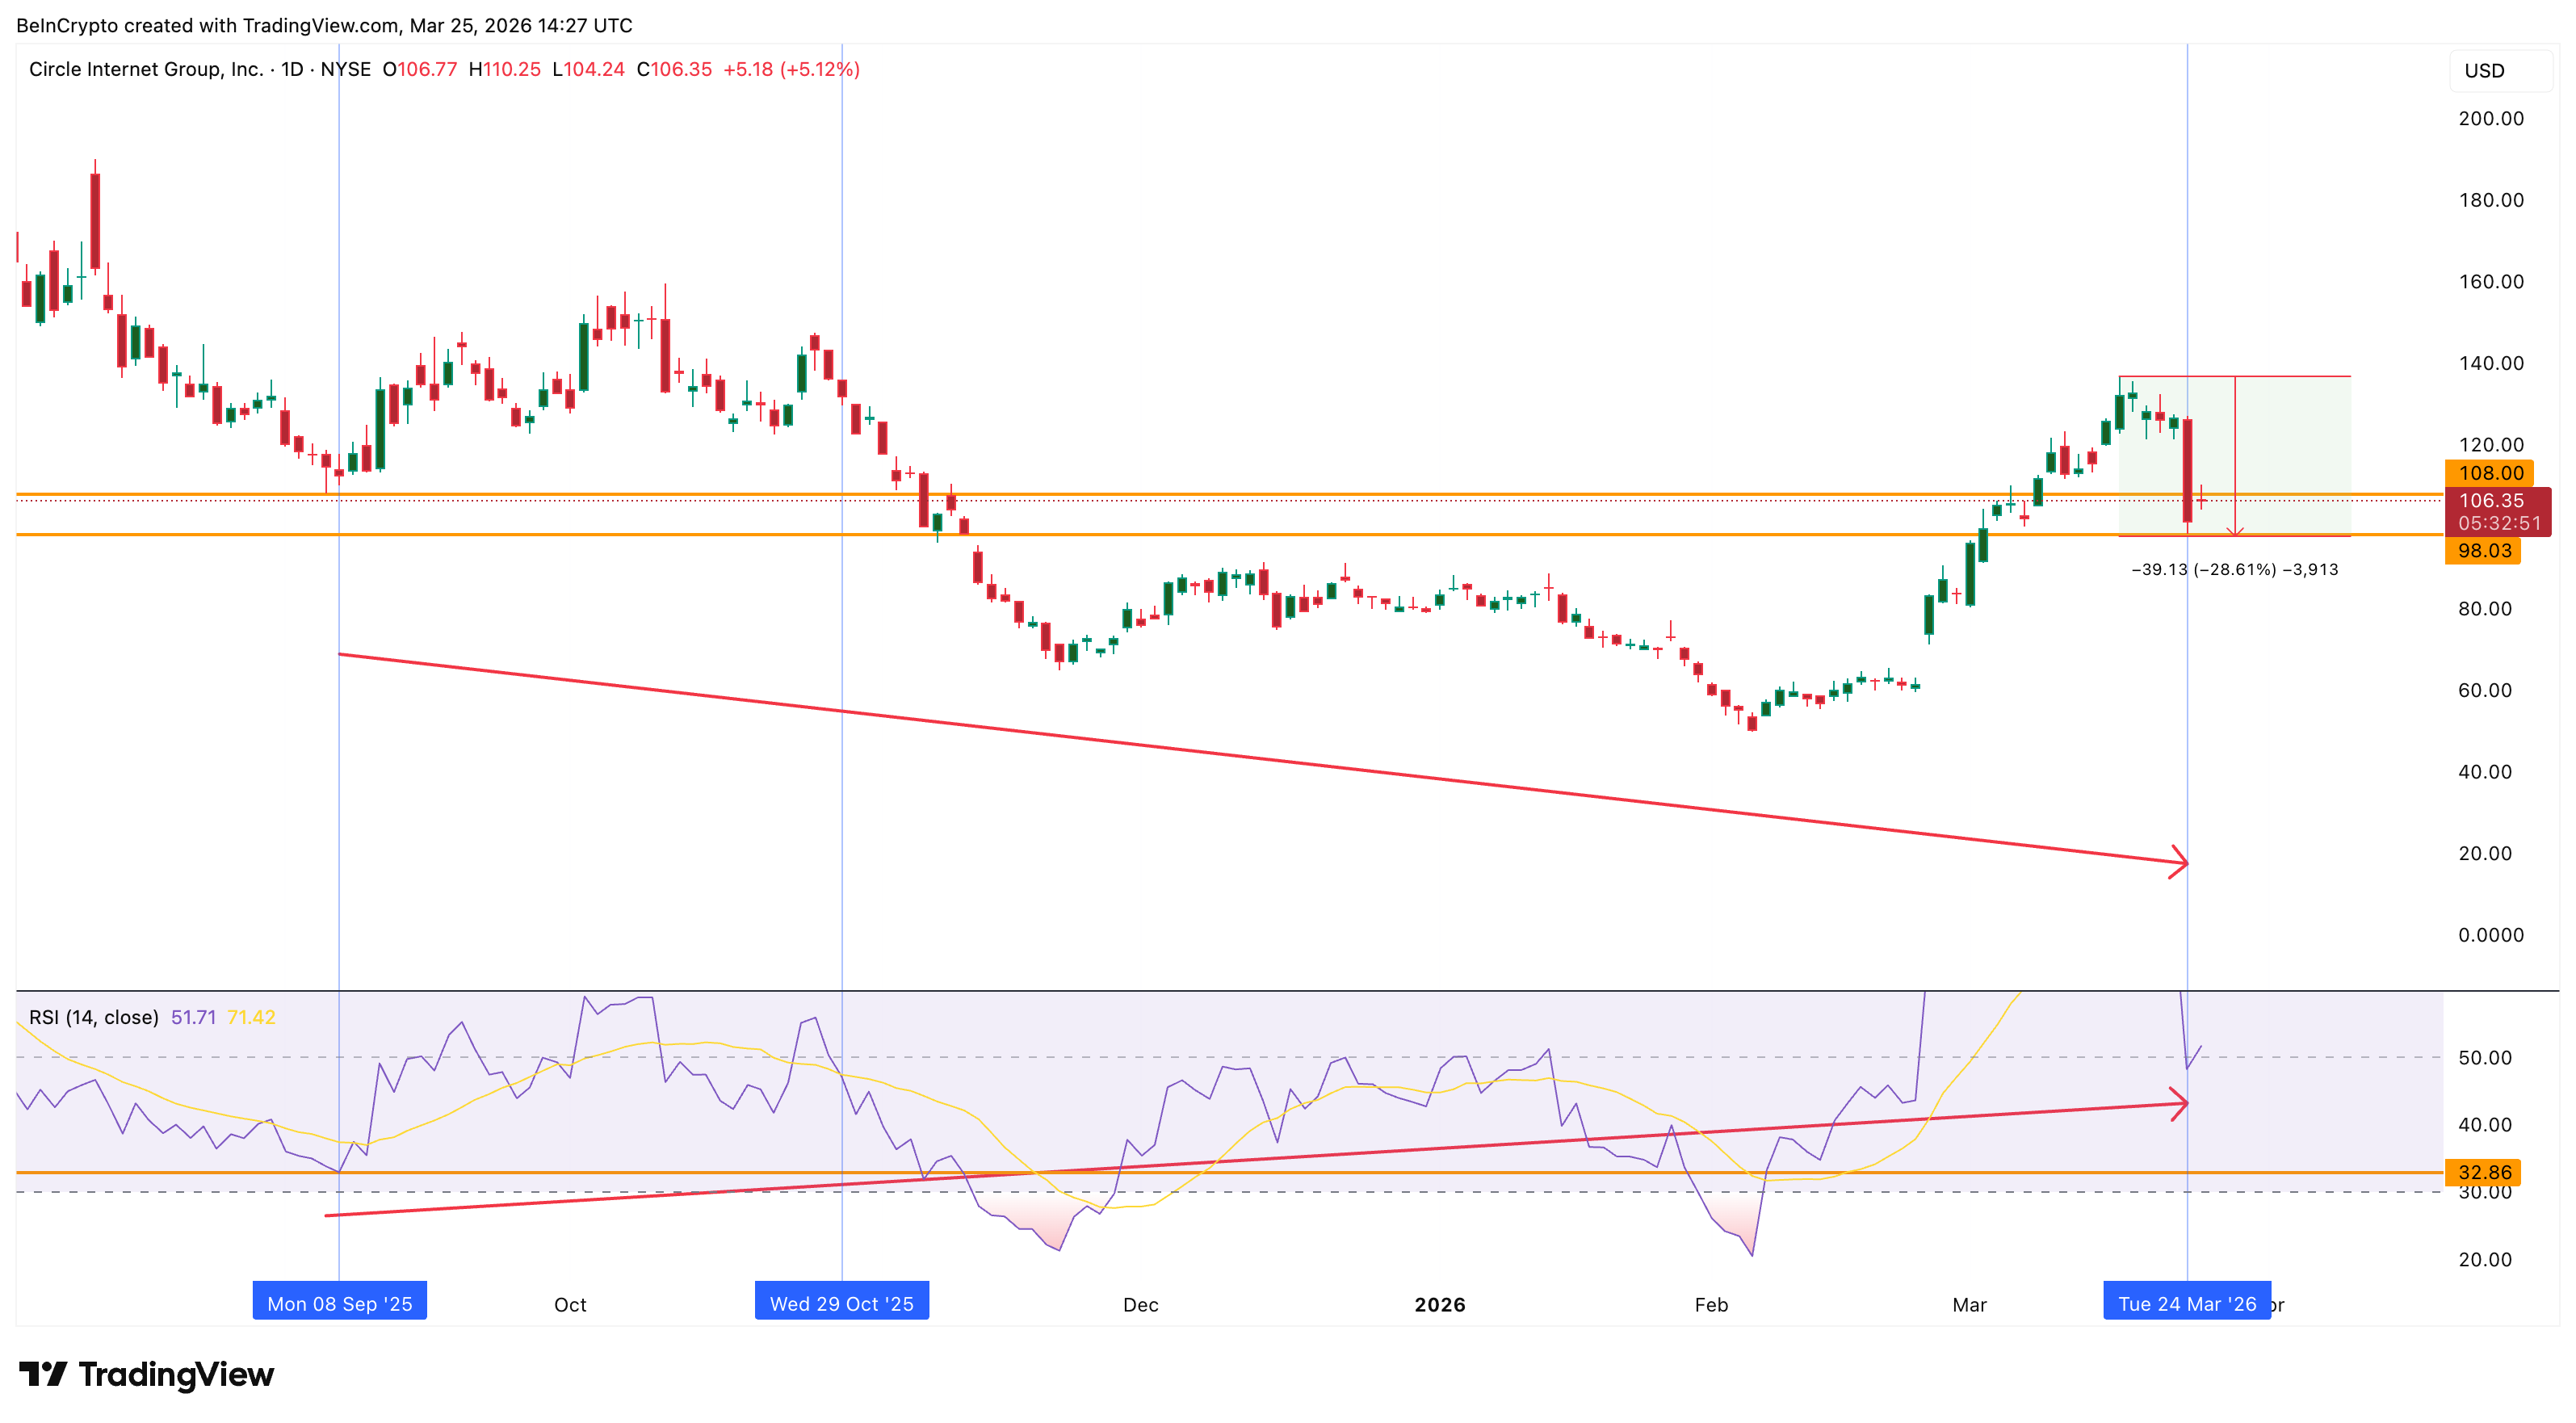
The divergence remains conditional. If today’s candle (currently high) breaches the $98 level and closes below it, the higher low structure on the RSI breaks, and the signal is invalidated for now. However, if $98 holds through the session, the divergence confirms, and a bounce becomes the higher probability outcome.
The RSI points toward a potential recovery. But the options market tells a more nuanced story about how traders are positioned.
Options Positioning Shifts Bearish, but CMF Says Hold
The put-call ratio, which compares bearish put options to bullish call options, has shifted since earnings. On February 25, when Circle reported Q4 results at $83 per share, the volume ratio sat at 0.58 and the open interest ratio at 0.70. The market leaned decisively toward calls, or leaned bullish.
Want more insights like this? Sign up for Editor Harsh Notariya’s Daily Crypto Newsletter here.
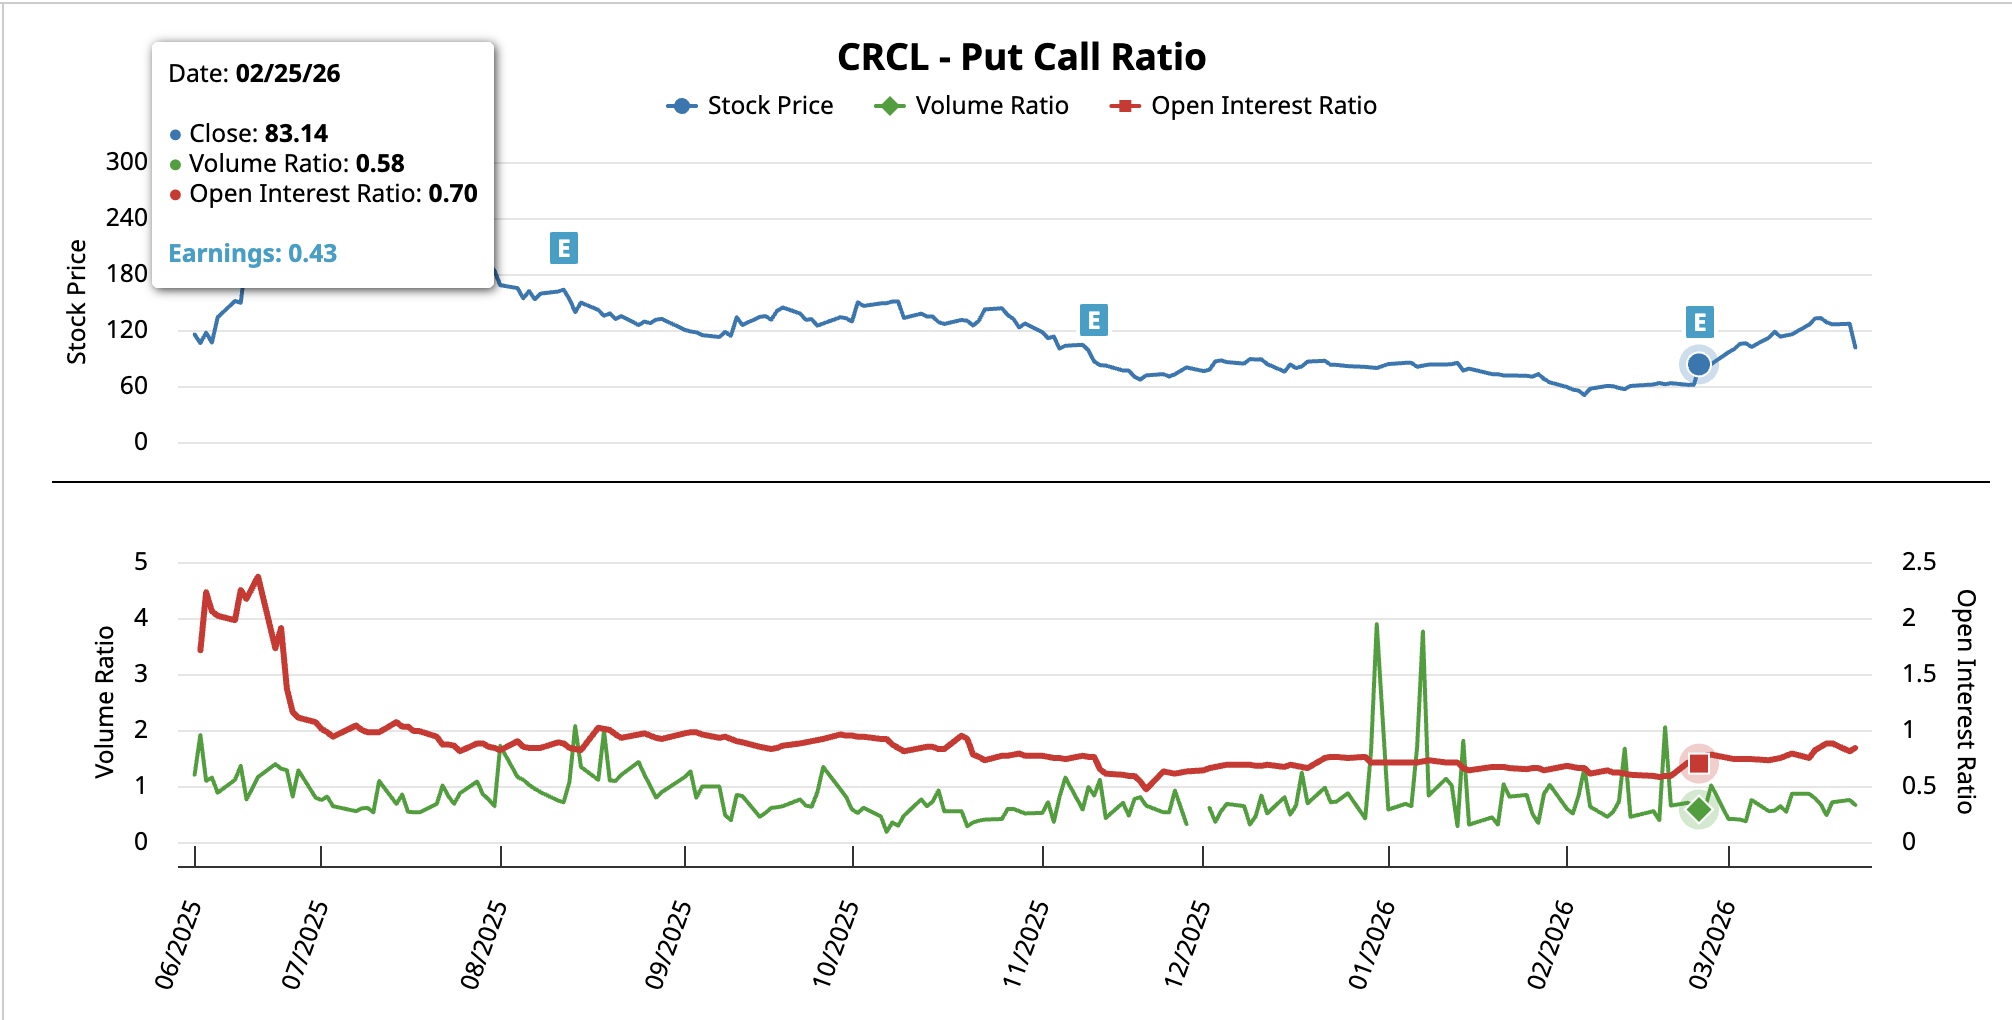
By March 24, with CRCL at $101, the volume ratio had climbed to 0.66 and the open interest ratio to 0.84. More puts are being opened, and they are staying active. The shift confirms that some traders are hedging or betting against a recovery.
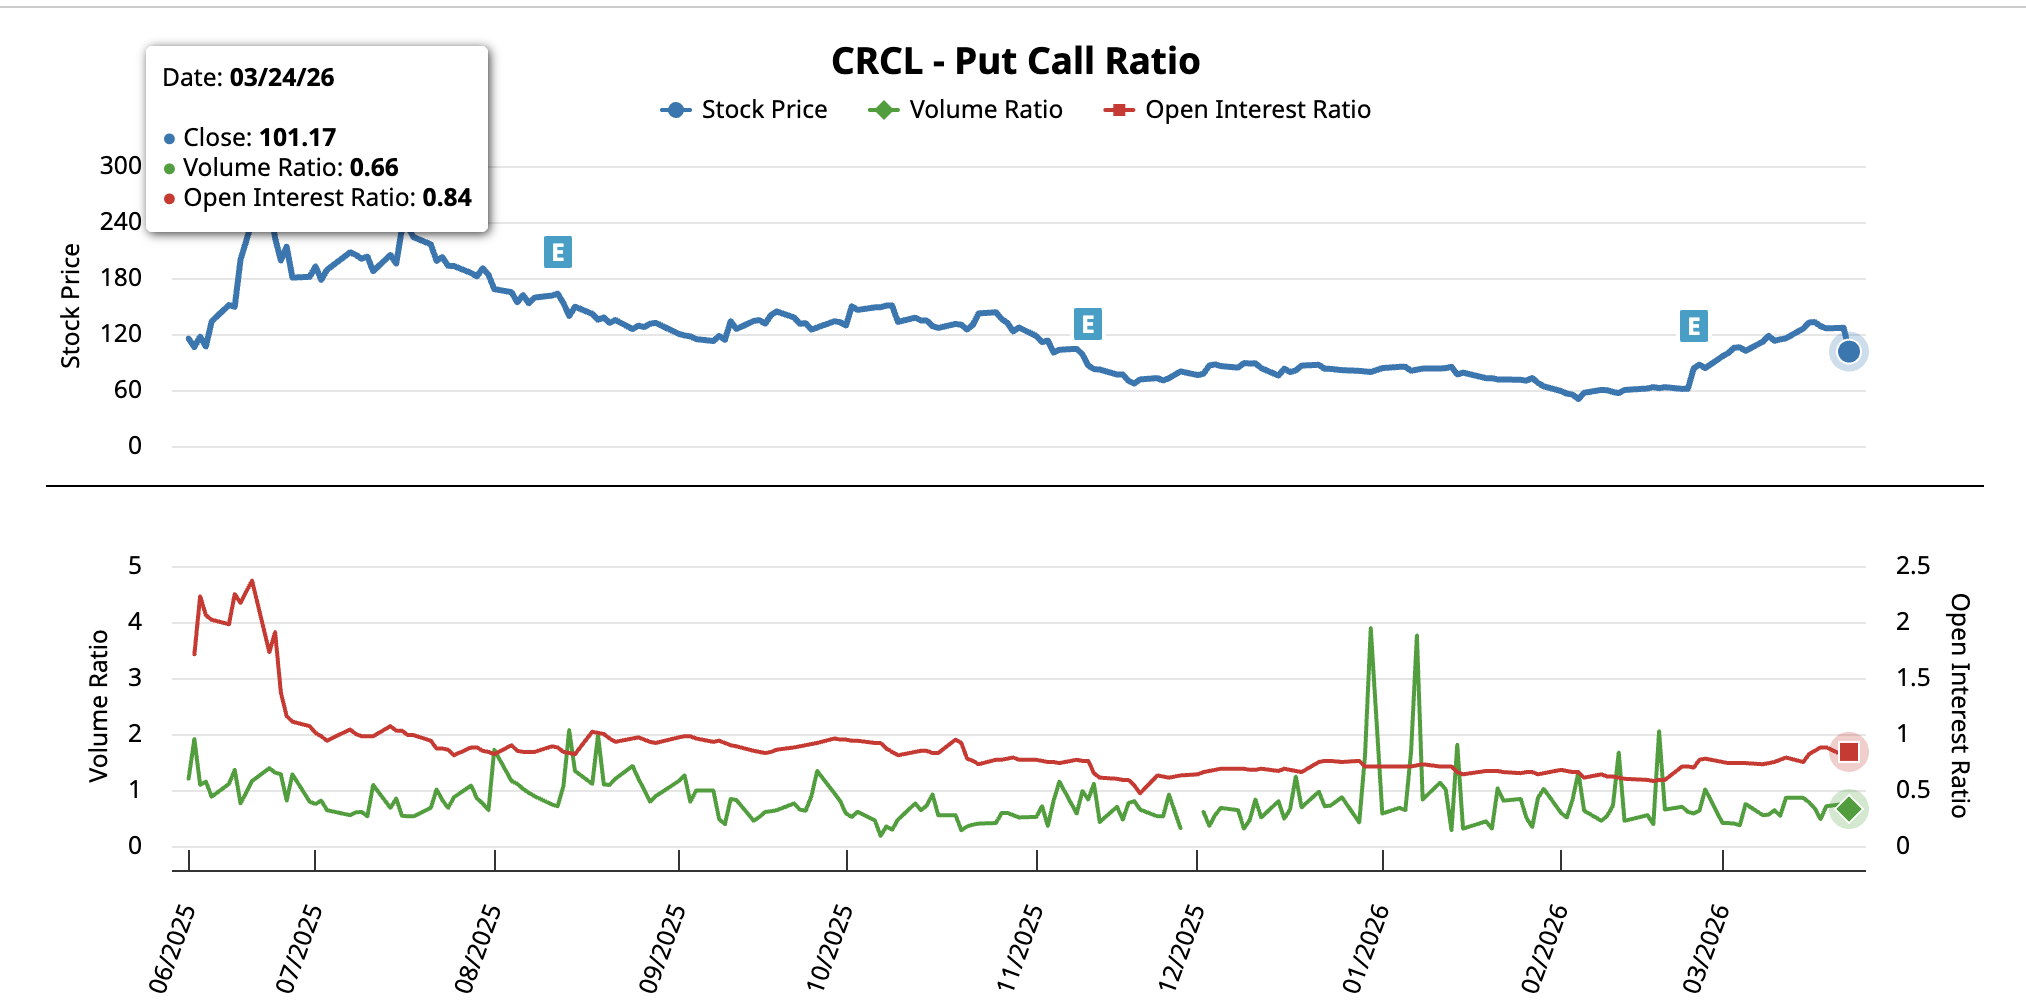
However, both ratios remain below 1.0, meaning call positioning still outweighs puts on an absolute basis. The bearish tilt is growing, but it has not flipped the overall sentiment.
Chaikin Money Flow (CMF), a proxy for institutional buying and selling pressure, reinforces the bull case. Between October 29, 2025, and March 23, 2026, the CRCL stock price trended lower. Yet CMF during the same window trended steadily higher, crossing above zero and staying there even through the 20% crash. That divergence signals that large players continued accumulating while the price corrected, a pattern that often precedes sharp recoveries.
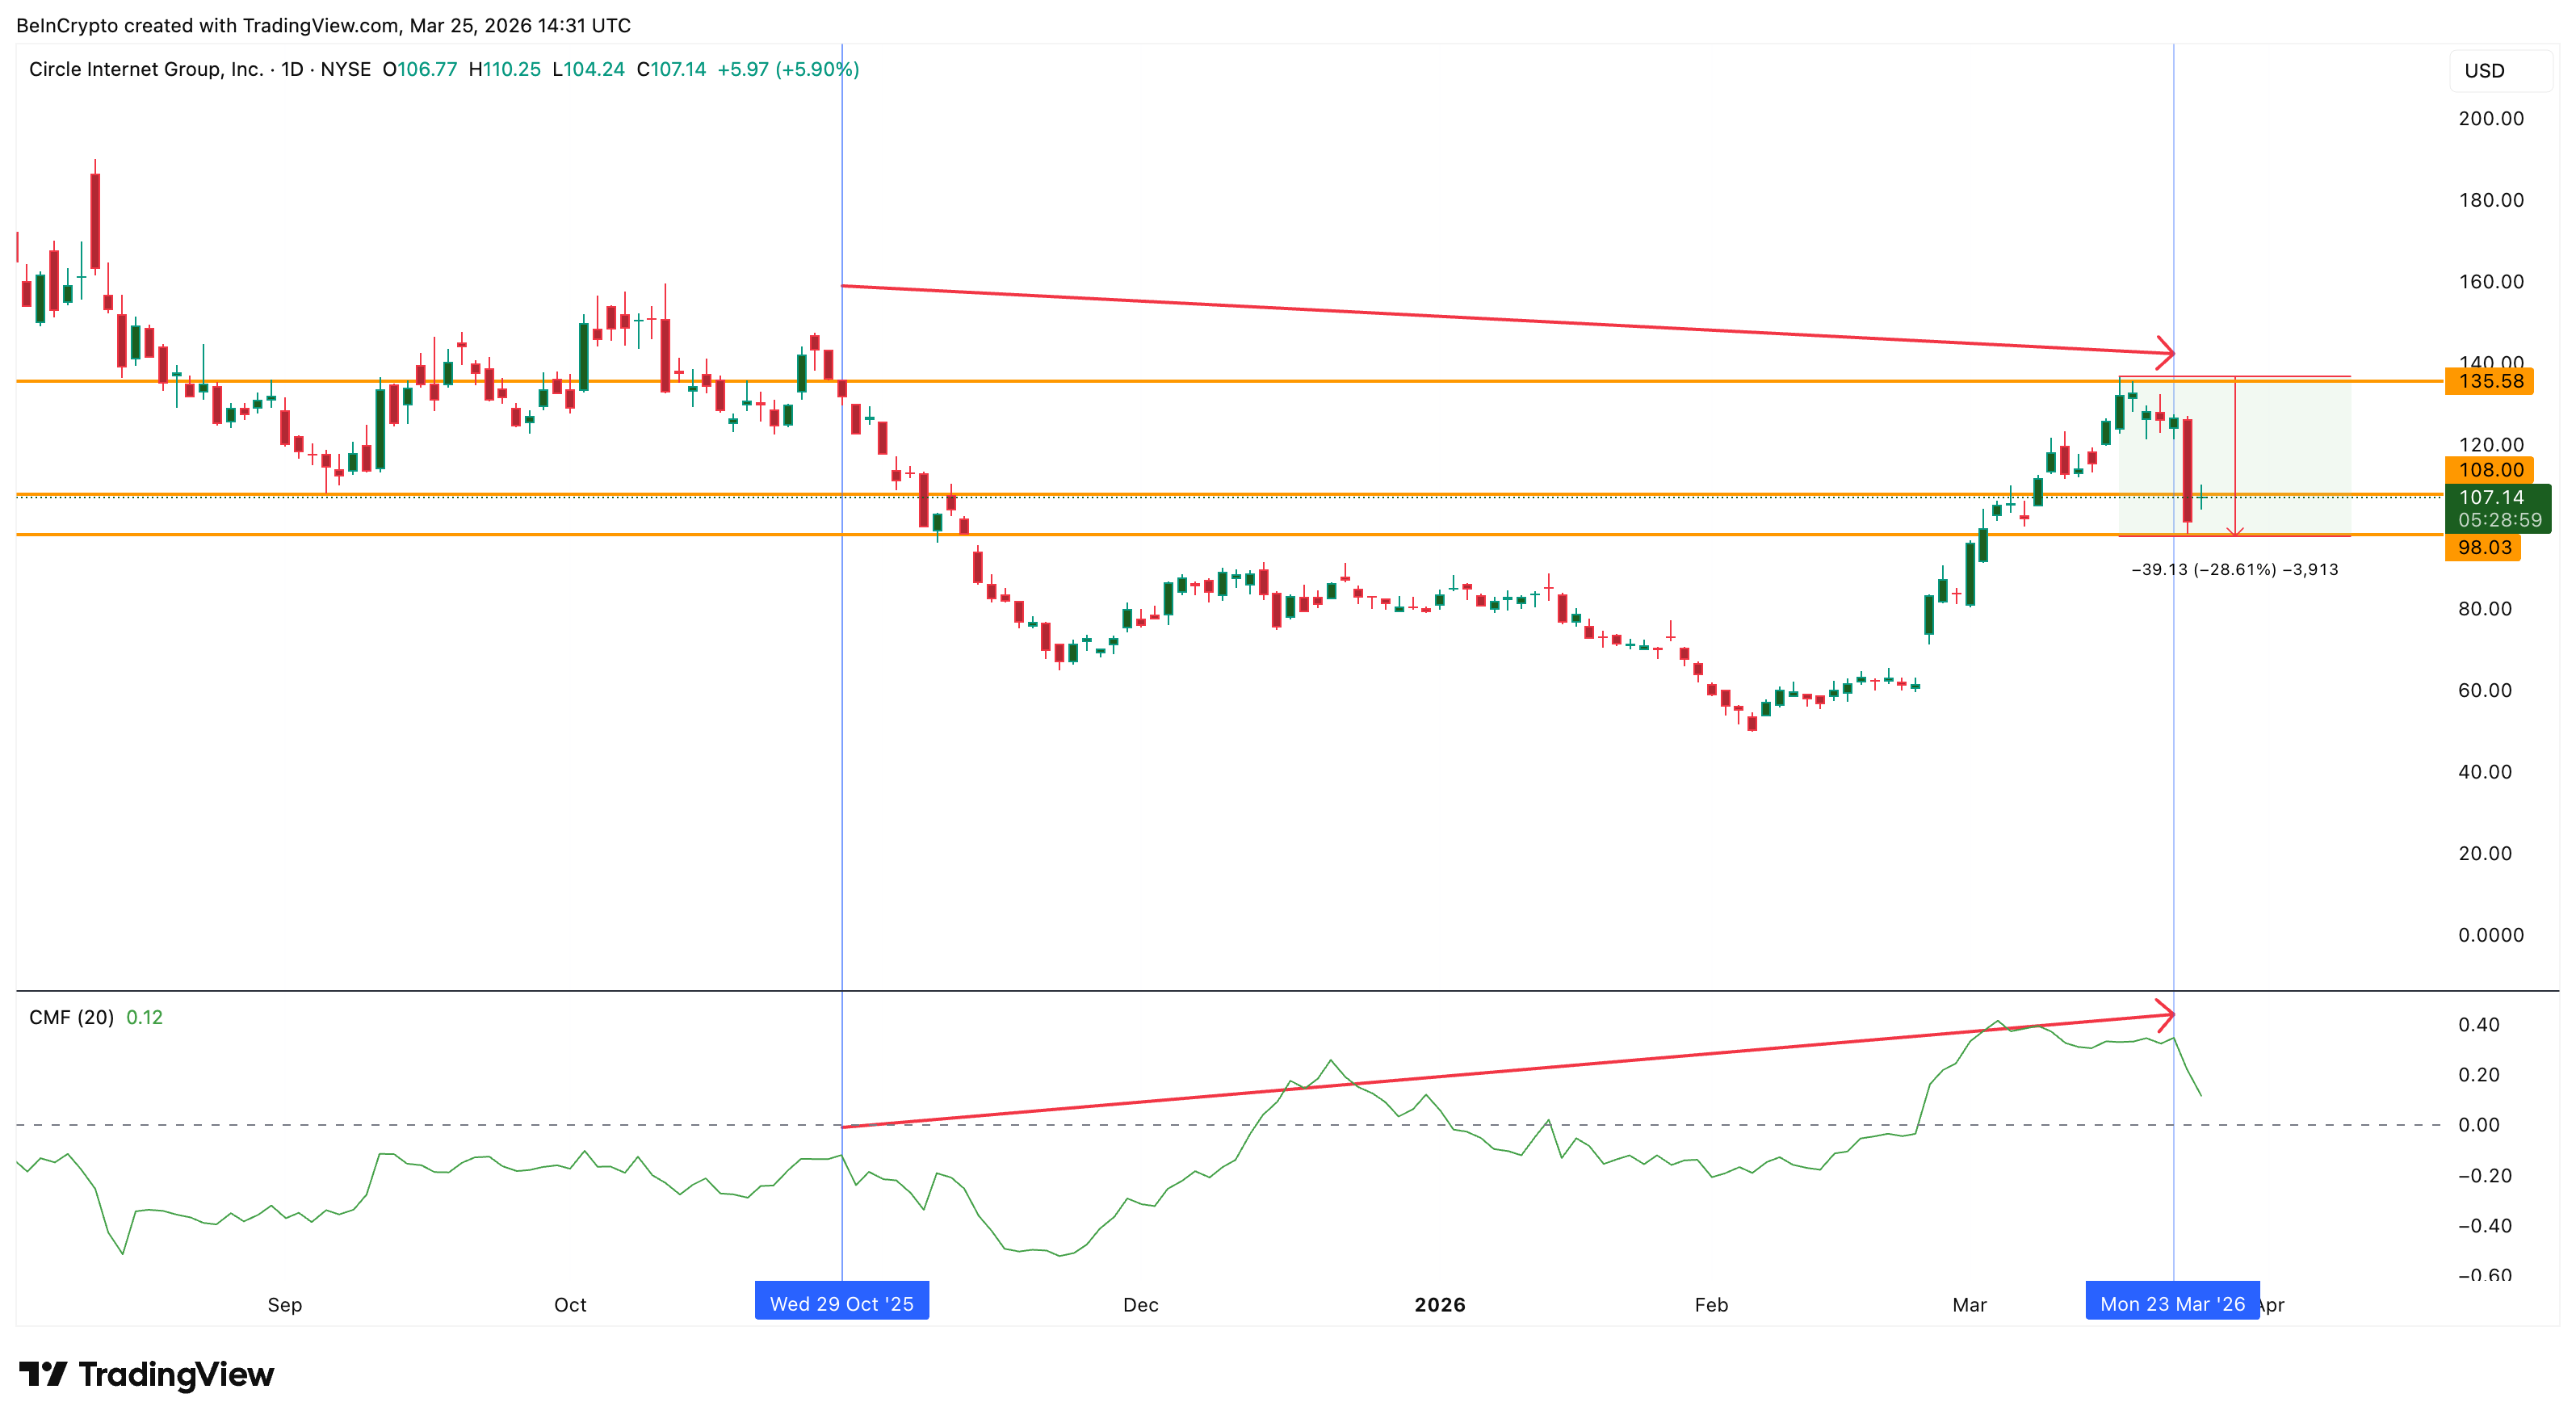
If the bearish options positioning represents retail fear and the CMF represents institutional conviction, the current setup resembles a bear trap rather than the start of a sustained decline. Do note that CMF dropping below the zero line can take away this bullish trigger.
Circle Stock Forecast and the $141 Breakout Window
The sell-off has helped CRCL form an inverse head-and-shoulders pattern, but with a steeper neckline. The breakout window now sits between $141 and $152, which means CRCL needs roughly a 40% to 50% move from current levels to confirm the pattern.
The $152 level also aligns with Clear Street’s new price target for Circle stock. Clear Street is a NY-based investment banking firm.
That sounds steep, but the pattern’s measured move gets a boost. If the neckline breaks, Fibonacci extensions point to $185 as the first major target, followed by $239 and eventually $326 at the 2.618 extension. The 326 level also aligns with our target projection of over 130%.
ARK Invest bought approximately $16 million worth of CRCL on the March 24 dip, signaling institutional conviction that the CLARITY Act reaction was overdone.
The broader framework still favors compliant stablecoin issuers like Circle over unregulated rivals, even if the yield-sharing mechanism needs restructuring.
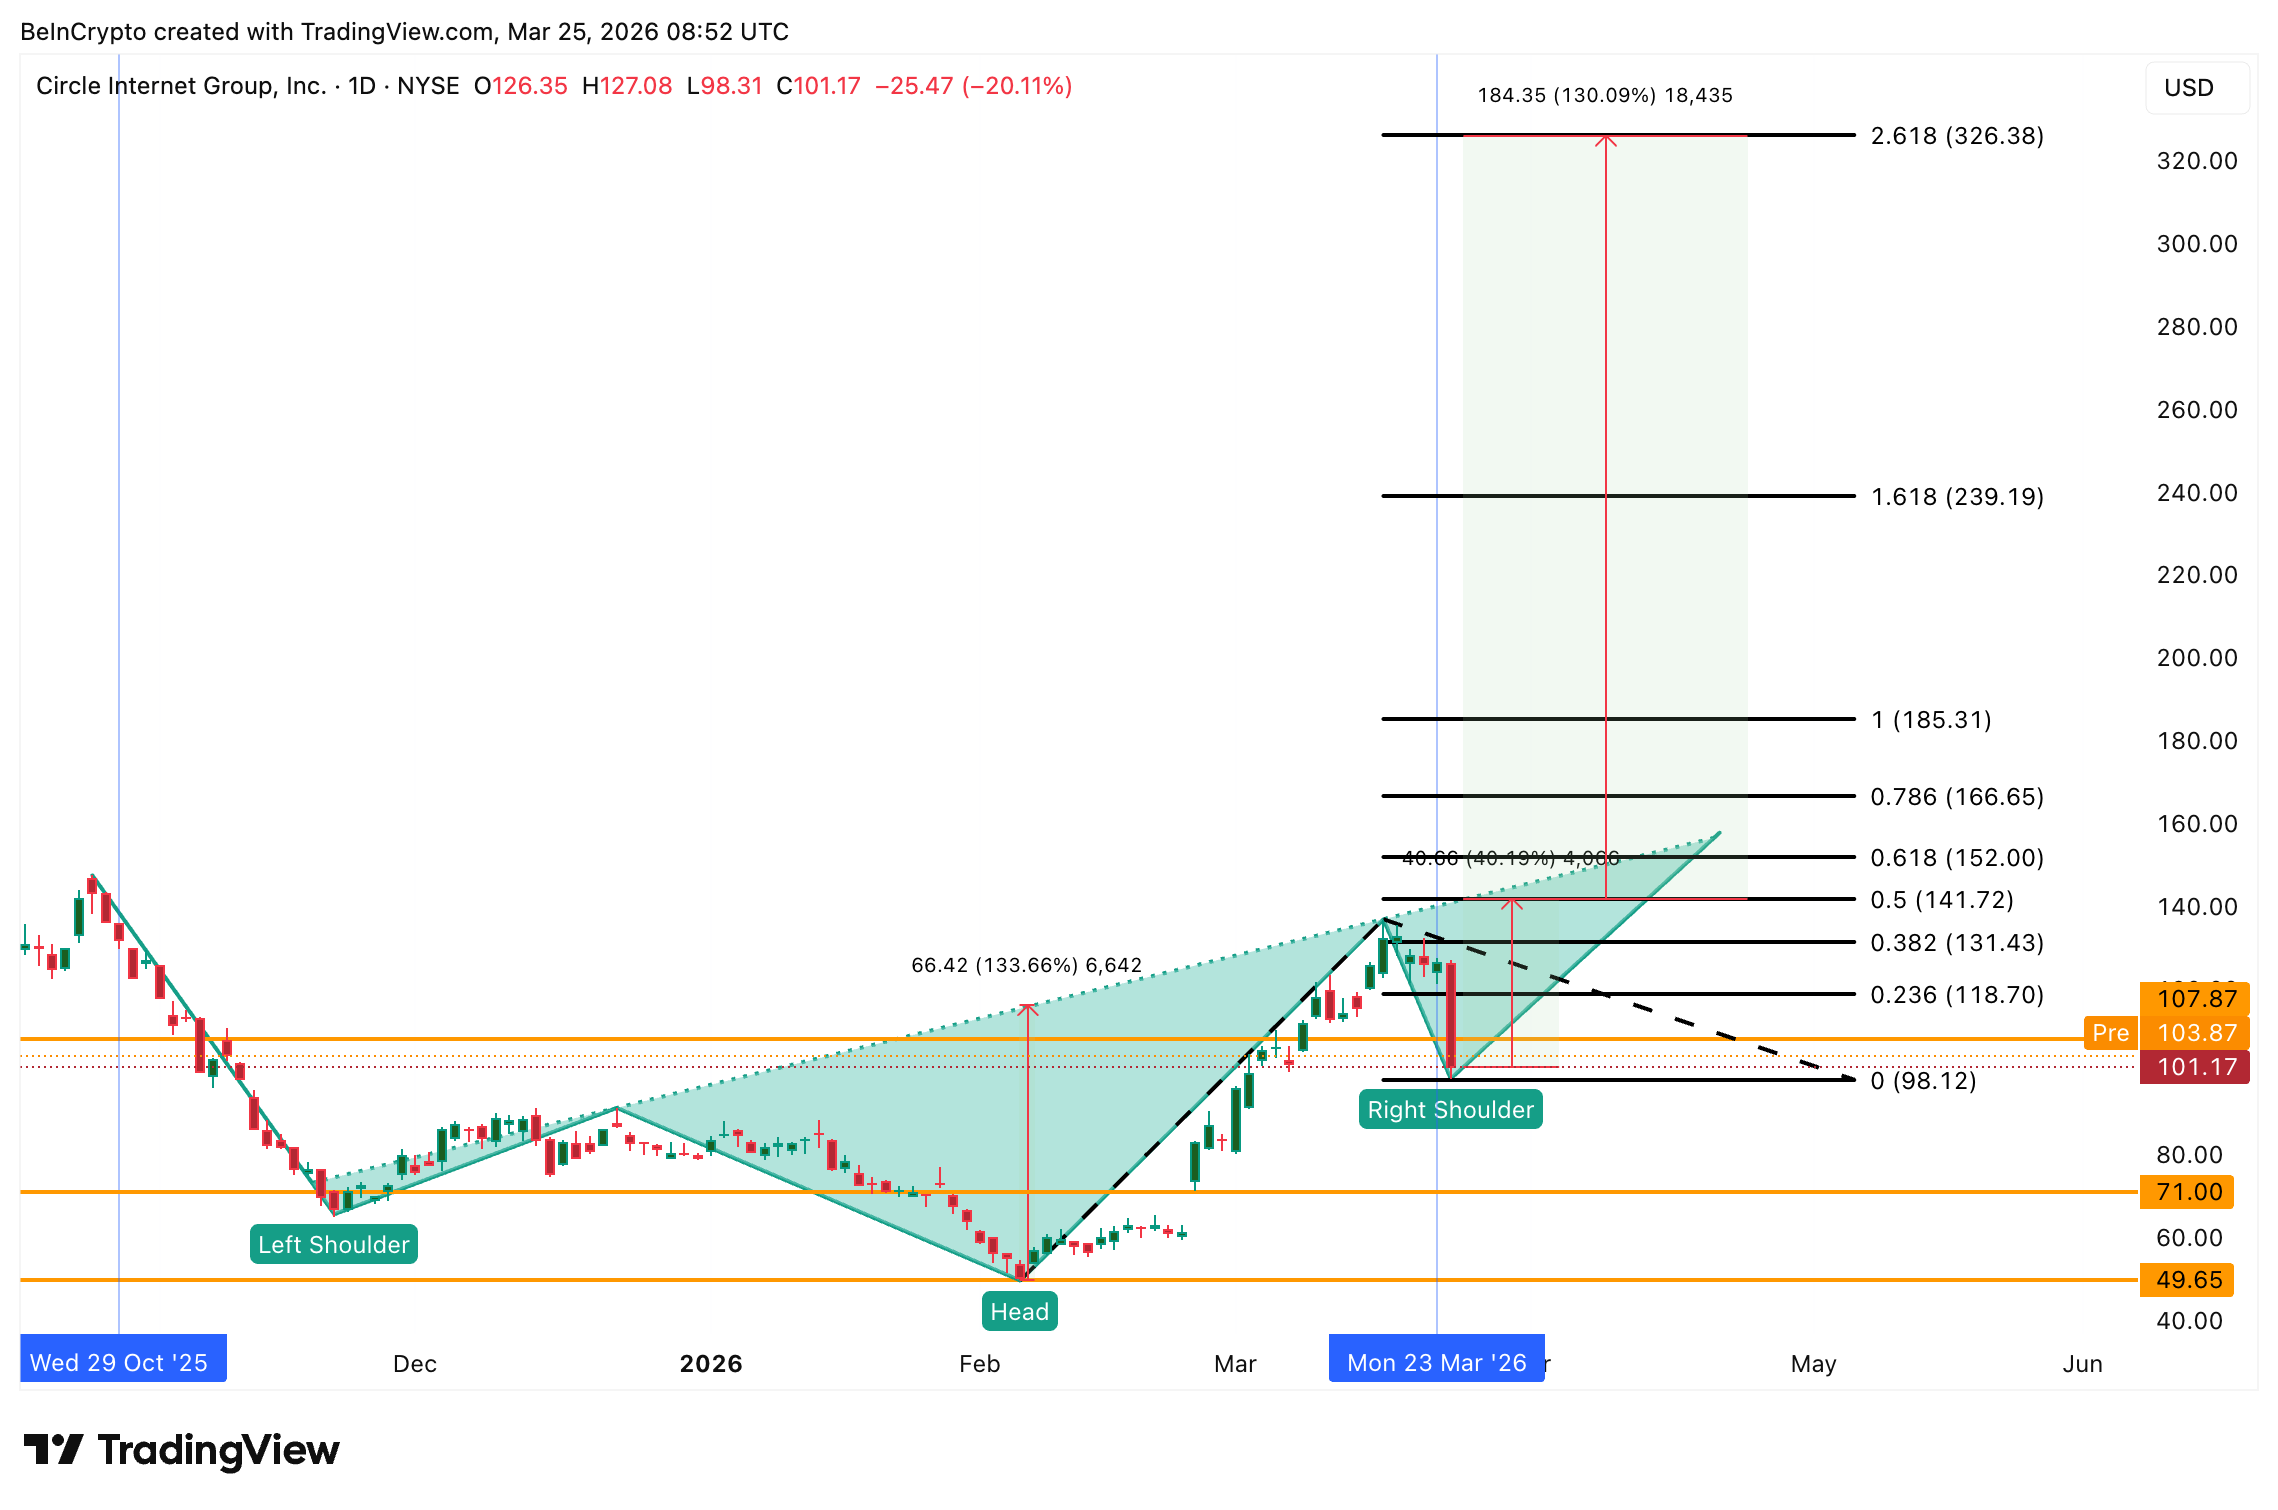
On the downside, $98 is the immediate level that must hold. A daily close below it would break the right shoulder support and the RSI divergence simultaneously. Below that, $71 becomes the secondary support, and the entire pattern is invalid only under $49 at the head.
As of now, $98 separates a bear trap recovery toward $152 from a structural breakdown toward $71.
The post CLARITY Act Yield Ban Rattles Circle Stock, but a 130% Pattern Target Survives appeared first on BeInCrypto.