
The BitMine stock price has fallen to around $19 at press time on March 6, down over 6% as Ethereum drops back under $2,000.
The BitMine price drop extends a selloff that started on March 4, with BMNR now more than 12% off its recent high. Over the past six months, the stock has remained down roughly 53%. But the ETH-linked weakness might have more layers to it than just price levels.
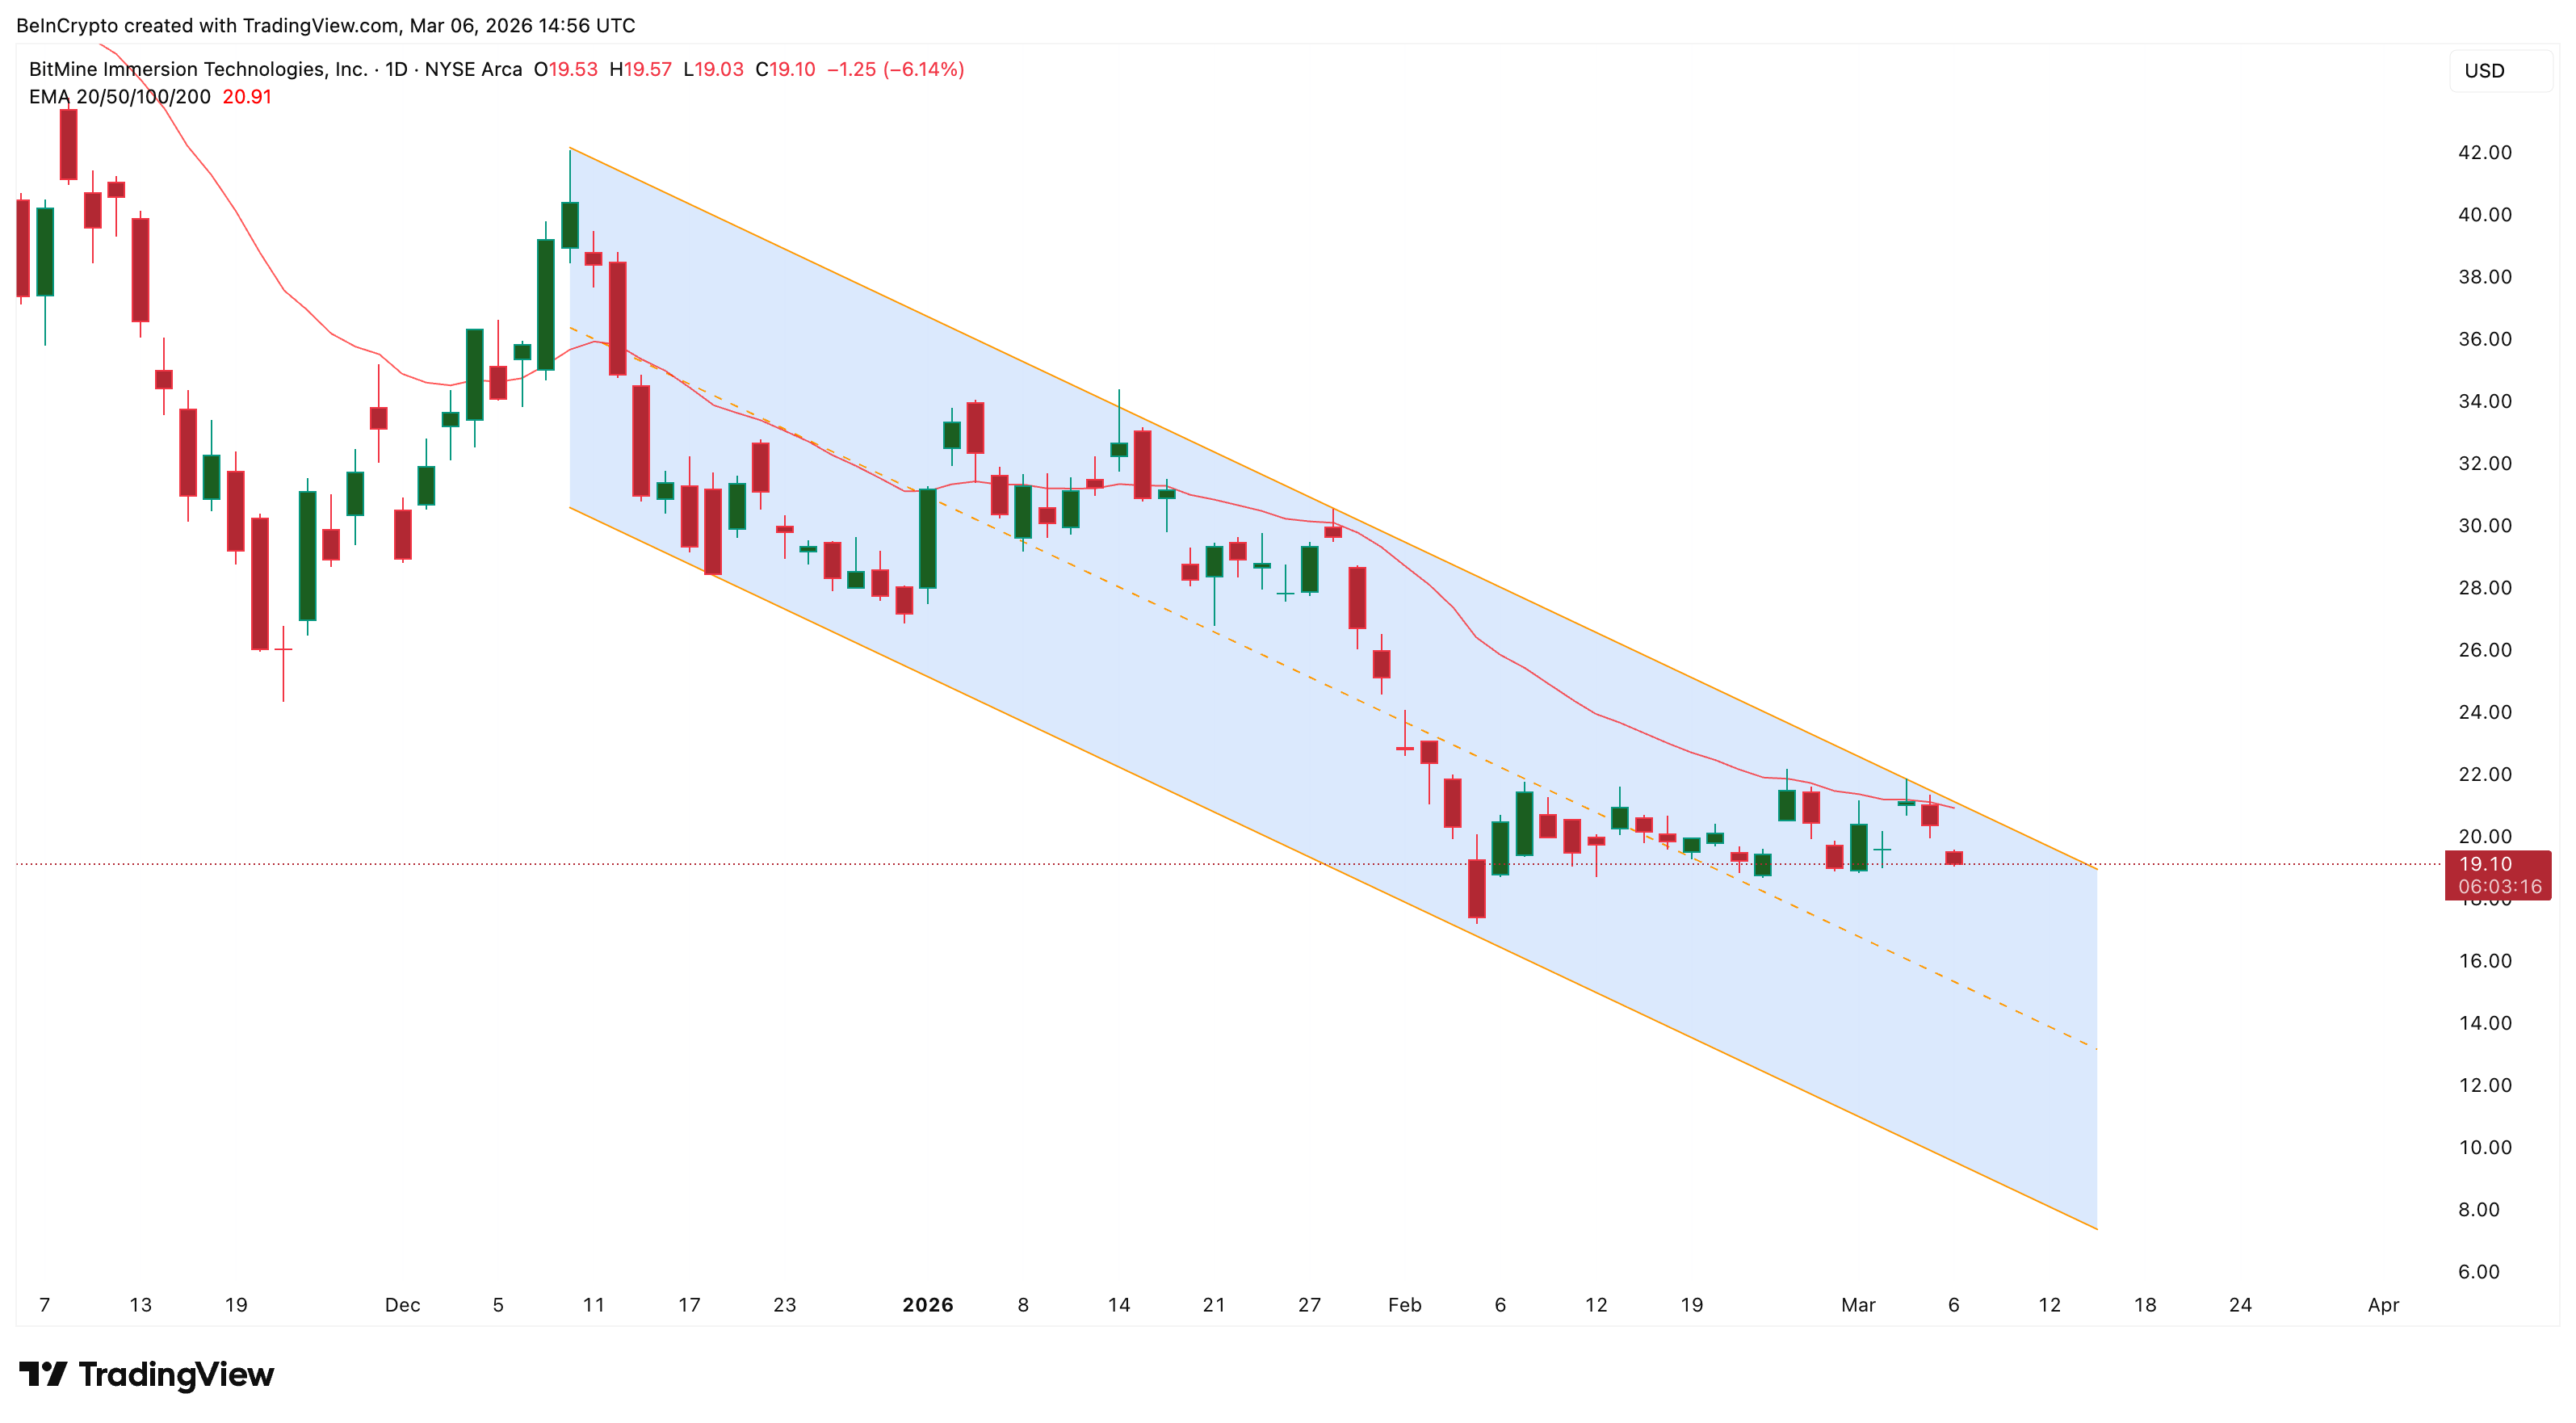
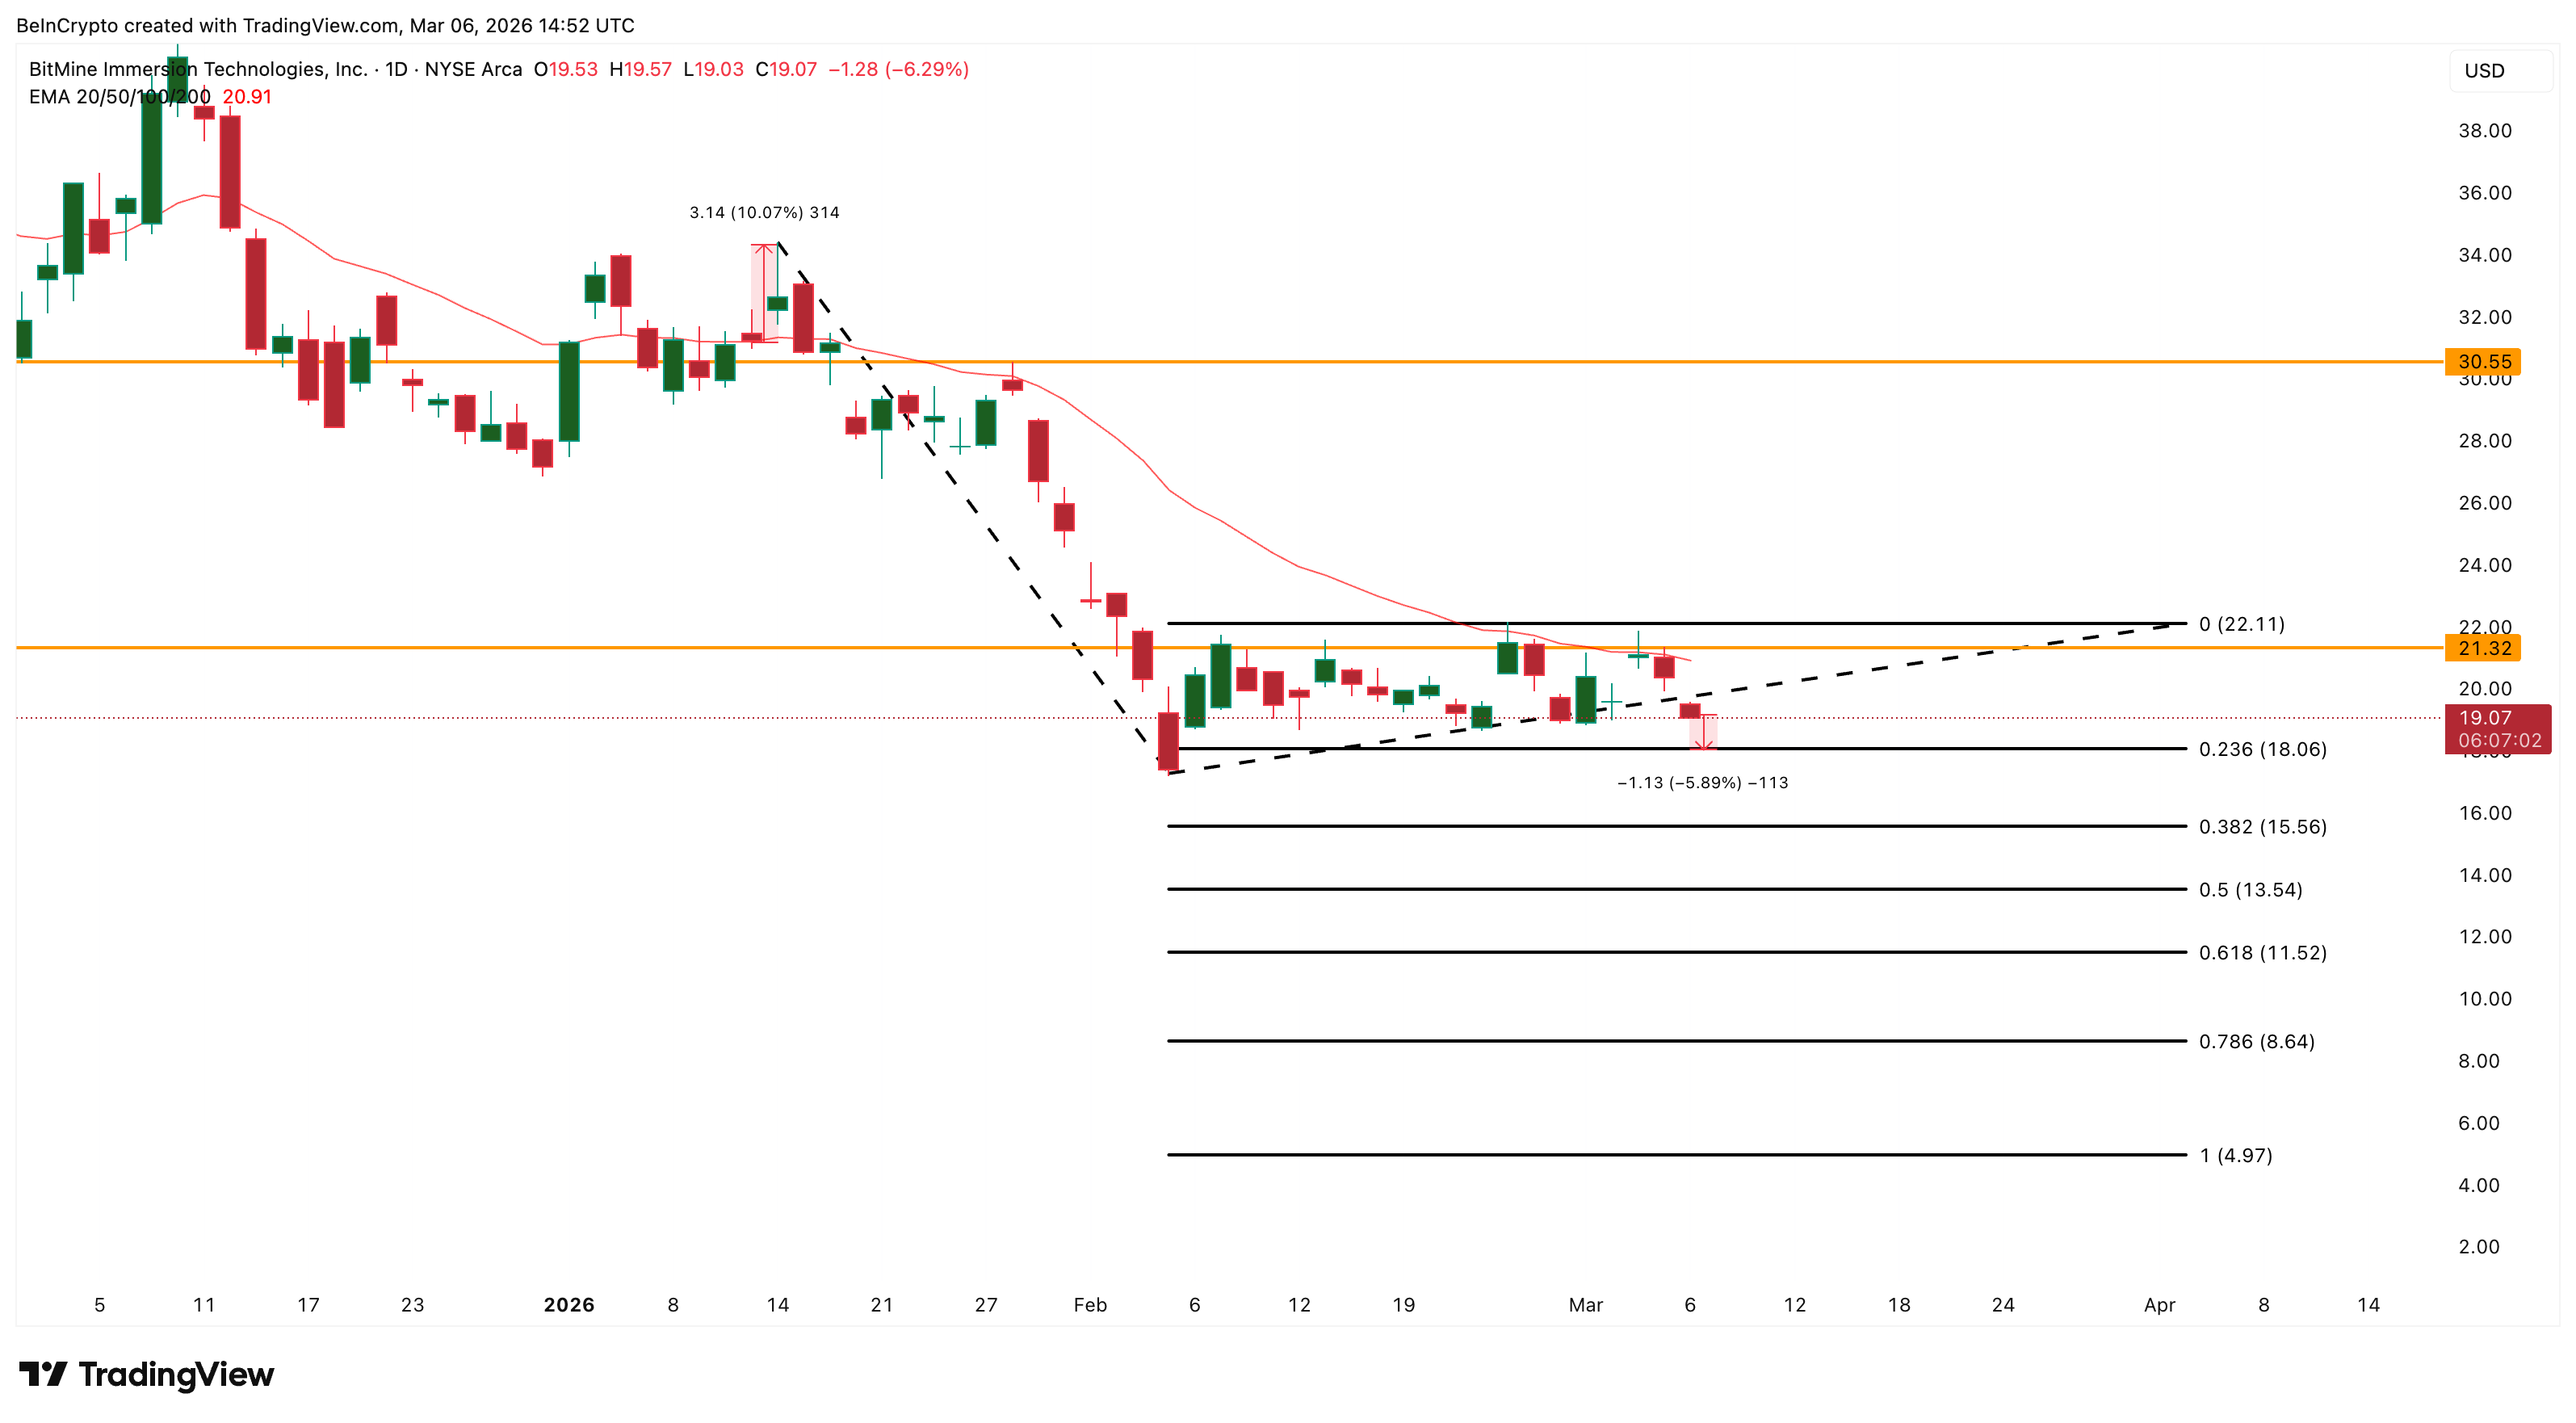
Descending Channel Keeps BitMine Stock Price Trapped, But There’s a Catch
Since December 10, the BitMine stock price has been contained inside a descending channel on the daily chart. The upper trendline has rejected the price multiple times, while the lower boundary has not broken down, keeping the bearish structure intact.
Earlier this week, Ethereum’s push above $2,100 dragged BMNR toward the channel’s upper boundary. But with ETH now back under $2,000, that move has fully reversed, and the stock is drifting lower.
What makes this setup different from a typical downtrend is the asset base underneath. BitMine holds 4.474 million ETH — about 3.71% of total supply — plus $868 million in cash and other holdings. That puts net asset value around $22.50 per share at current ETH prices.
Price-to-book ratio reads 0.85x as of March 4 (most recent quarter, or MRQ), confirming a roughly 15% discount to book value. The Price-to-book ratio compares the stock price to the per-share value of the company’s assets.
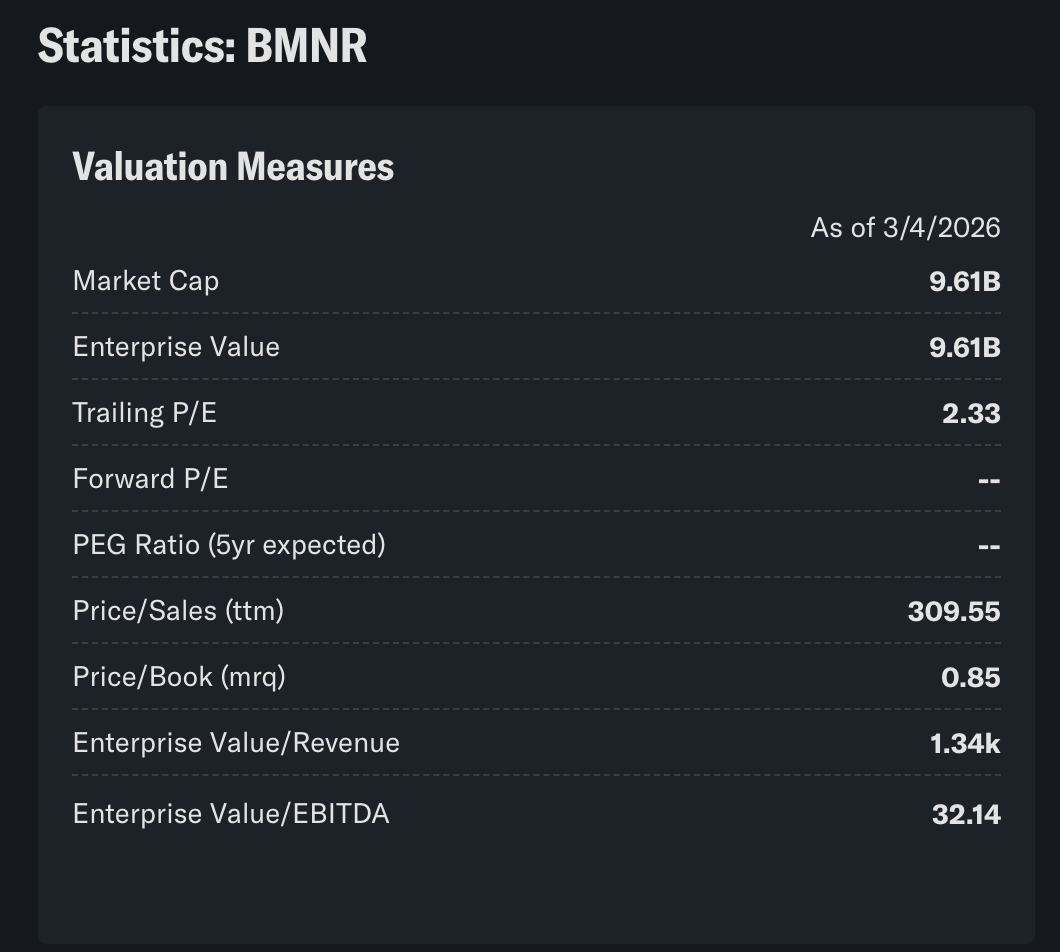
But NAV isn’t a hard floor — it slides with Ethereum. If ETH drops to $1,800, NAV compresses to around $20, and the discount nearly vanishes. At $1,500, NAV falls to roughly $17, putting even key technical supports (discussed later in the piece) above book value. The discount only holds if the Ethereum price holds.
That said, the wider the gap gets, the louder the value argument becomes for institutional buyers looking at BitMine stock as discounted ETH exposure with yield on top. And they have been eyeing this discount, validated in the next section. But first, the recent threat to the BMNR price.
Hidden Bearish Divergence Drives the Selloff — But Money Flow Tells a Different Story
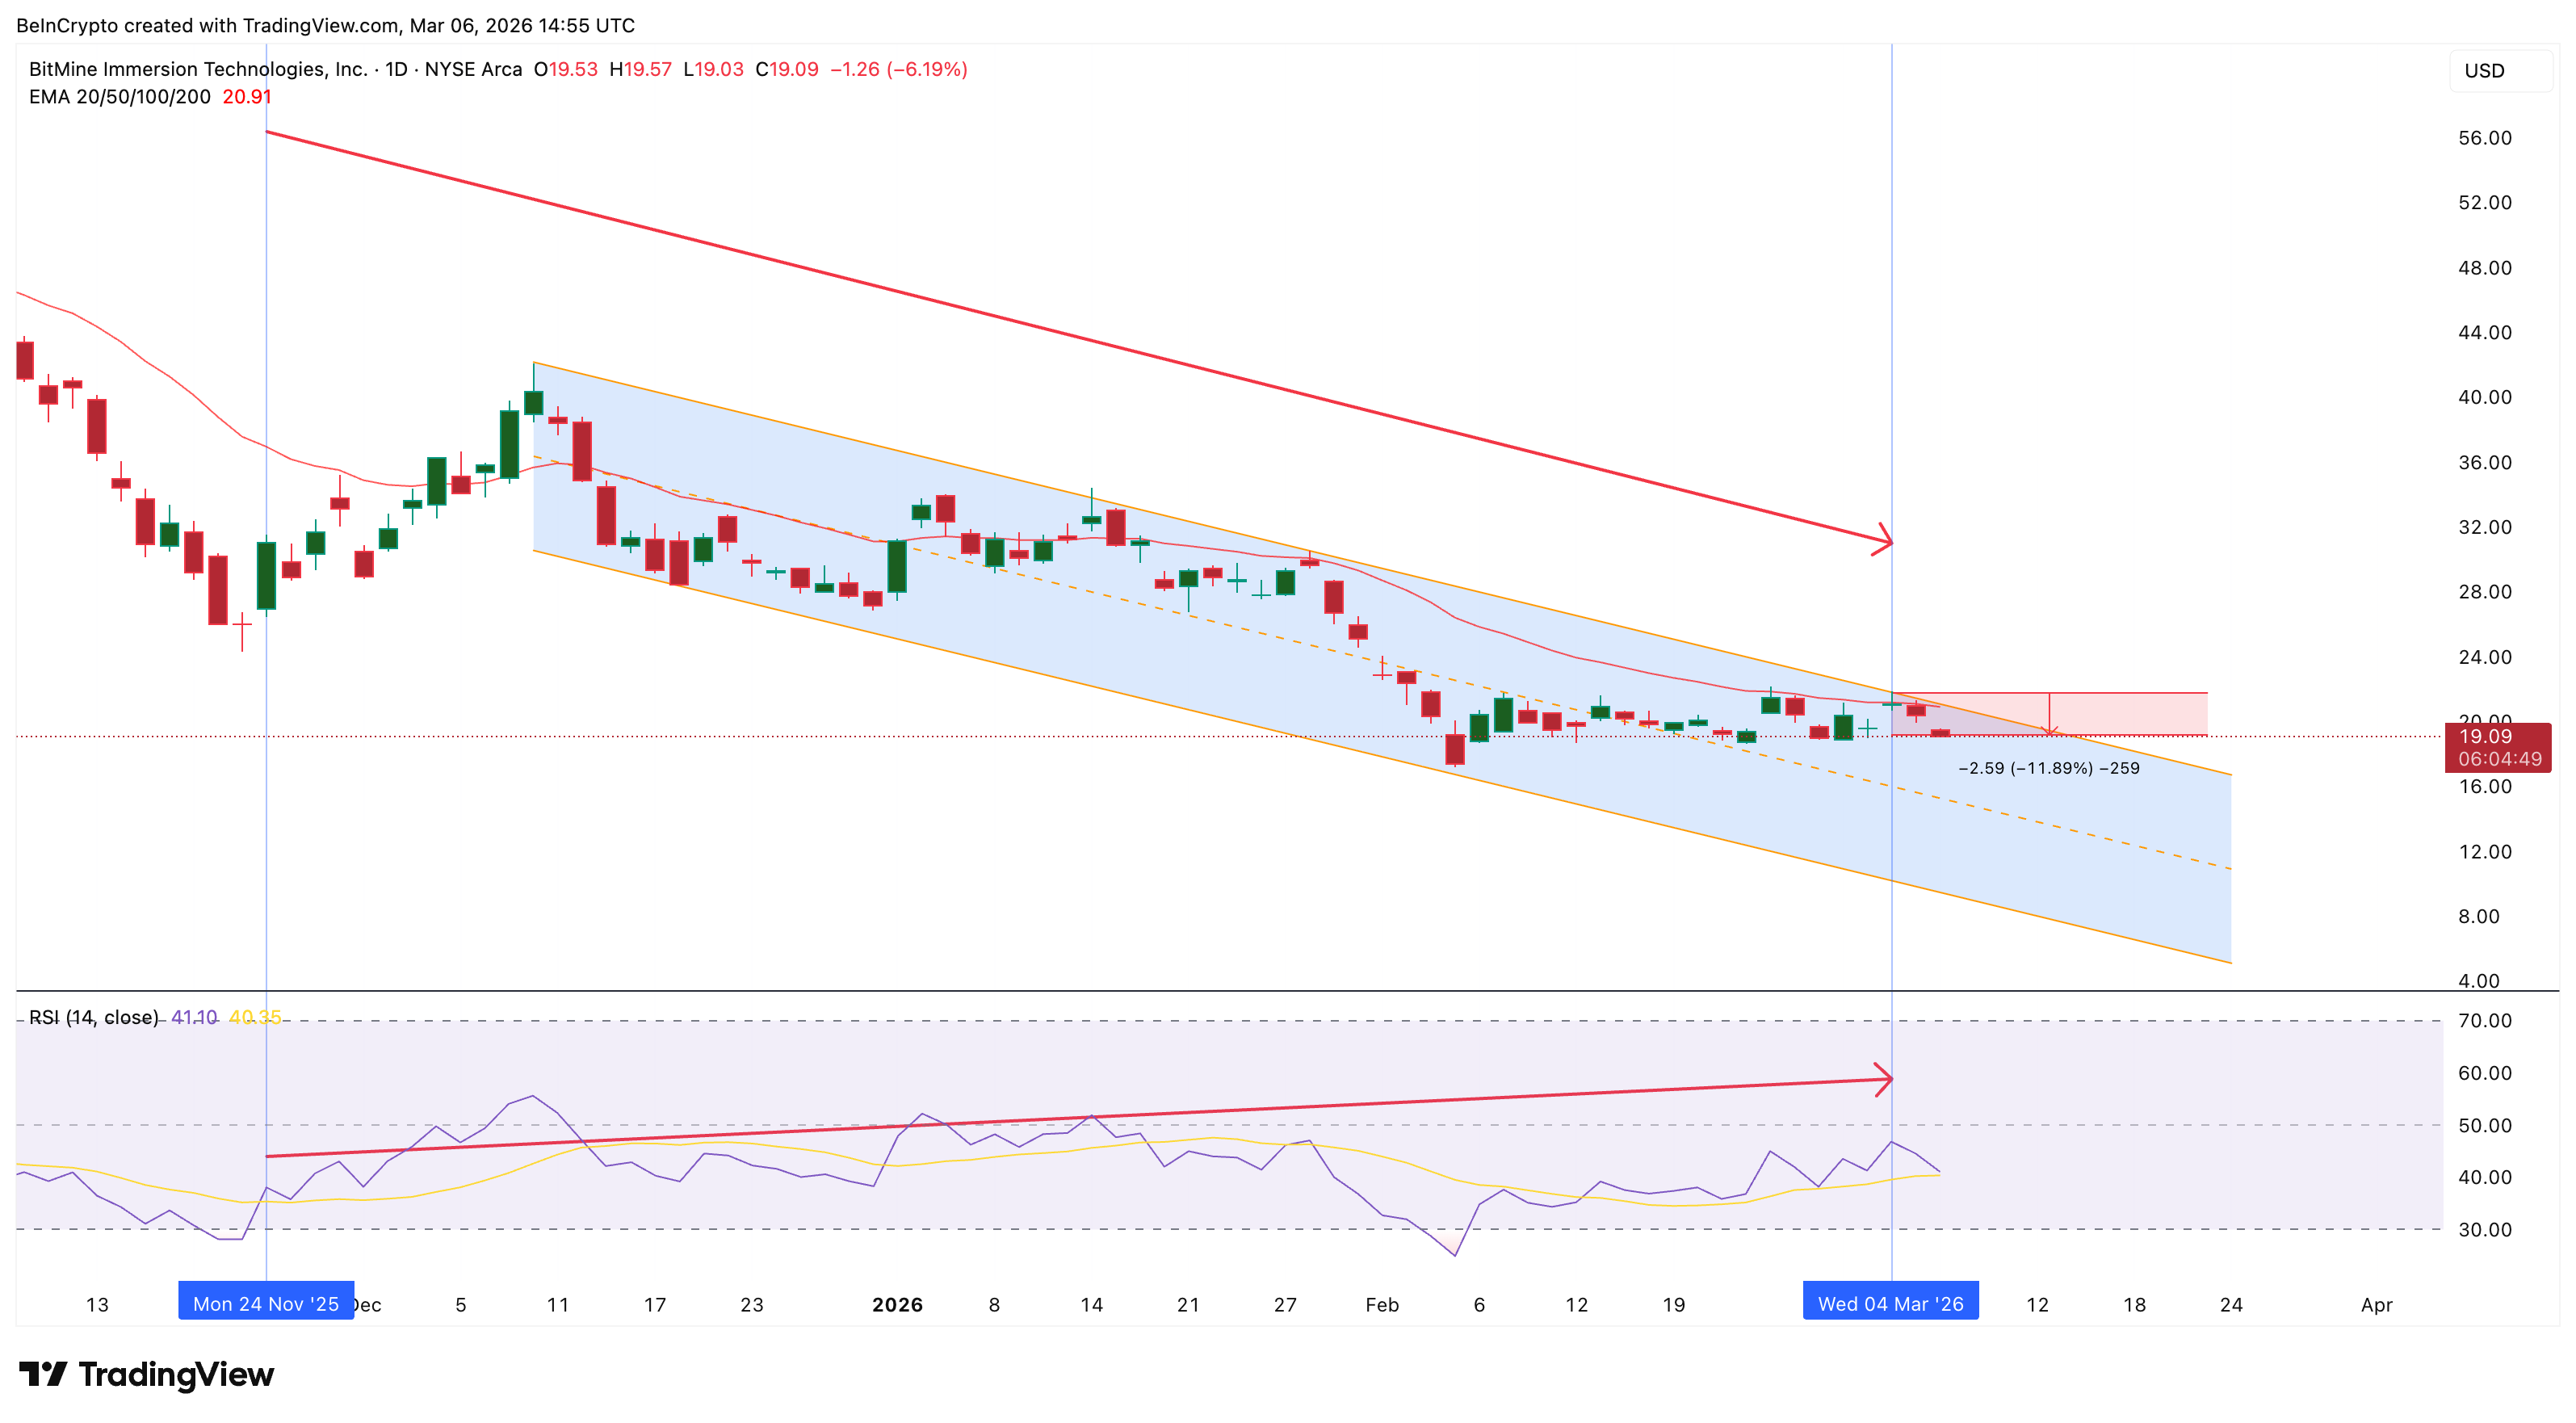
Between November 24 and March 4, BMNR’s price carved a lower high while the relative strength index (RSI), a momentum indicator, printed a higher high. It is a hidden bearish divergence, which is a continuation signal within a downtrend, pointing to further selling. It fired on March 4, and the correction has now exceeded 12%. The RSI sits at 41.10, fading below neutral with no sign of turning.
Want more insights like this? Sign up for Editor Harsh Notariya’s Daily Crypto Newsletter here.
Yet underneath this selling, institutional capital has been quietly flowing in. Between January 14 and March 3, the Chaikin Money Flow, a proxy for institutional interest, trended higher while price trended lower. This bullish divergence shows large-money accumulation during the decline, possibly eyeing the NAV-related discount.
CMF crossed above the zero line briefly on March 2, right when BitMine announced its latest purchase of 50,928 ETH worth roughly $98 million. It currently reads 0.07; still positive and has been trending higher, even as the price weakens.
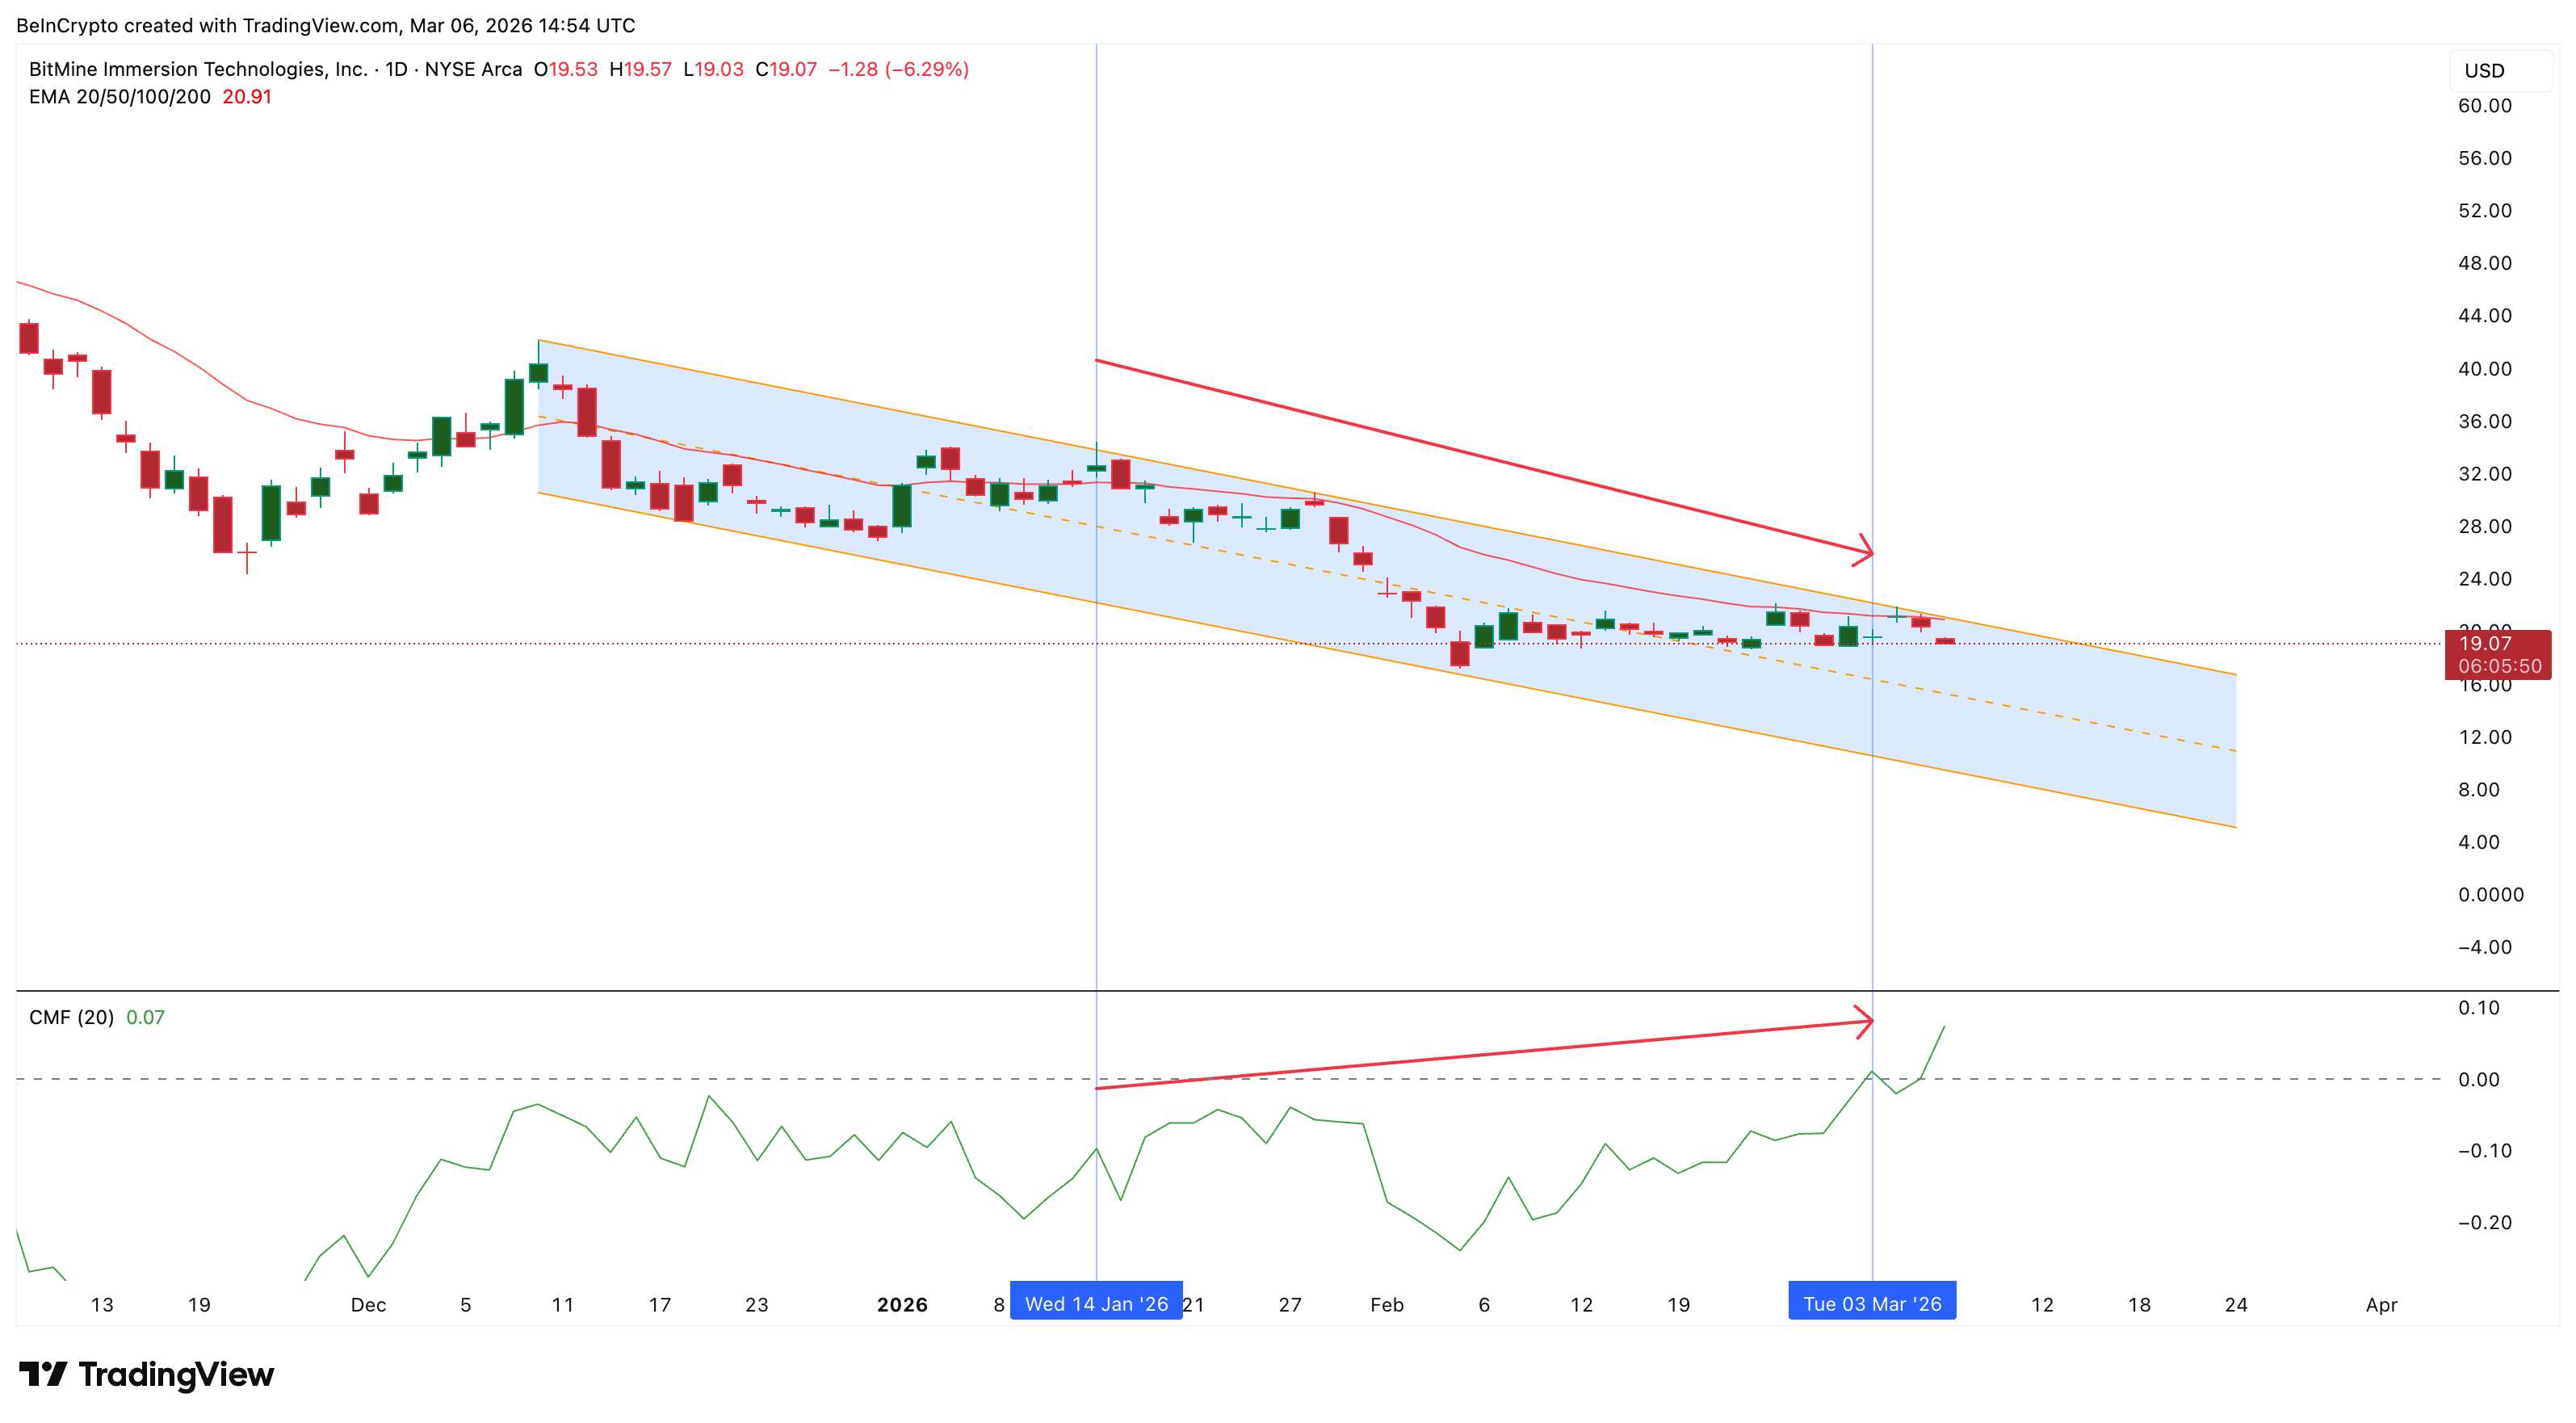
The contrast between these two signals is the story right now. The divergence is driving the price lower on momentum. The CMF says big players have been buying. They seem to be tracking the deeper NAV discount and slowly stepping in with real force.
But What Are the Big Players Really Tracking?
As mentioned earlier, if the ETH price weakens, the NAV-linked discount slowly vanishes. So if the discount itself isn’t getting more attractive on the way down, then what’s actually pulling institutional money in? What they see beyond ETH exposure is possibly staking income.
BitMine has 3.04 million ETH staked at a 2.86% yield, generating $172 million in annualized revenue. When the MAVAN validator network launches, still on track for Q1 2026, the figure scales to $253 million, or about $0.56 per share annually.
Unlike the channel, the divergence, or NAV itself, staking income doesn’t compress when Ethereum drops. It compounds regardless of spot price. That’s what makes BitMine stock structurally different from MSTR, where Bitcoin generates zero yield, and there’s nothing underneath when prices fall.
$18 Is Where It Gets Interesting For the BitMine Stock Price
At $19, BitMine stock sits just 6% above the key technical level at $18. A daily close below that mark opens $15 as the next downside target.
But $18 is also the zone where the NAV math starts getting loud. At that price, with ETH near $2,000, the stock would trade at a roughly 20% discount to book value, provided ETH doesn’t drop deeper. That’s the kind of gap where institutional buyers who have been patient on the CMF signal could start stepping in with real conviction, drawn by both the discount and the $0.56 per share in annual staking cash flow.
On the upside, $22 is the level that changes everything. The 20 EMA stands slightly lower and has acted as resistance on every recent bounce. The last successful EMA reclaim occurred around January 13, triggering a roughly 10% rally. Getting back above $22 would clear both the EMA and the key technical level where NAV, the moving average, and the channel’s upper zone all converge.
At press time, the bearish divergence is in full effect while CMF stays positive but lacks urgency. The next catalyst is BitMine’s weekly ETH purchase update, expected around March 9.
But for the BitMine stock price in general, the ETH price structure will also matter.
The post BitMine (BMNR) Stock Slides Under $20 on ETH-Linked Weakness — How Low Can It Go? appeared first on BeInCrypto.