Bitcoin trades near $87,820, flat on the day and still down about 4% over the last 30 days. Buyers appear at every Bitcoin price dip, but each bounce has failed to move outside the same narrow range. The chart now shows a clear reason why attempts keep stalling.
The short answer: Bitcoin’s unlucky 13 problem. A key on-chain resistance level sits 13% above the current price, and until it breaks, upside keeps fading before momentum can form.
Short-Term Holders Set the Ceiling With A Cost Basis Hurdle
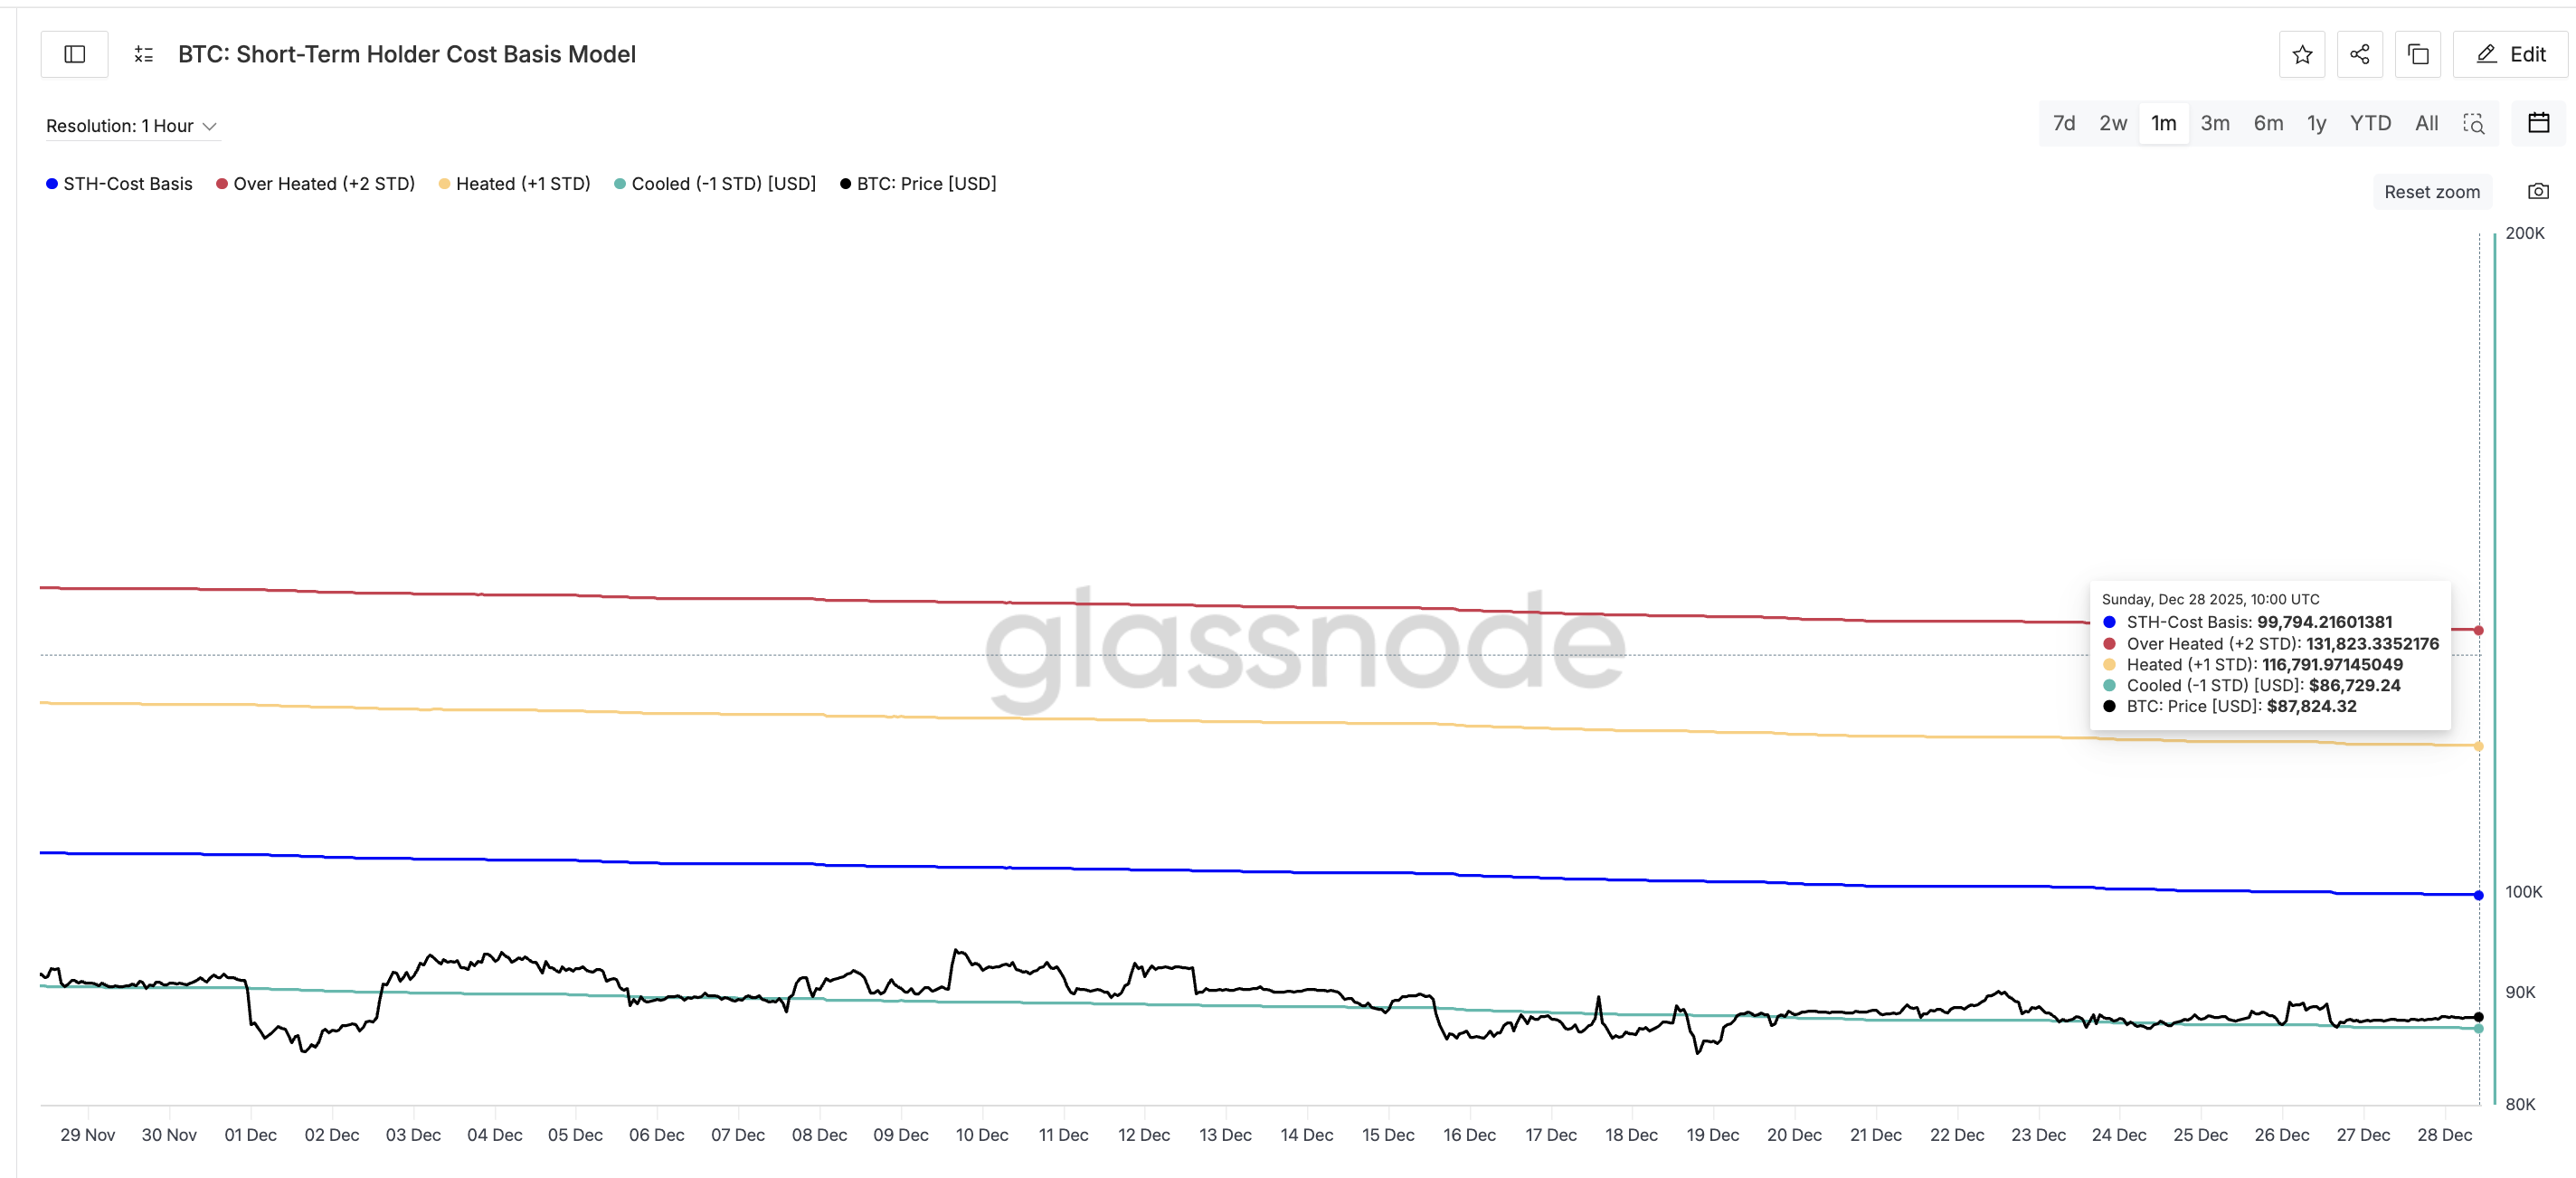
Glassnode’s Short-Term Holder Cost Basis model tracks the average price where recent buyers hold coins. Short-term holders usually react fastest to volatility. When prices trade below their entry, they sell to avoid deeper losses. This creates an automatic layer of sell pressure that acts like a ceiling on the chart.
Right now, that cost basis sits at $99,790, roughly 13% above spot. At $87,820 (current price), most recent buyers are underwater. This explains why every Bitcoin rally fades before it can build toward a breakout: sellers keep stepping in early.
Want more token insights like this? Sign up for Editor Harsh Notariya’s Daily Crypto Newsletter here.
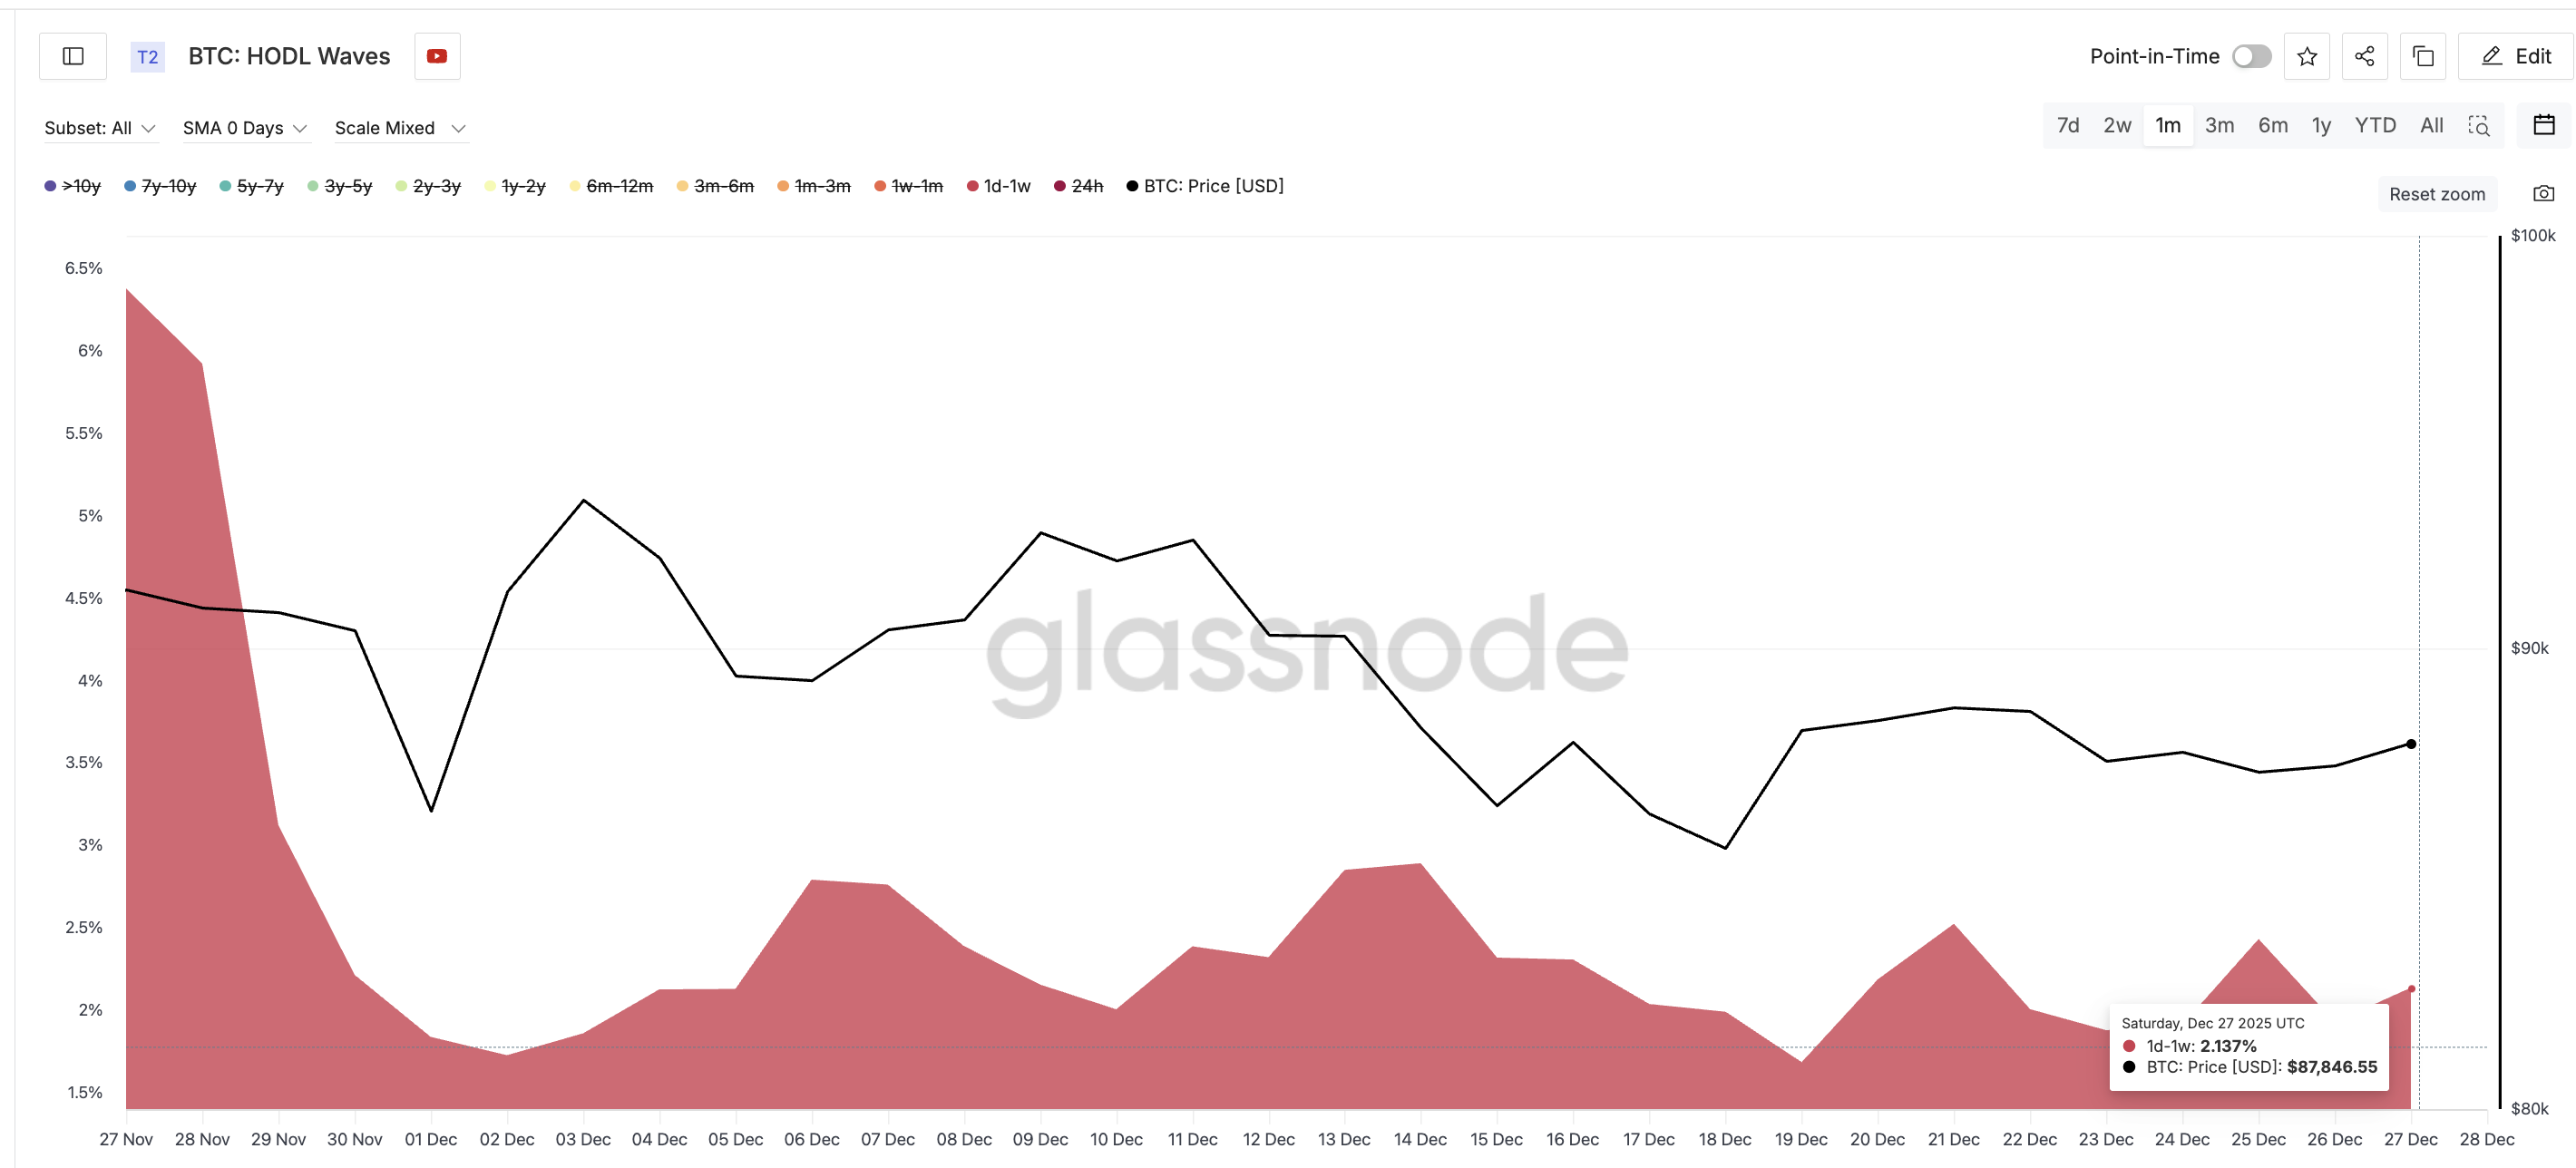
HODL Waves data, a metric that segregates cohorts by holding age, confirms this behavior. The 1-day to 1-week cohort (short-term cohort) dropped from 6.38% of supply on November 27 to 2.13% on December 27. These newer buyers are offloading coins rather than holding them, which reinforces resistance before Bitcoin even reaches $99,790.
This makes $99,790 the most important resistance on Bitcoin’s chart, in the near term. It is worth noting that this on-chain resistance level is dynamic and could shift depending on the spot price. Therefore, we would also want a level verification on the technical chart.
If price reclaims it, short-term holders flip into profit, forced selling probably stops, and the supply pressure that blocked every bounce begins to fade.
Momentum Shows Buyers Trying, But Not Enough To Break Out
On the 12-hour chart, Bitcoin trades inside a symmetrical triangle. A symmetrical triangle forms when lower highs and higher lows compress into a point, signaling indecision between buyers and sellers. It is a neutral pattern that needs a breakout to confirm direction.
The Chaikin Money Flow (CMF) measures whether big money is flowing into or out of the market by tracking volume pressure. CMF is rising with price, which means buyers are participating, but it remains below the zero line.
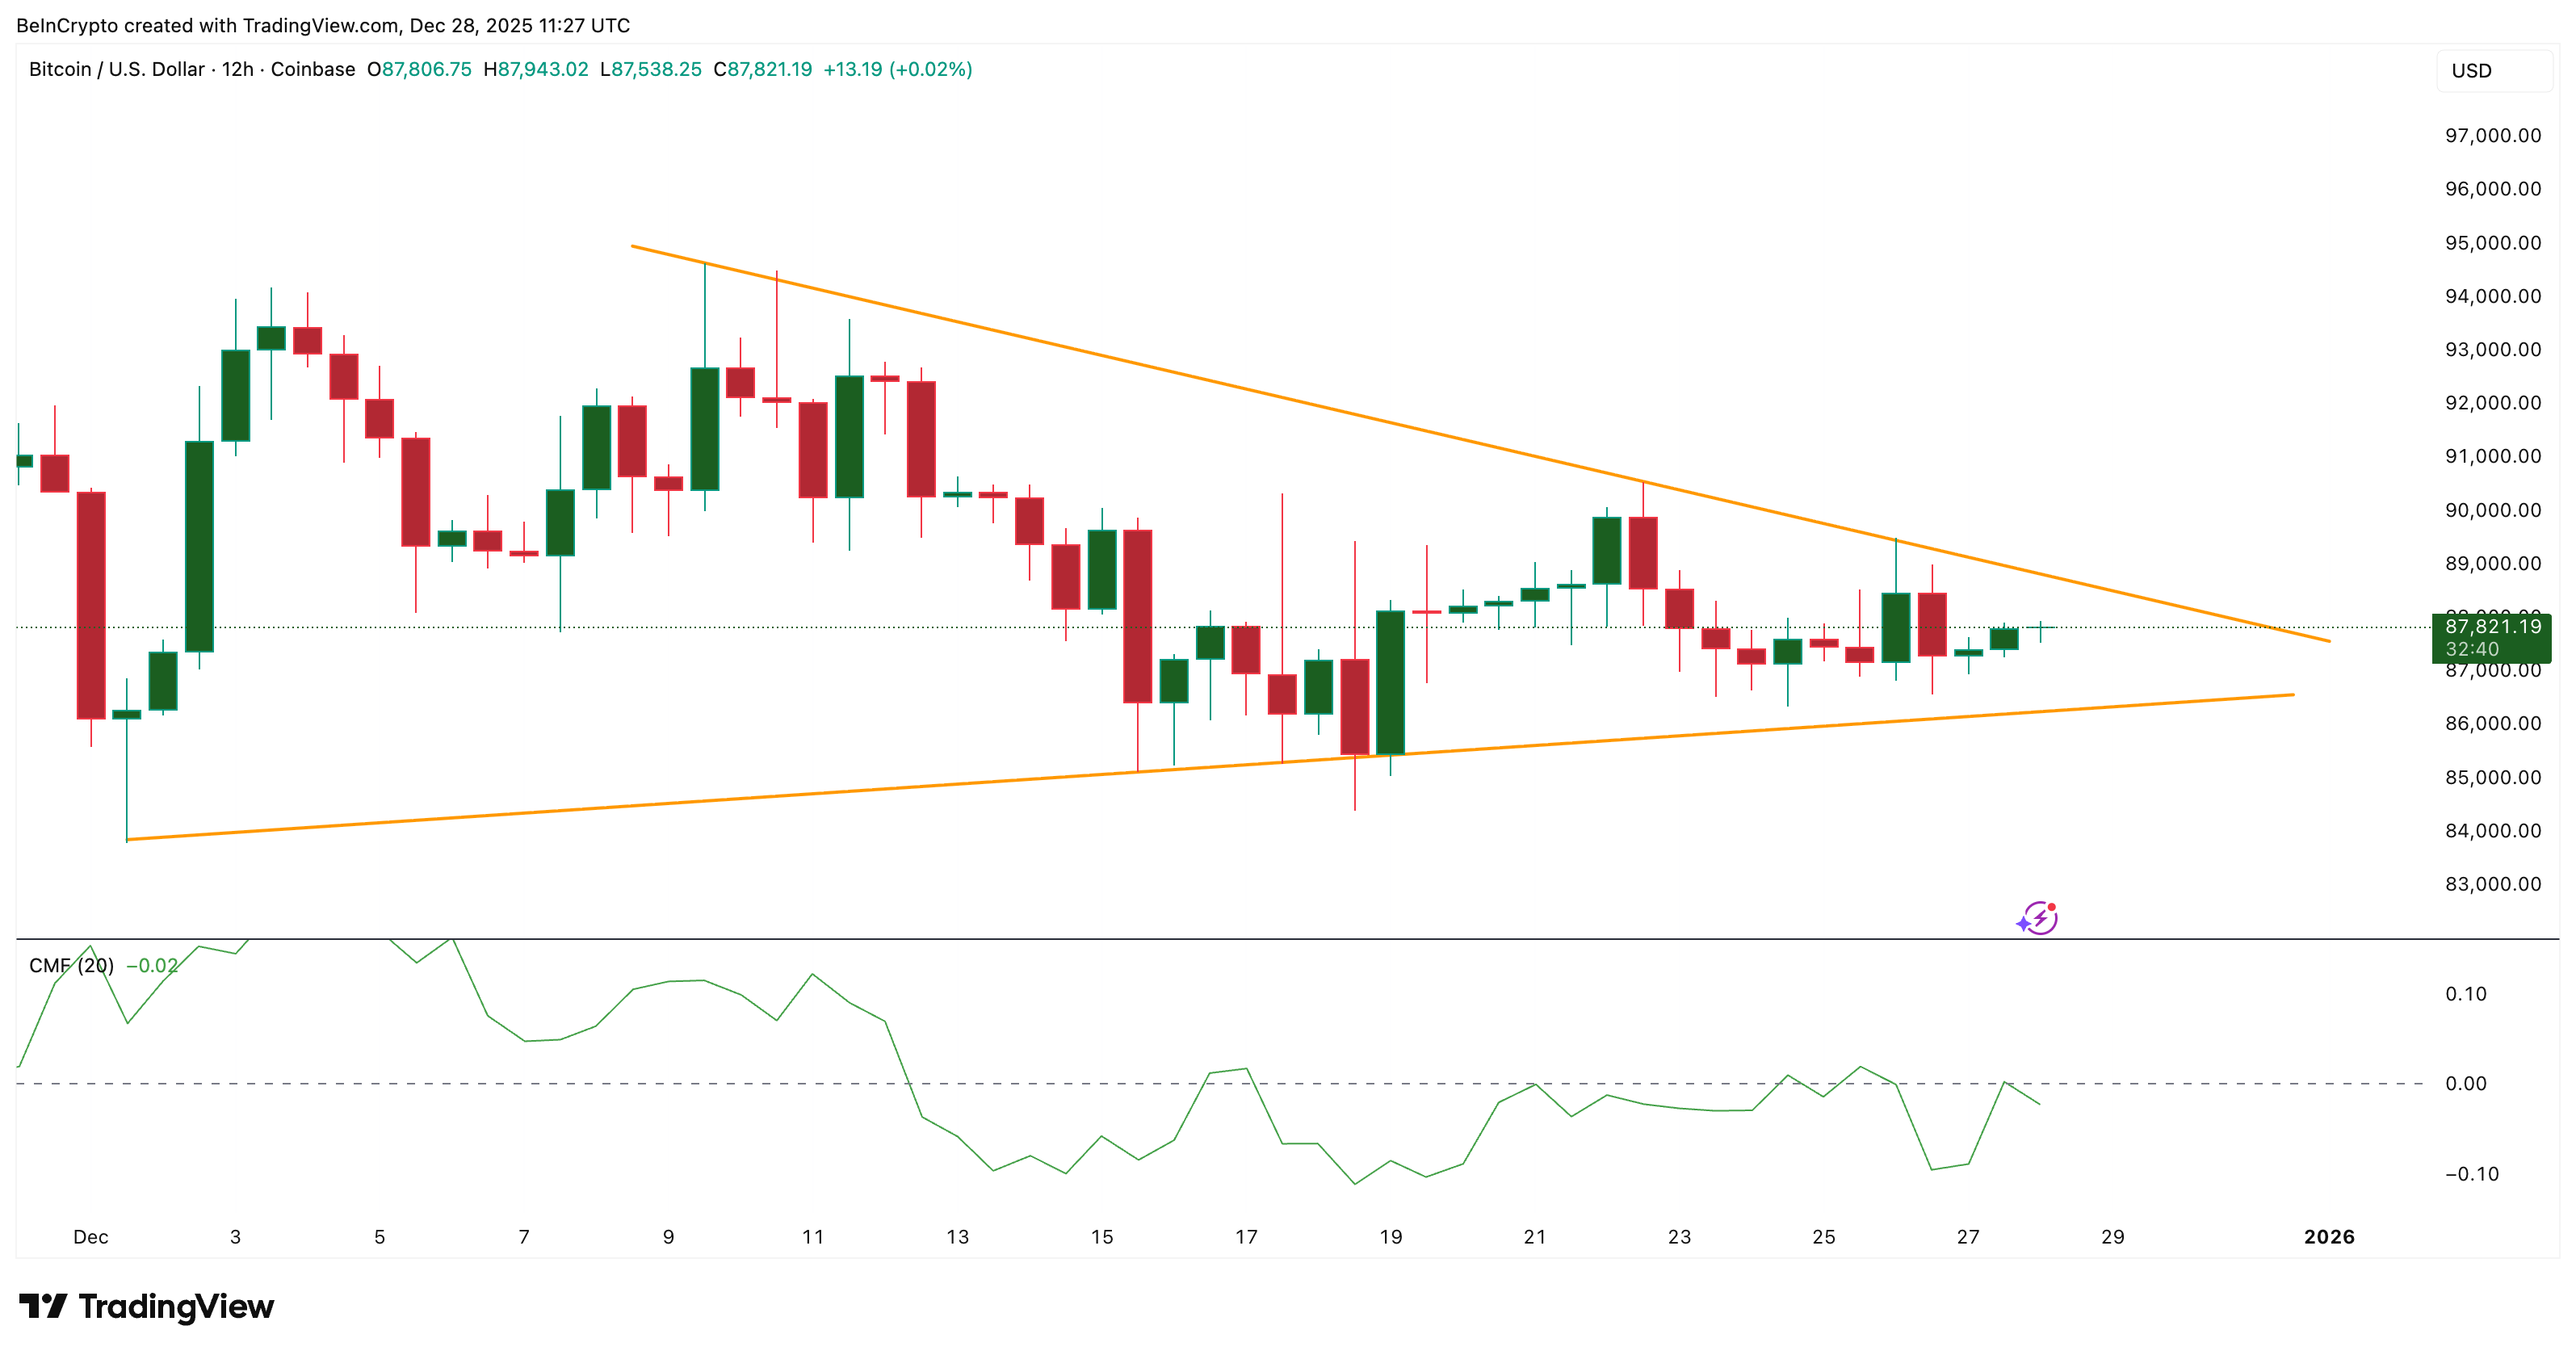
A CMF below zero means inflows are not strong enough to confirm trend strength, so momentum alone cannot break the upper trendline of the triangle yet.
This explains the hesitation in the structure. Buyers are present, but they have not tipped the balance. Until CMF closes above zero and price escapes the triangle, the pattern signals effort without control. And the BTC price would keep getting pushed into the range courtesy of the short-term selling pressure.
Bitcoin Price Levels Also Show the 13% Barrier and Why It Matters
Bitcoin has been stuck between $84,370 and $90,540 for most of late December. Every approach toward $90,540 fades as underwater holders exit to minimize losses. This aligns directly with the short-term cost basis ceiling.
For now, the roadmap is straightforward.
A move above $94,600 would be the first sign that buyers are making progress. If price continues higher and reclaims $99,820 (near the short-term holder cost basis level from earlier), the unlucky 13 barrier breaks, short-term holders recover, and the selling pressure that stalled every bounce finally weakens. That would then turn the Bitcoin price action bullish.
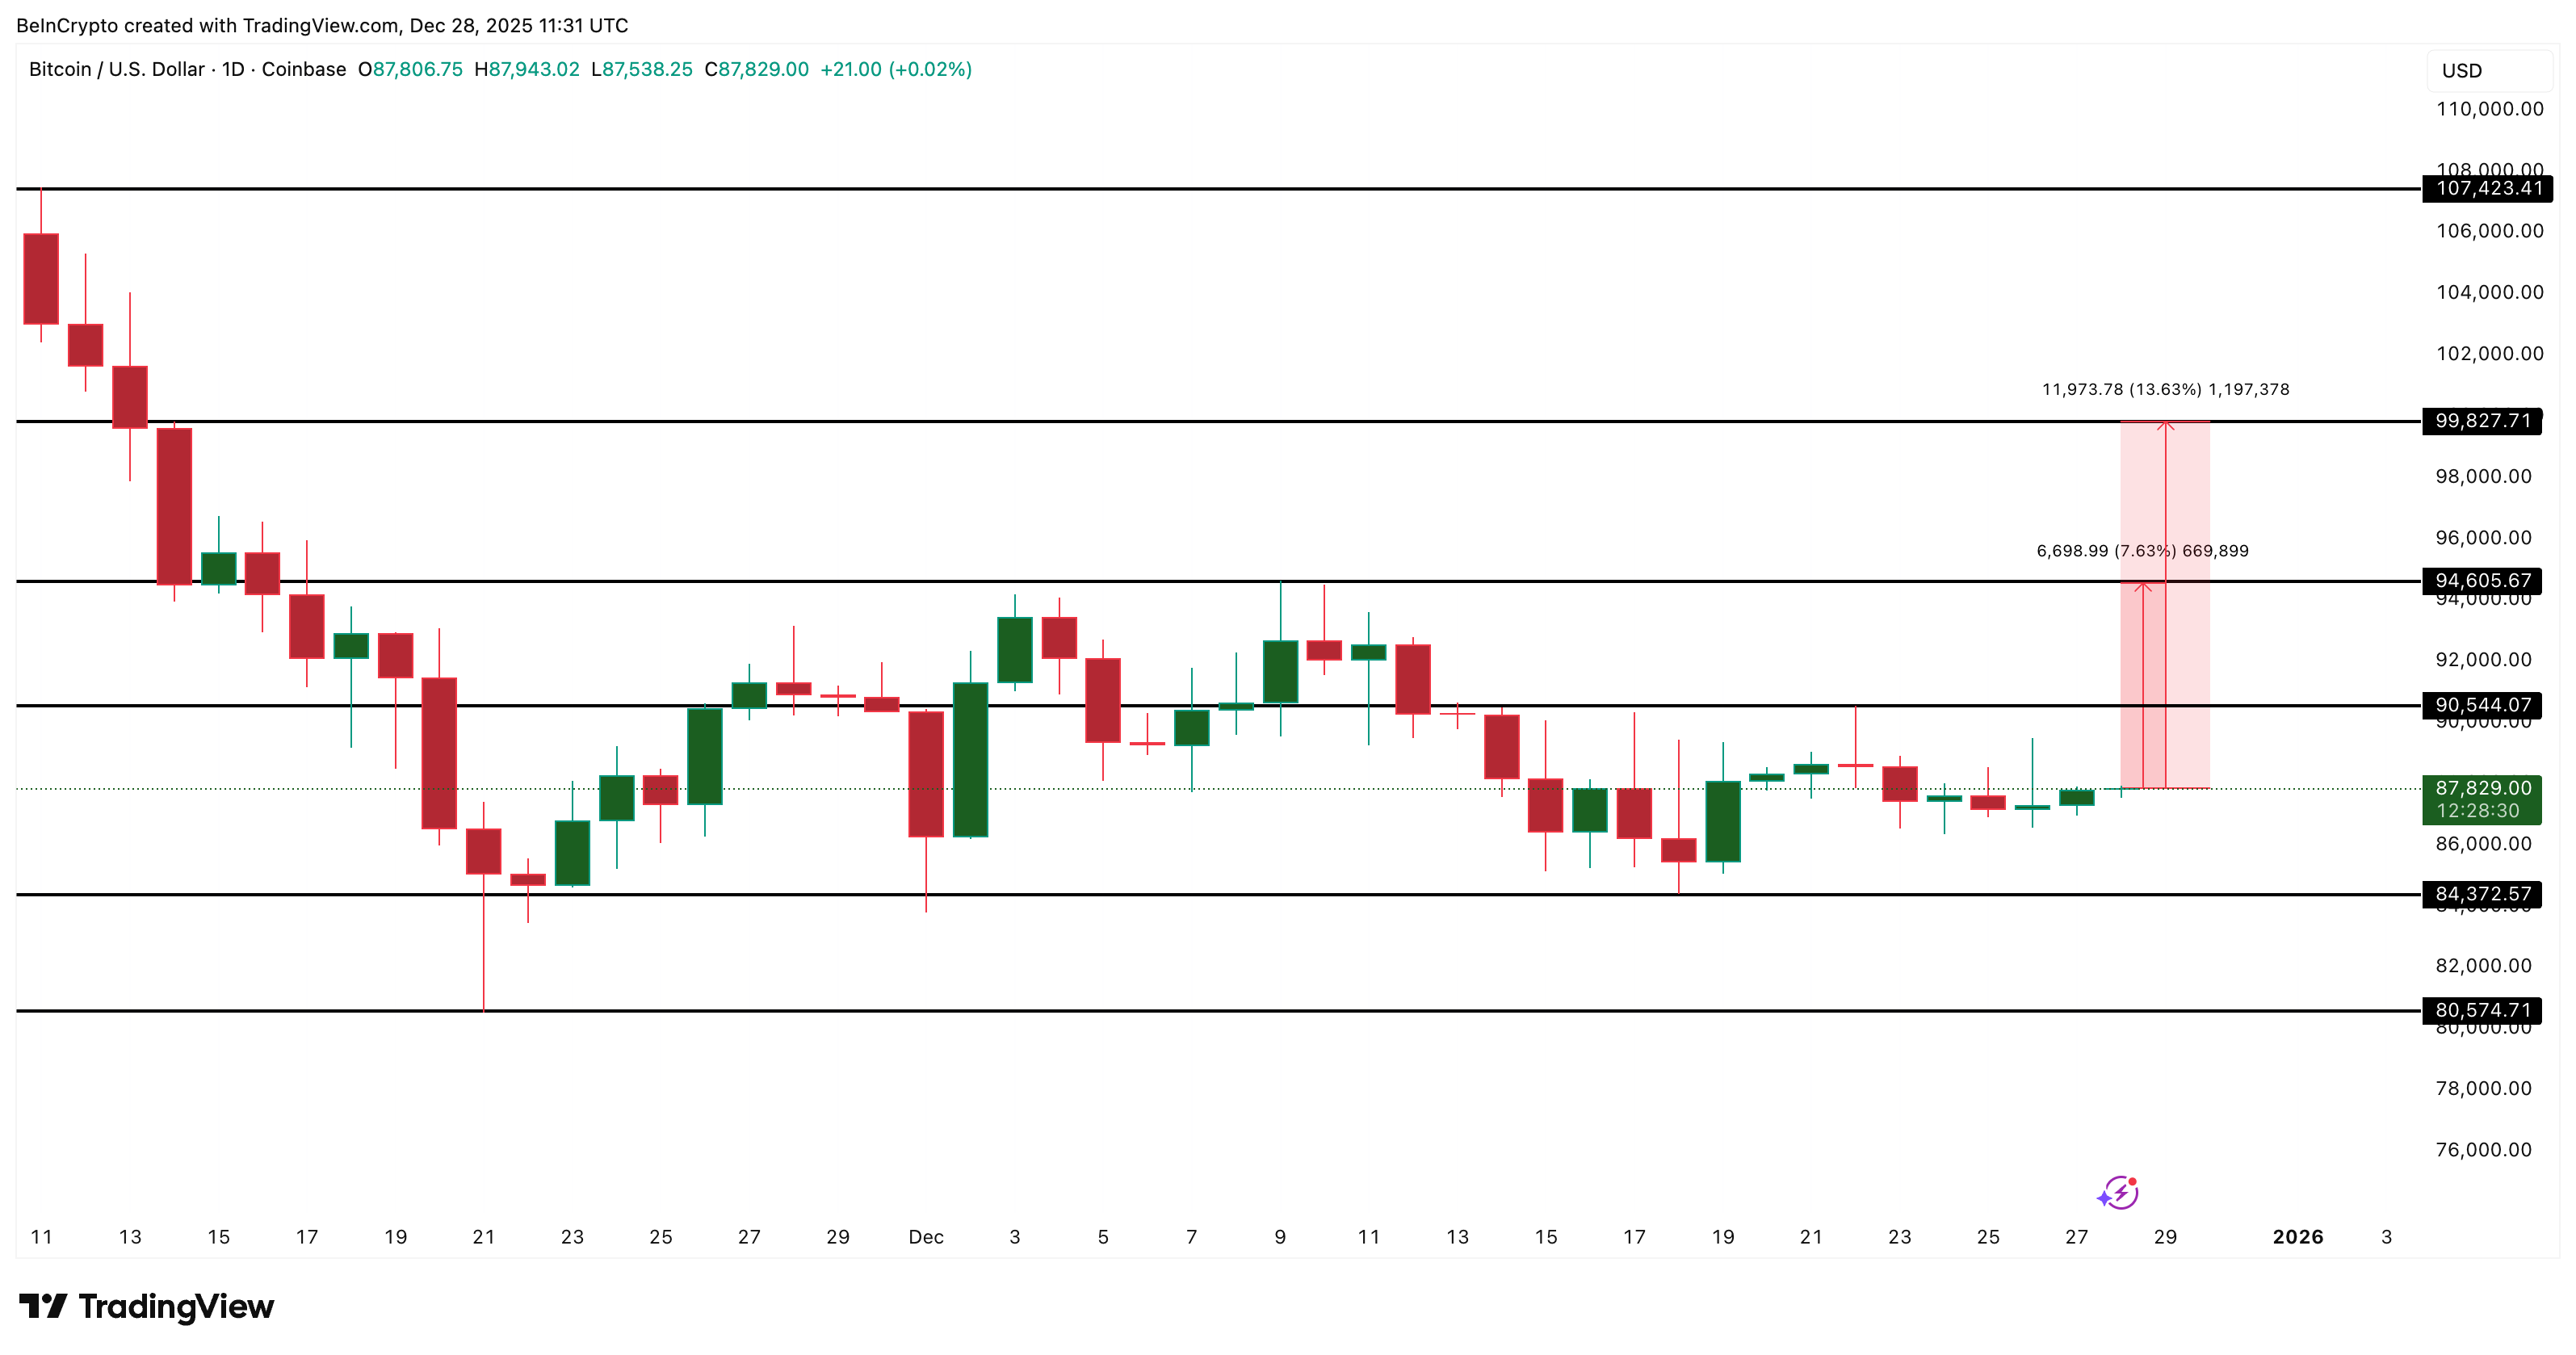
From there, $107,420 becomes the next magnet. If buyers cannot defend momentum, then $84,370 becomes the first support to watch. A daily close below $80,570 would confirm a breakdown, reset the trend expectation for January, and extend the range lower.
The post Bitcoin’s ‘Unlucky 13 Problem’ Explained: Here’s Why Every Price Bounce Keeps Failing appeared first on BeInCrypto.