
Bitcoin (BTC) is trading near $74,500 after a sharp recovery from early April lows, but multiple technical signals across timeframes suggest the rally may be losing steam at a historically significant resistance zone.
The move marks a recovery of over 15% from the $64,000 area touched in early April, reigniting hopes of a broader trend reversal. Yet with price now wedged between a rising channel ceiling and a well-established supply zone, bulls will need to prove their conviction with a decisive breakout — or risk handing control back to the bears.
Ascending Channel Meets Key Resistance
On the daily chart, Bitcoin has been trading inside an ascending parallel channel since the February low near $62,000, steadily printing higher lows.
Price is now moving towards the upper boundary of that channel while simultaneously testing a major resistance box between $74,000 and $76,000 — a level that already rejected price in mid-March.
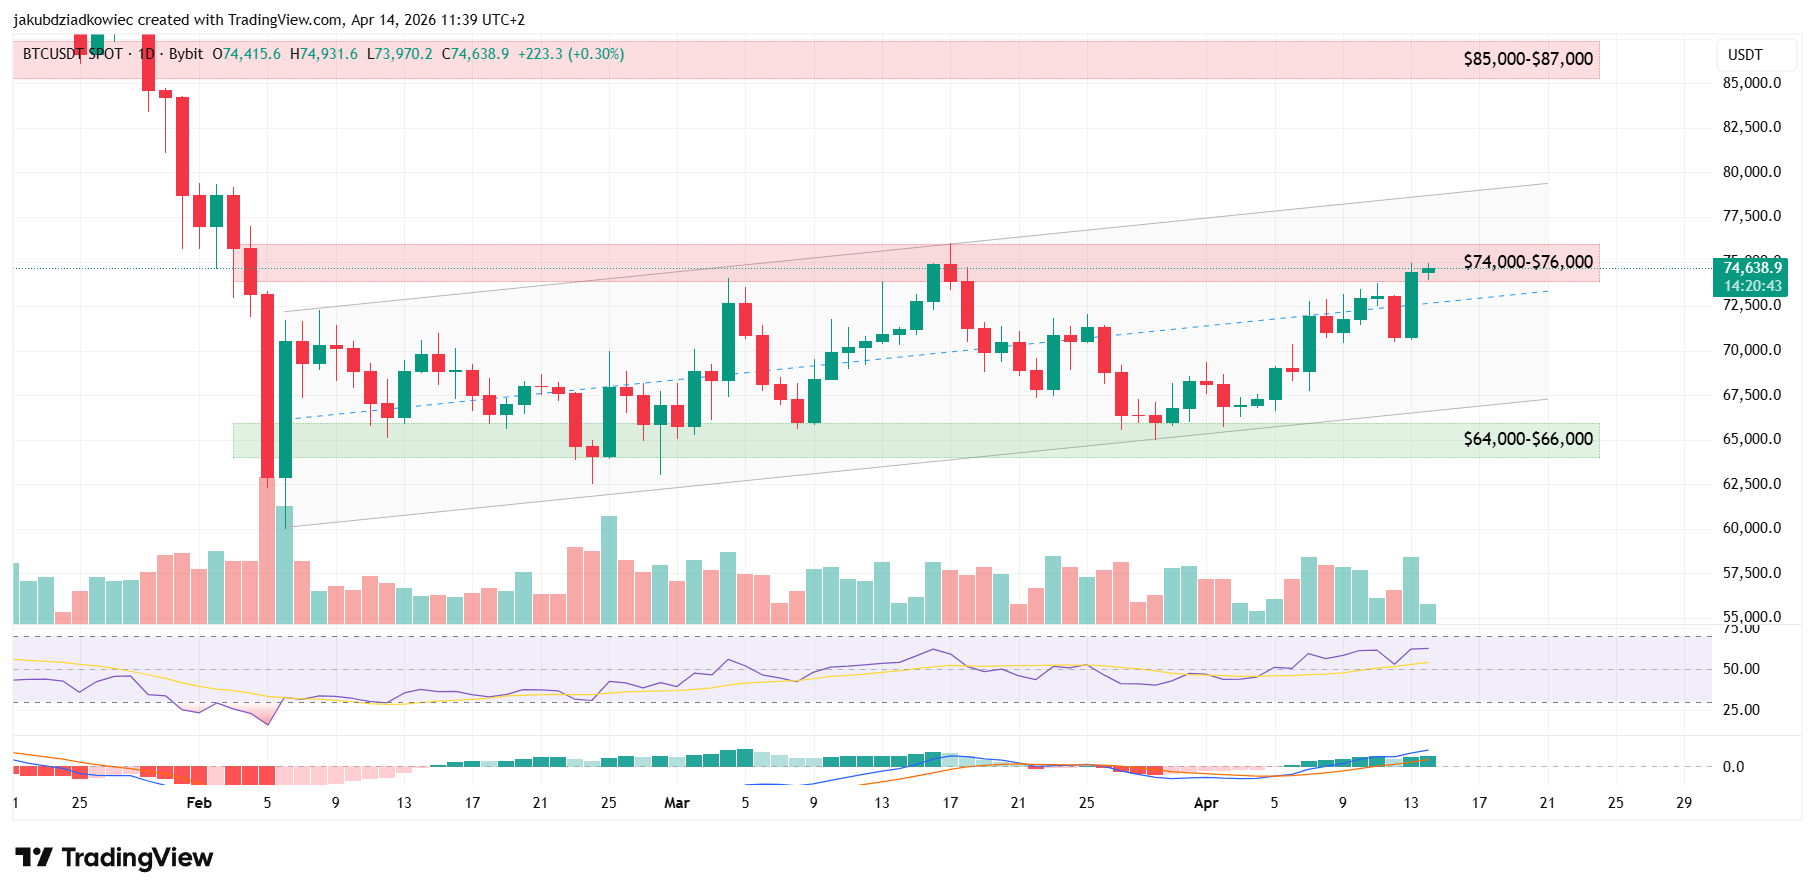
The confluence of channel resistance and the horizontal supply zone makes the current price area a critical decision point.
A clean daily close above $76,000 would open the path toward the next major resistance cluster at $85,000–$87,000. Below, the key support box sits at $64,000–$66,000, aligning with the channel’s lower boundary.
Bitcoin Momentum Warning Signs on the 4-Hour Chart
Zooming into the 4-hour timeframe, the short-term structure remains technically bullish — BTC has printed a series of higher highs and higher lows since the March 27 low.
The sweep of the previous $72,000 high (green line) has now flipped that level into support.
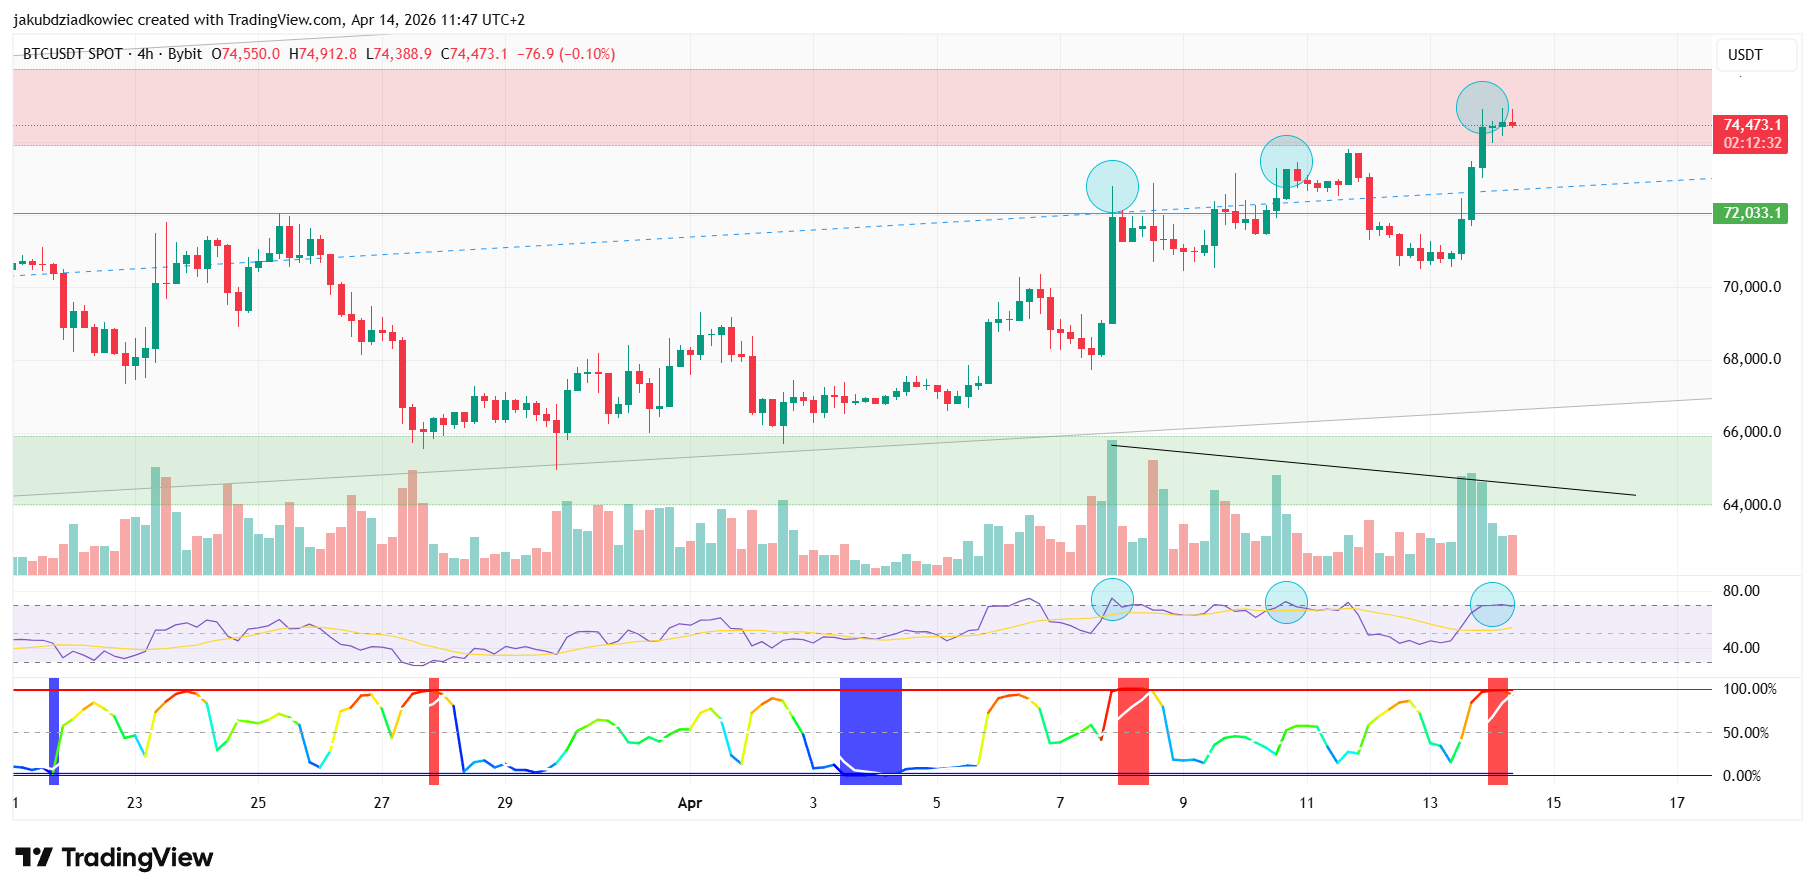
However, momentum tells a different story. Three consecutive instances of price making higher highs while RSI prints lower highs (blue circles) form a triple bearish divergence — a textbook signal of exhausting buying pressure.
Volume has also been declining throughout the advance, confirming weakening participation.
Adding to the caution, the Bollinger Band Width Percentile (BBWP) has reached historically extreme levels, a condition that typically precedes a volatility contraction and short-term price pullback.
BTC Price Prediction: Two Scenarios to Watch
Bullish scenario: A daily close above $76,000 with expanding volume invalidates the divergence and signals a genuine breakout toward $85,000–$87,000.
Invalidation: price failing to hold $76,000 and reversing back into range.
Bearish scenario: Rejection at the current resistance zone triggers a pullback toward $72,000, with a deeper retest of $69,000–$70,000 if $72K fails to hold.
Invalidation: a sustained break and close above $76,000.
The post Bitcoin Surges to $74,500 — But Triple Divergence Signals the Rally Could Be Over appeared first on BeInCrypto.