The XRP price has delivered mixed signals in recent sessions. The token is up about 4.7% over the past seven days, but has slipped roughly 3% in the last 24 hours, highlighting the ongoing tug-of-war between buyers and sellers.
Despite the short-term pullback, XRP continues to trade inside a bullish pattern, a structure that often precedes breakouts. Now, a combination of bullish divergence and whale accumulation is adding new fuel to the breakout narrative. With XRP whales accumulating nearly $200 million worth of tokens, traders are beginning to eye the long-awaited 17% breakout.
Bullish Divergence And Big Money Accumulation Keep Breakout Setup Alive
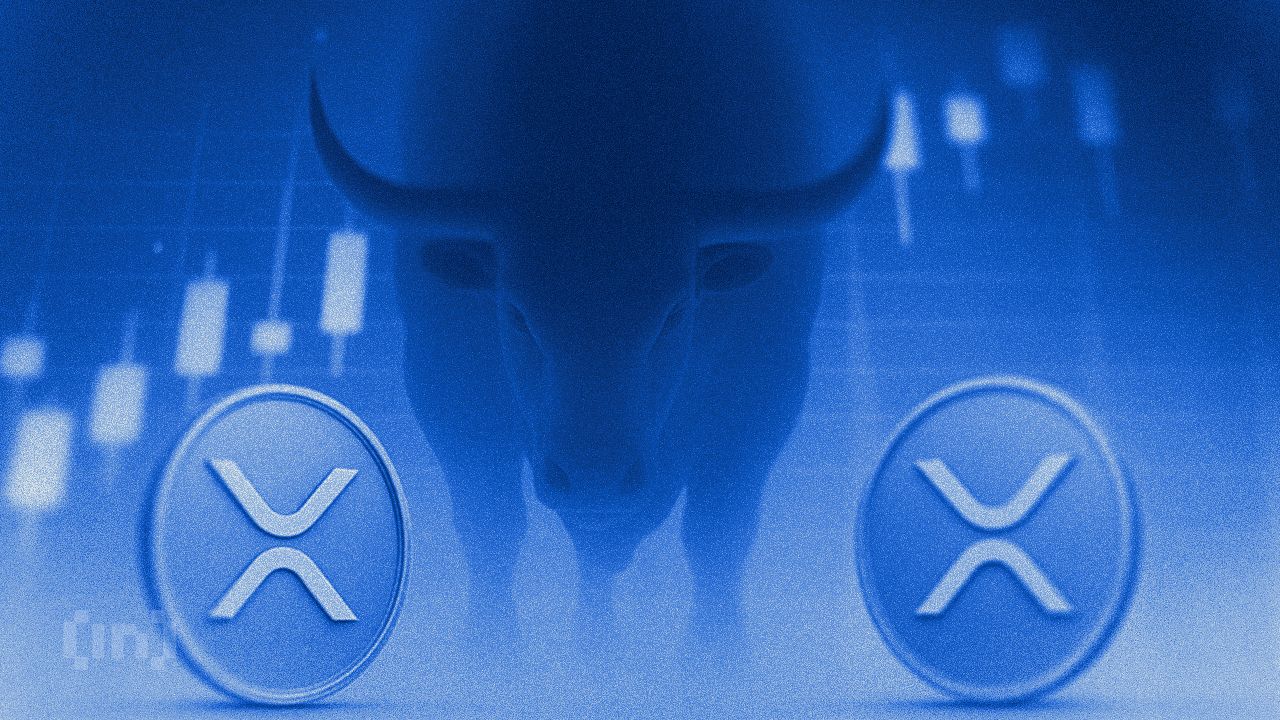
For starters, the XRP price continues to trade inside a cup-and-handle pattern on the 12-hour chart, a structure that often precedes bullish breakouts. The setup remains intact because the price has not lost the handle’s support zone or revisited the base of the cup.
Additionally, the Relative Strength Index (RSI), a momentum indicator, is flashing a bullish divergence on the 12-hour chart.
Between February 9 and March 6, the XRP price formed a lower low, while the RSI formed a higher low. This configuration is known as a standard bullish divergence. While this formation often hints at a reversal (downtrend to upmove), even a rebound could make the XRP traders happy.
From a buyer-seller perspective, this pattern suggests that although prices were still falling, selling momentum was weakening, allowing buyers to gradually absorb supply.
Want more token insights like this? Sign up for Editor Harsh Notariya’s Daily Crypto Newsletter here.
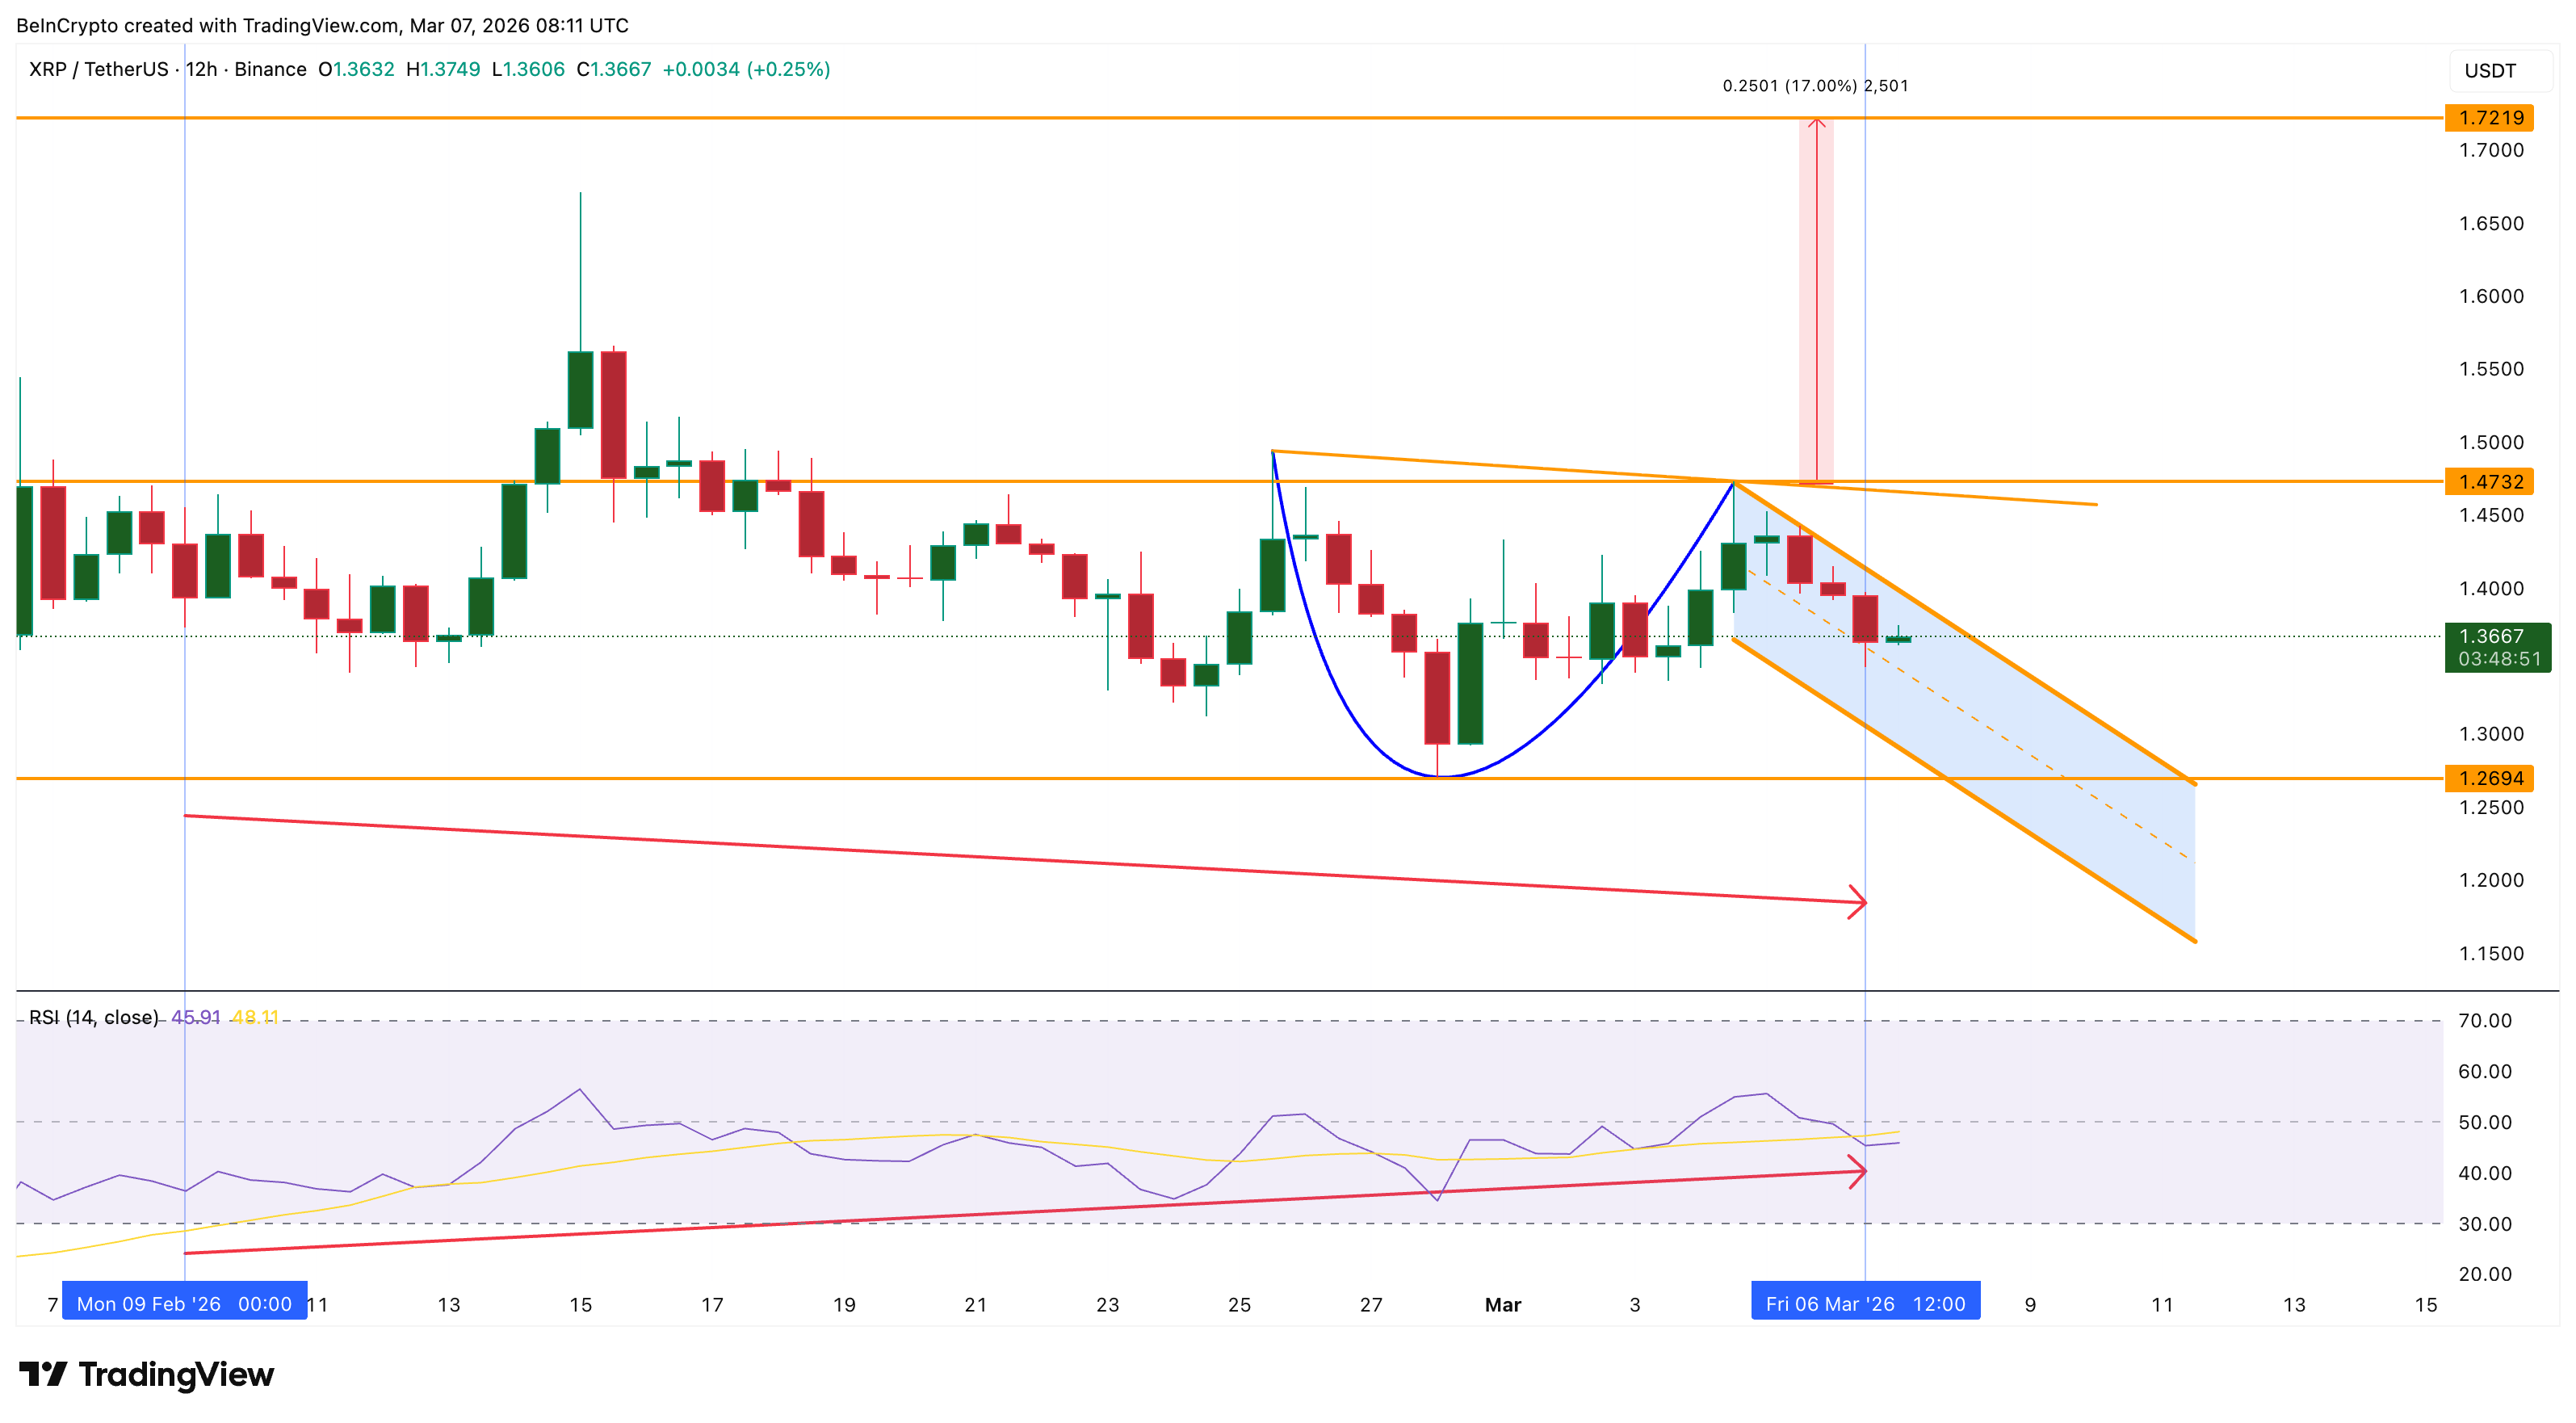
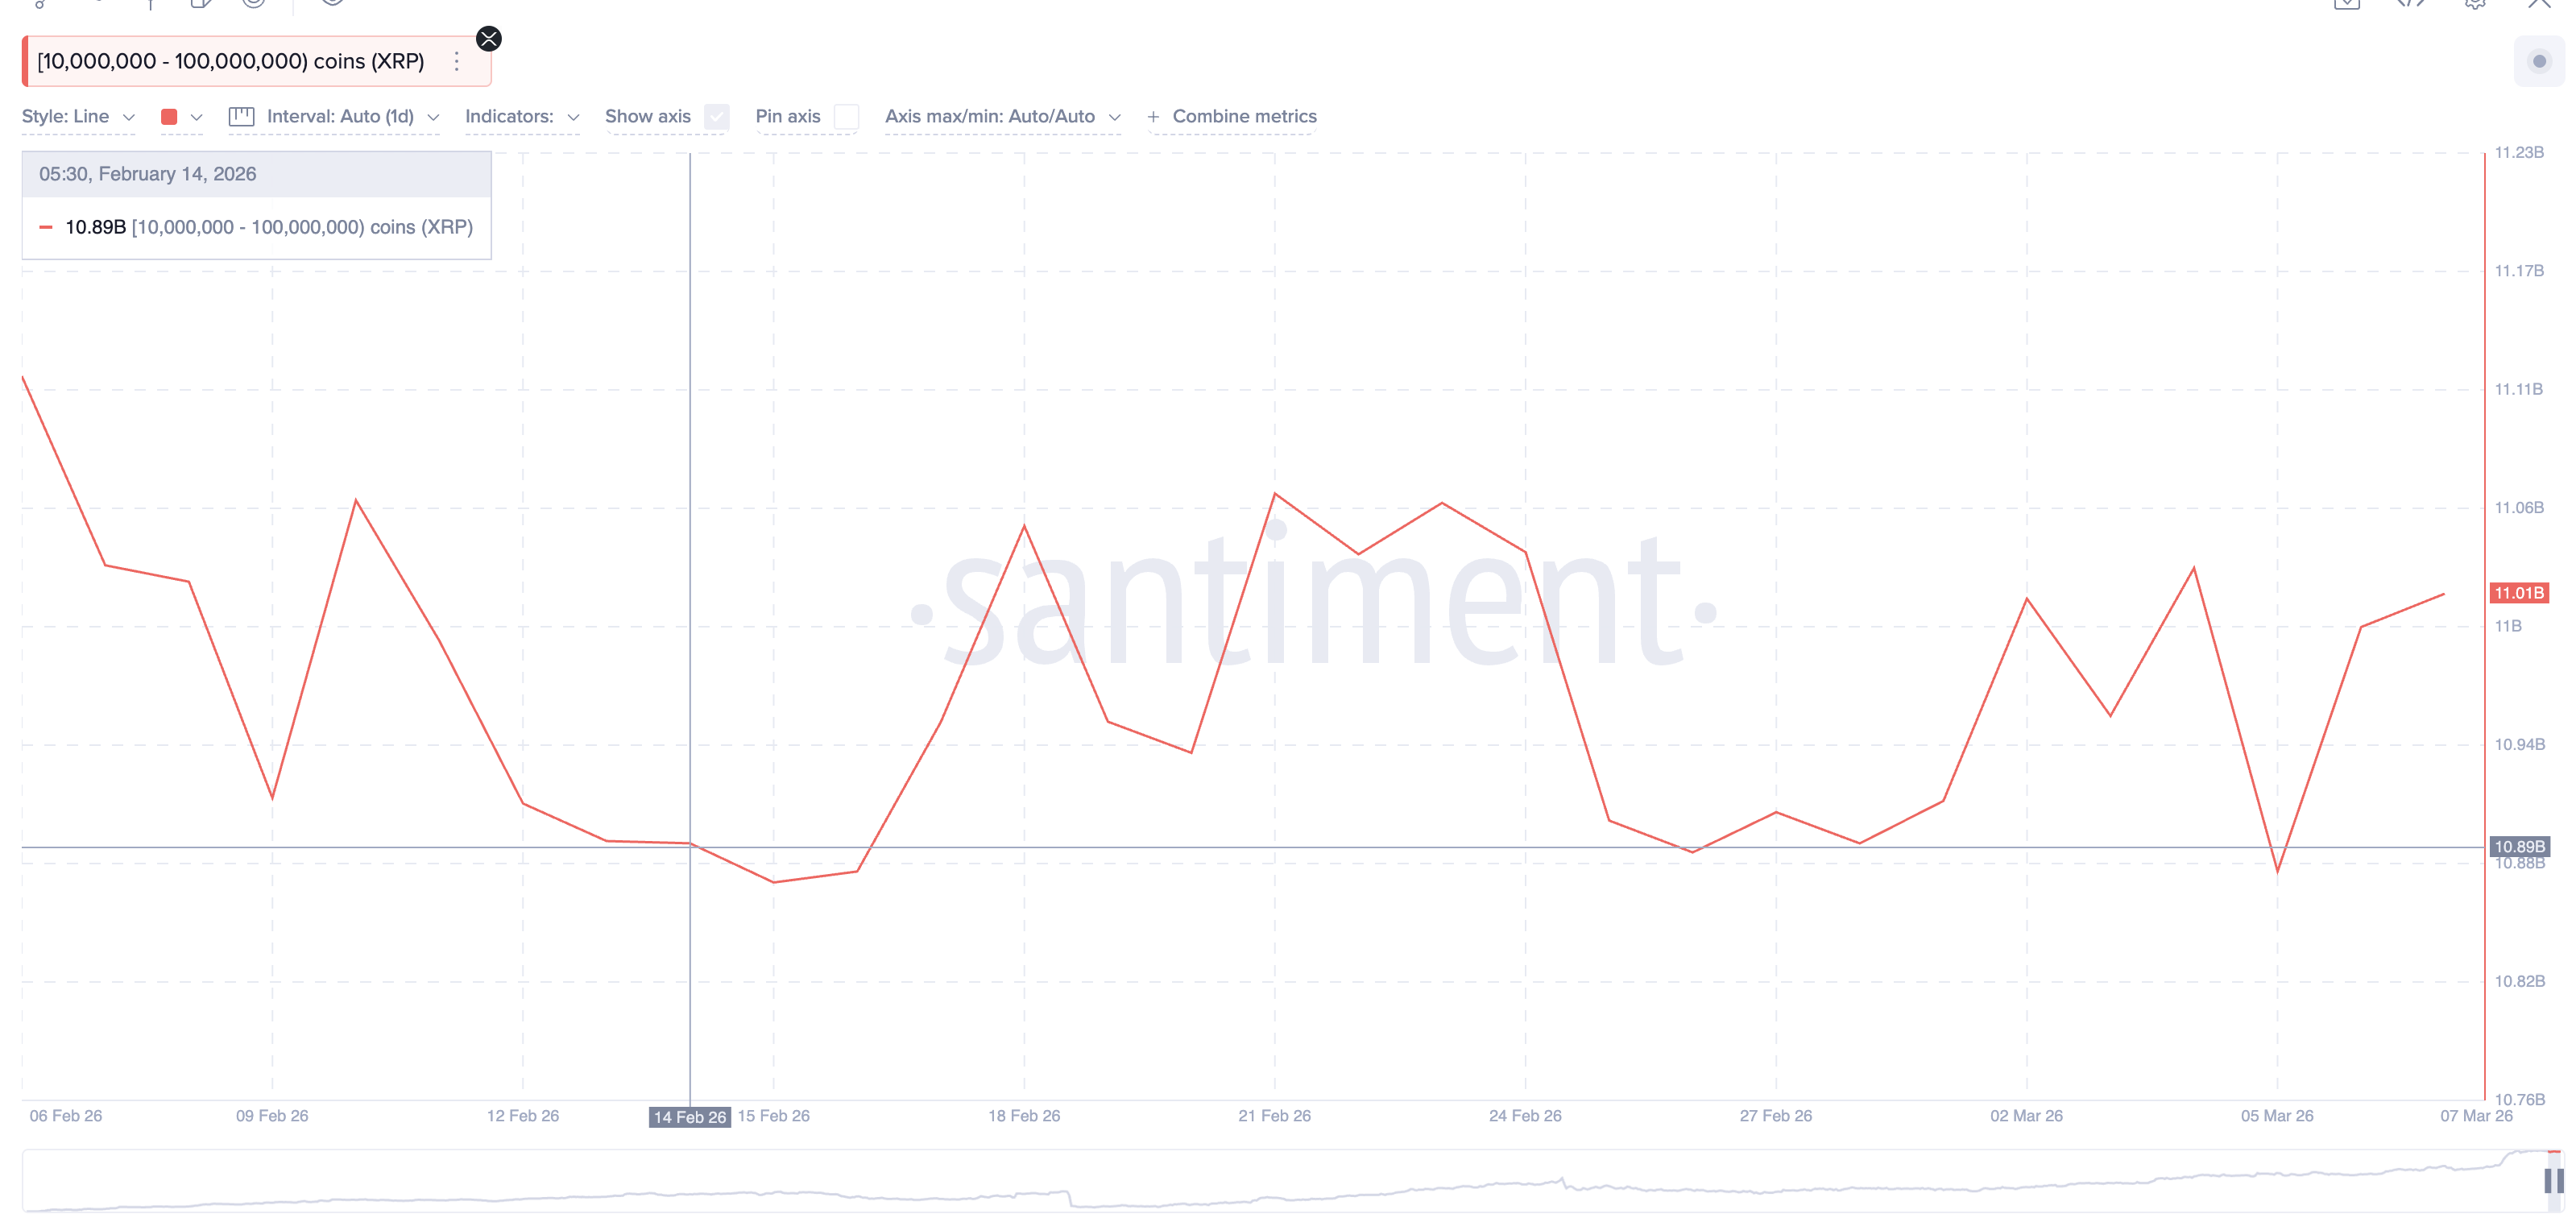
At the same time, XRP whales (big money wallets) have started accumulating again. Data tracking the largest wallets shows that whales increased their holdings from 10.87 billion XRP to 11.01 billion XRP since March 5. That represents roughly 140 million XRP added, which translates to close to $200 million in purchases at current market prices.
When large holders increase their exposure while a bullish divergence forms, it often strengthens the probability that a rebound attempt could follow. However, the role of XRP whales becomes even clearer when exchange flow data is examined.
Exchange Outflows Reveal How Whales Influence Price Direction
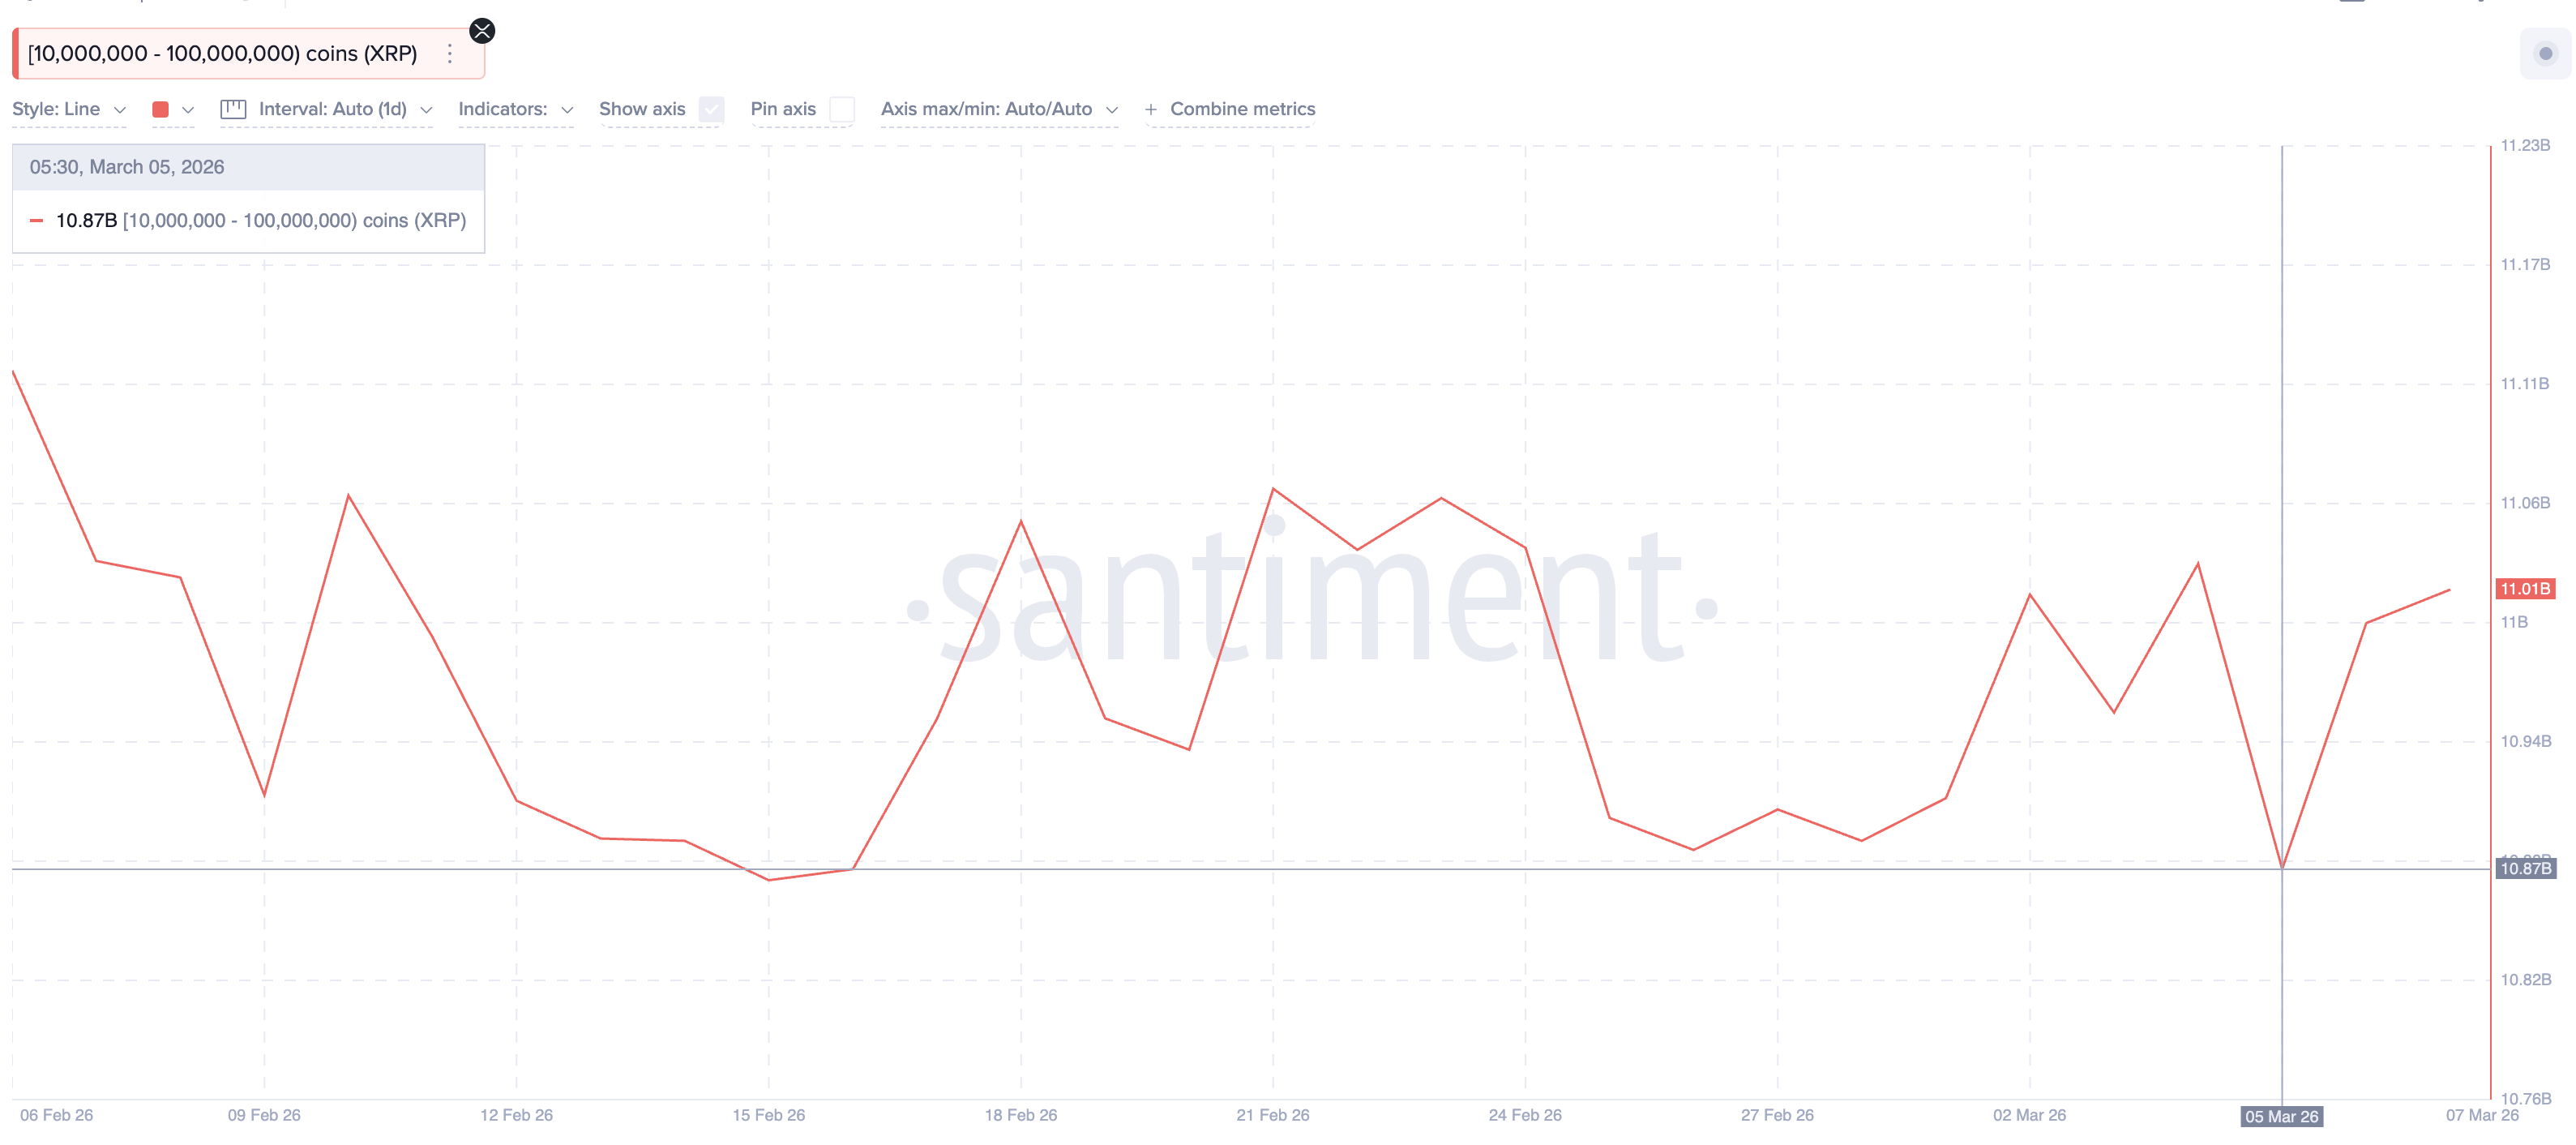
Another key metric supporting the bullish narrative is the exchange net position change.
This on-chain indicator tracks whether coins are moving into exchanges or out of exchanges. Recent data shows that exchange net flows have flipped negative again (buying pressure), with roughly 3.56 million XRP leaving exchanges.
Interestingly, this pattern closely aligns with whale behavior.
Earlier in February, between February 12 and February 14, exchange inflows were rising while XRP whales were reducing their holdings from 10.91 billion to 10.89 billion XRP. The increase in exchange supply coincided with whale selling, and the XRP price subsequently declined to $1.35 by February 24, from the highs of $1.52 on February 12.
Now the dynamic has reversed.
Exchange outflows are increasing while XRP whales are adding to their holdings, suggesting that large players may once again be influencing the direction of exchange flows. This alignment indicates that whale activity could be playing a central role in determining whether the XRP breakout setup succeeds.
Still, derivatives positioning adds another layer of complexity to the outlook.
Derivatives Data Shows Shorts Rising, But Leverage Weakening
Derivatives data reveal a mixed sentiment among traders.
The open interest (OI) — a metric that measures the total value of outstanding futures contracts — has declined from $859.11 million on March 5 to around $765.6 million, representing a drop of roughly 11%. A decline in open interest usually signals that leveraged positions are being reduced, which can lower the intensity of future price moves.
At the same time, the funding rate has flipped negative, shifting from +0.0088 to around –0.009. A negative funding rate suggests that short positions are currently dominating the derivatives market, meaning traders are increasingly betting on downside.
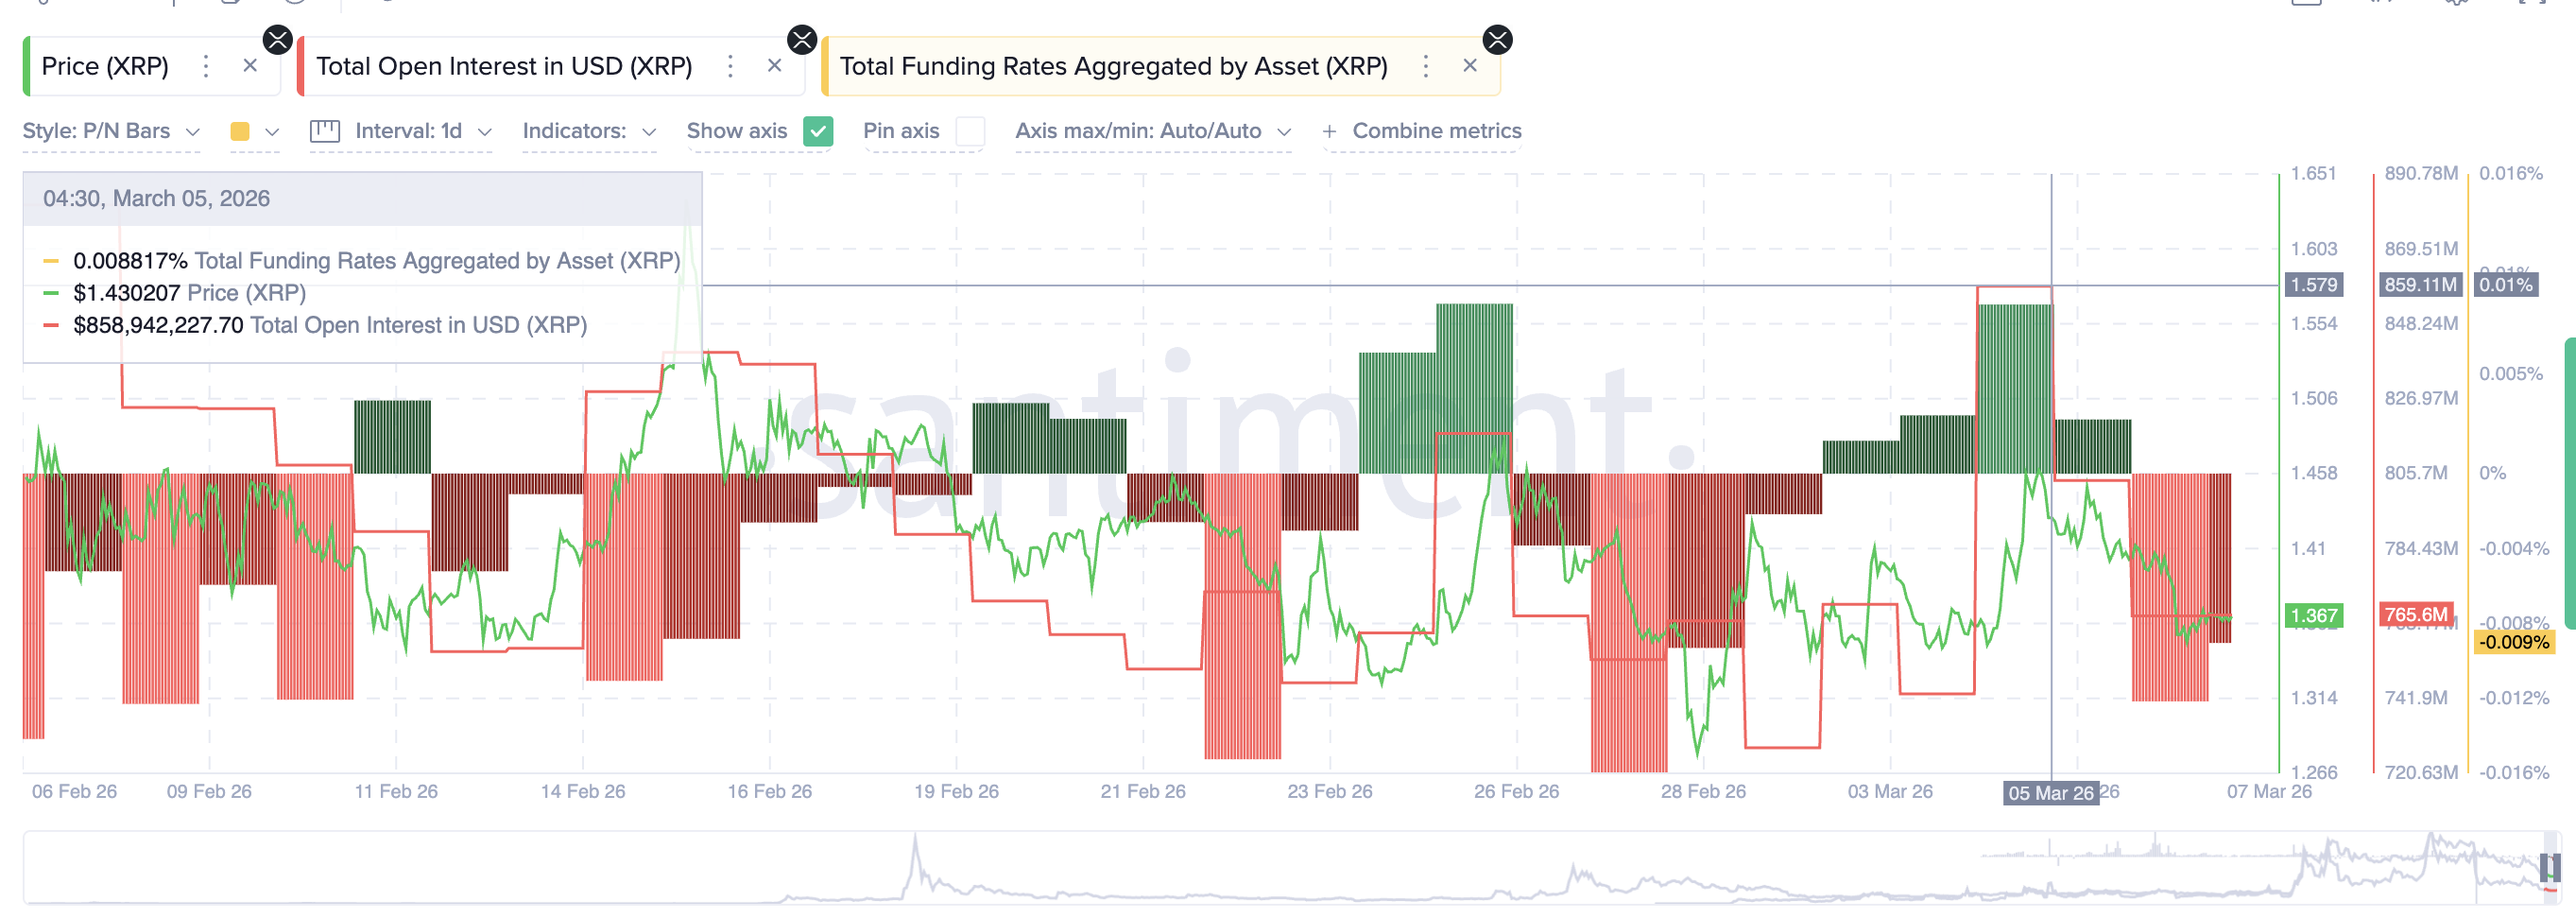
However, because open interest has simultaneously declined, the market may lack the aggressive leverage needed for a powerful short squeeze.
This means that even if XRP begins moving higher, the rally could develop gradually rather than through a violent squeeze, leaving whales as one of the primary forces capable of pushing the price toward a breakout.
XRP Price Levels That Could Confirm The 17% Breakout
From a technical perspective, the cup-and-handle pattern remains the key structure guiding the XRP price outlook. For the bullish scenario to unfold, XRP must first reclaim $1.40, which represents the upper boundary of the handle formation.
A move above this level would increase the probability that XRP can test the cup neckline near $1.48. A confirmed breakout above $1.48 could then open the path toward $1.70–$1.72, representing roughly 17% upside from current price levels.
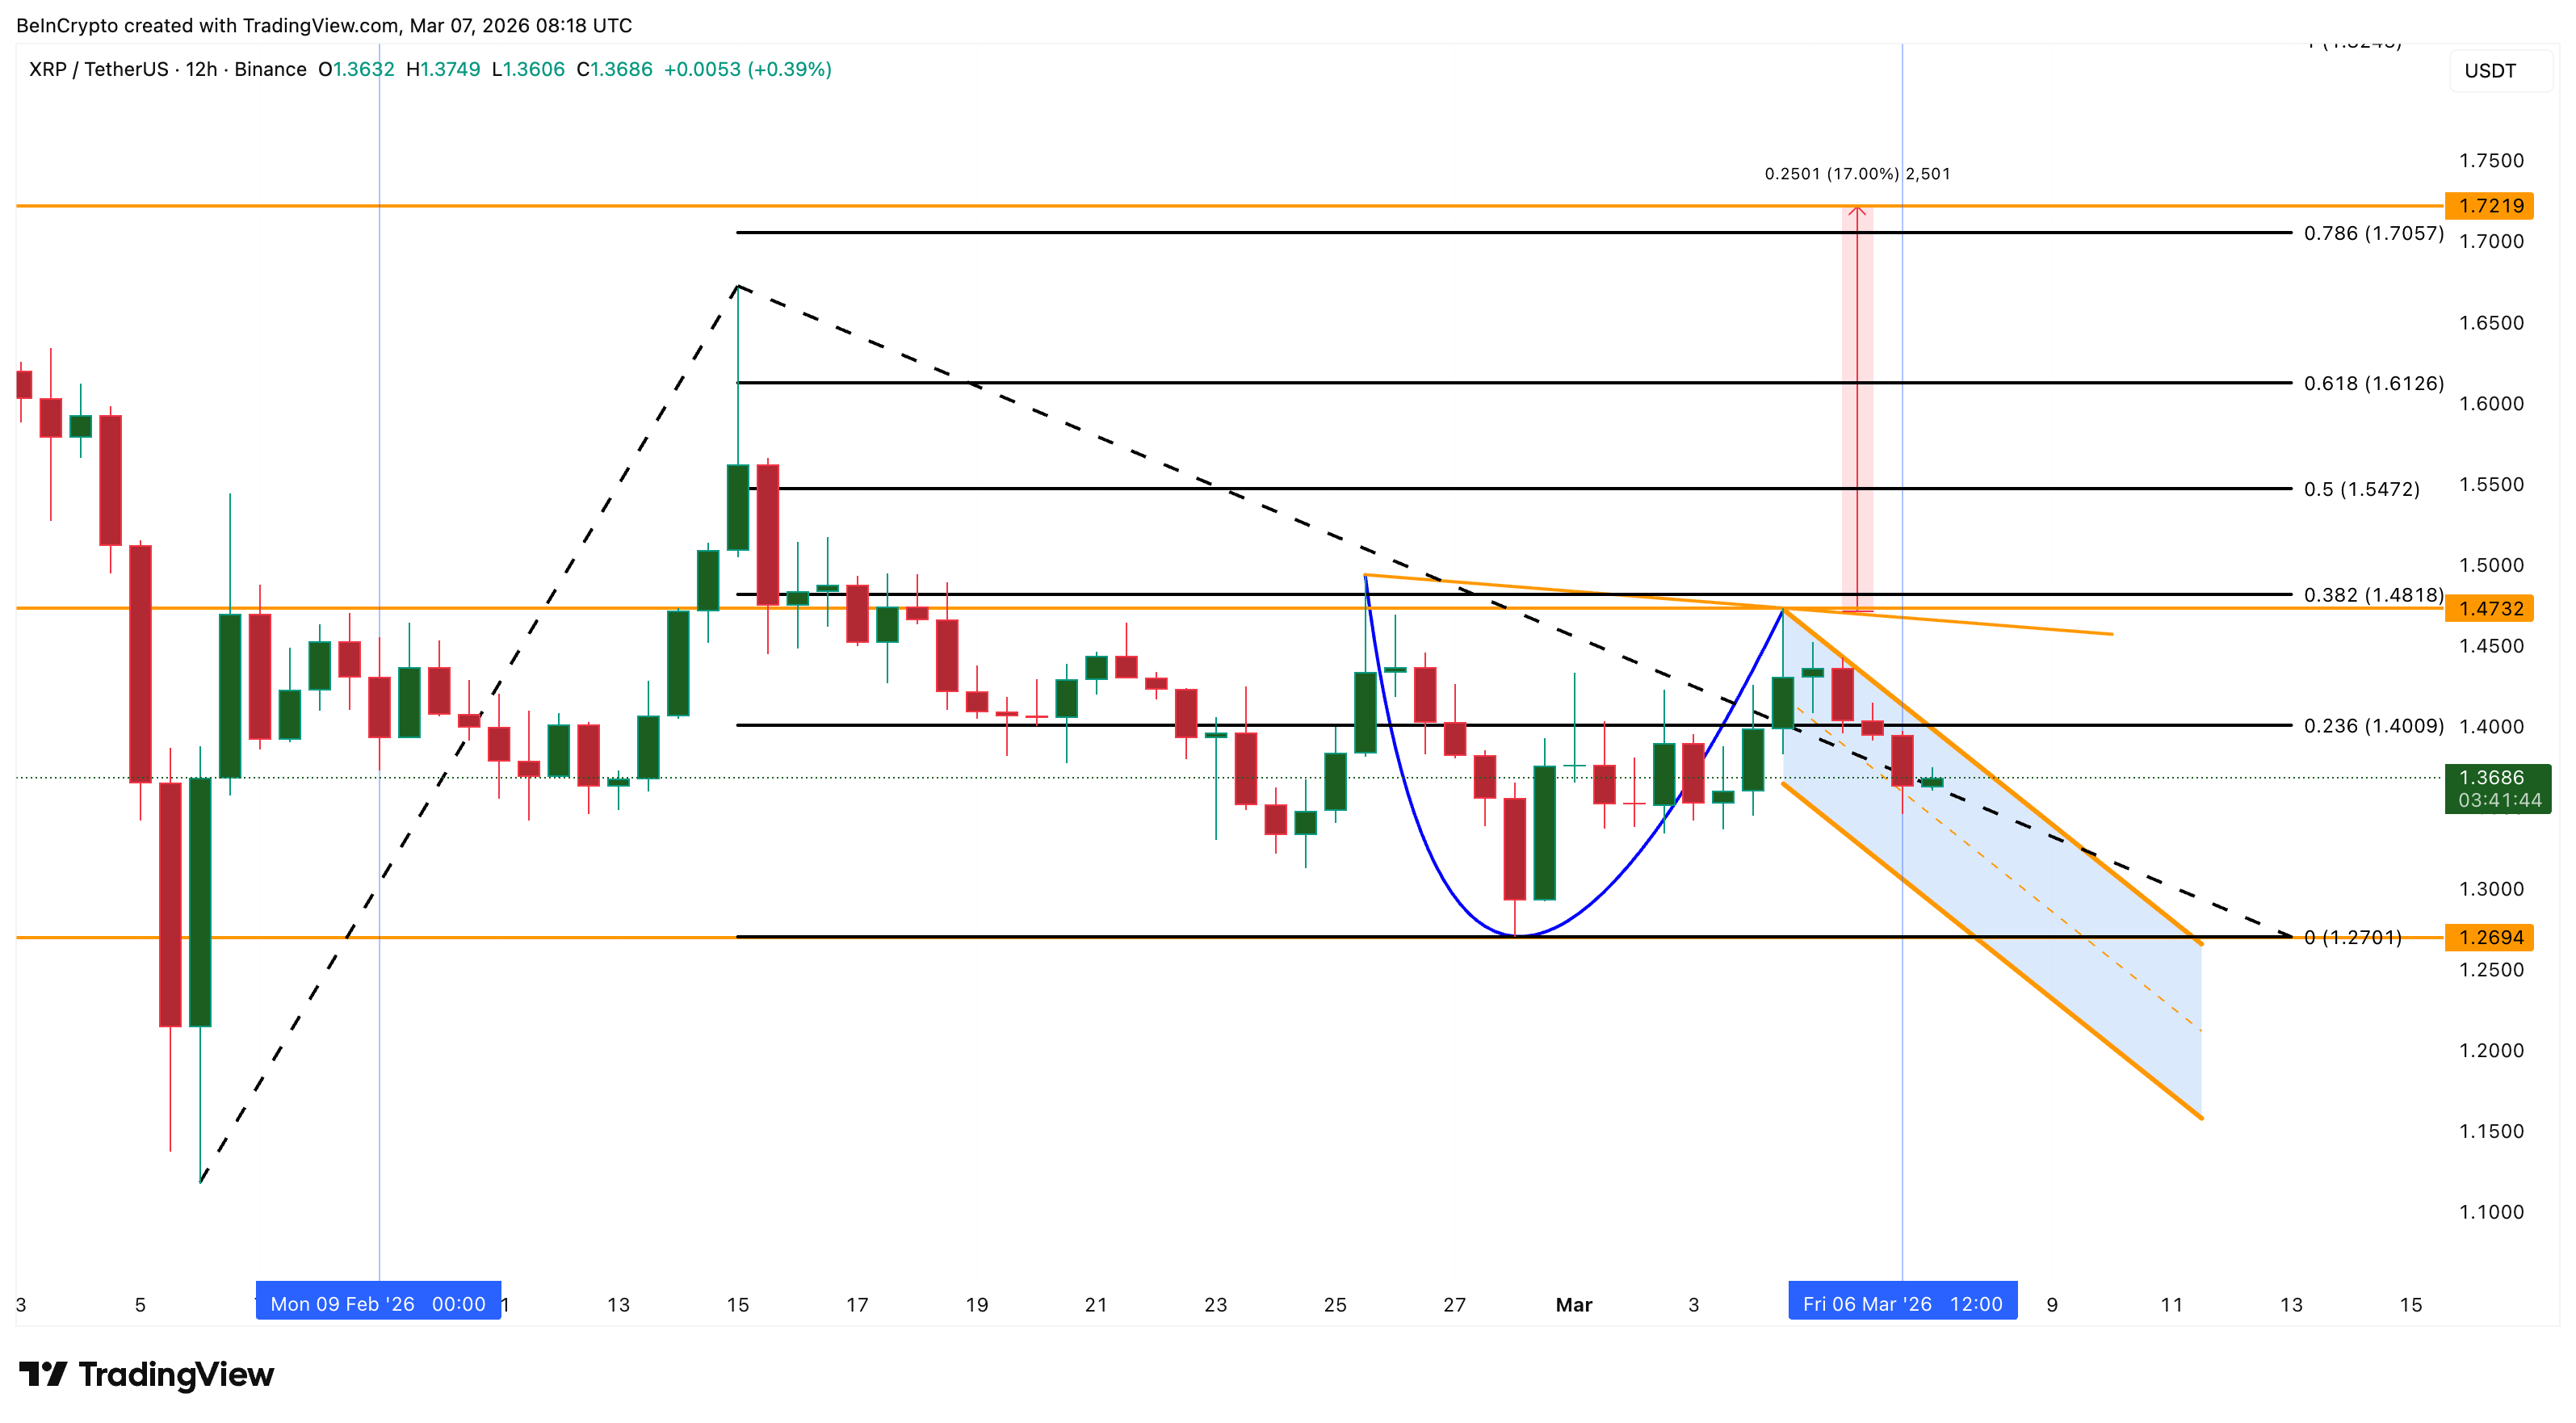
However, the bullish setup would weaken significantly if XRP falls below $1.27, a level that serves as the structural support of the current formation. A breakdown there would invalidate the cup-and-handle pattern.
For now, the XRP price remains locked in consolidation, but the combination of bullish divergence, exchange outflows, and nearly $200 million in XRP whale buying suggests that large investors may be positioning for a potential breakout attempt. But derivatives positioning hints at a slow burn.
The post $200 Million in XRP Whale Buying Backs Cup-and-Handle Pattern — Is a 17% Rally Next? appeared first on BeInCrypto.