XRP has lost momentum following its recent rally toward the $3.5 resistance region. The rejection has shifted the market into a corrective phase, with the price consolidating between major support and resistance levels that will decide whether the asset resumes its bullish trajectory or faces deeper downside pressure.
XRP Analysis
By Shayan
The Daily Chart
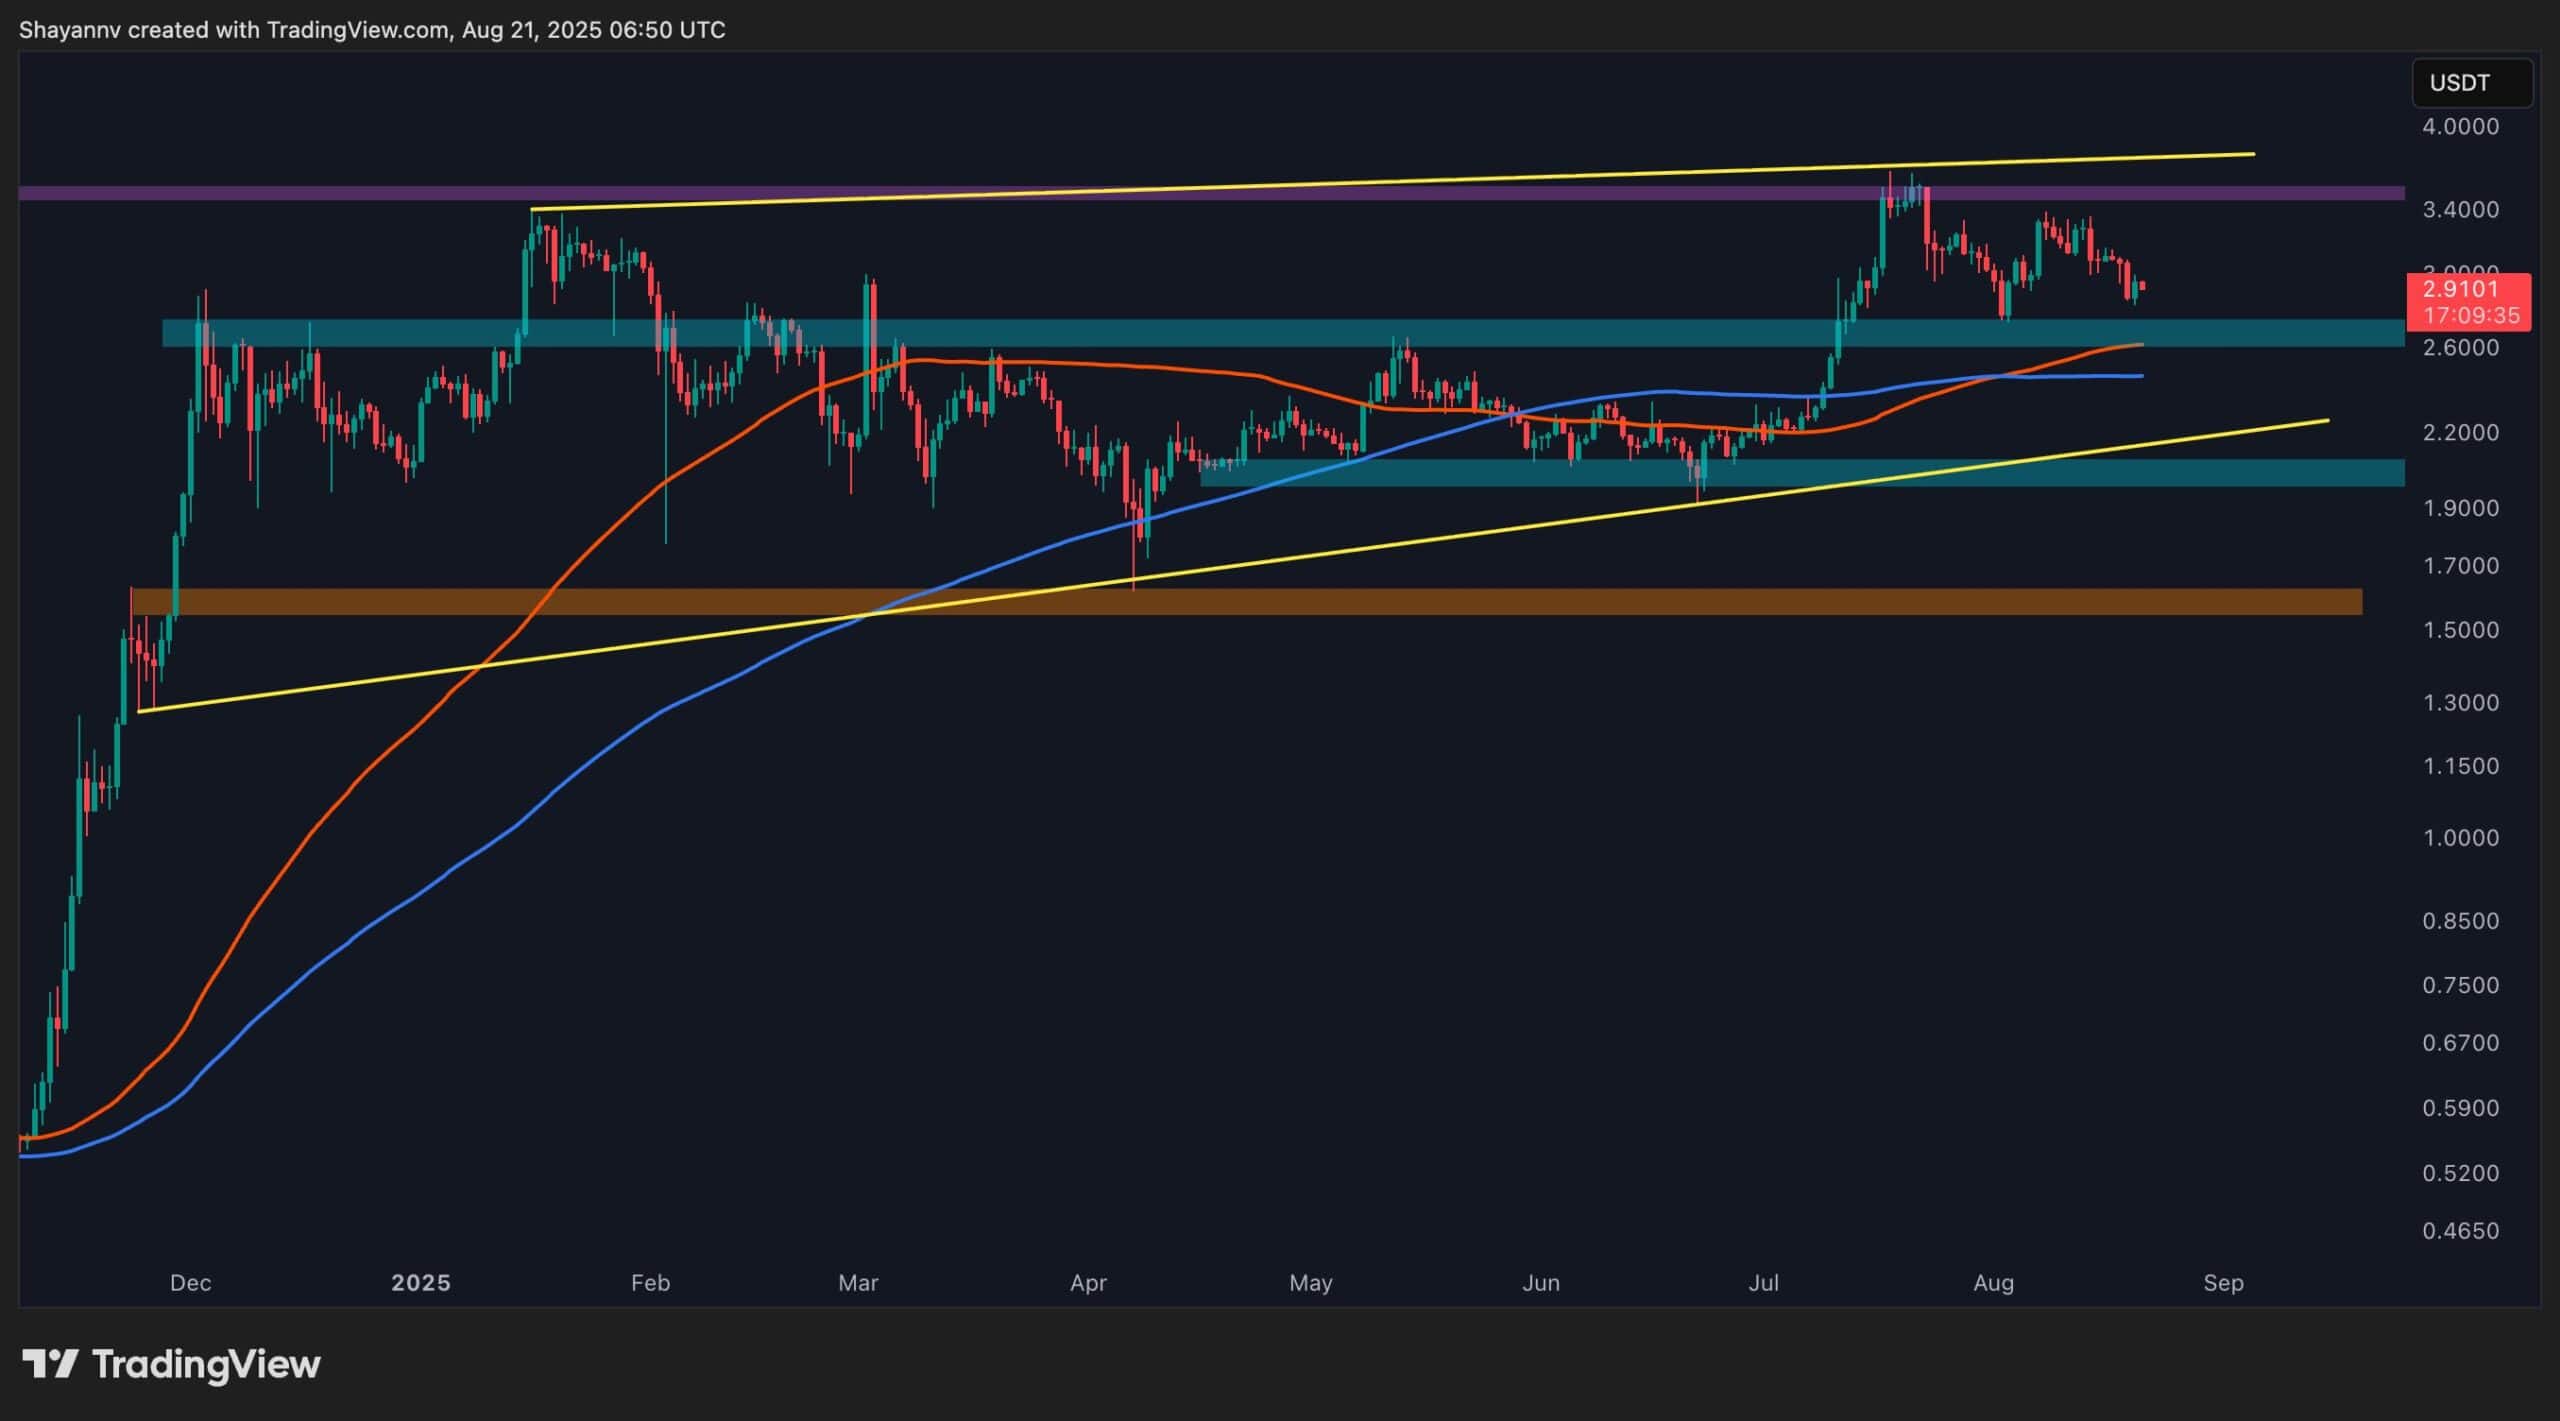
On the daily timeframe, Ripple’s token failed to sustain its breakout above the $3.5 resistance zone, resulting in a sharp rejection and pullback. The asset is now testing the $2.8–$2.9 support area, which overlaps with the mid-range of the ascending channel and the 100-day moving average, adding strength to this demand zone.
If buyers defend this support, XRP could rebound toward $3.2 and eventually retest the $3.5 resistance, keeping the broader bullish structure intact. However, if sellers succeed in breaking below $2.8, the next critical support rests at $2.2–$2.4, a zone that previously served as a strong accumulation area and aligns with the ascending wedge’s lower boundary.
The 4-Hour Chart
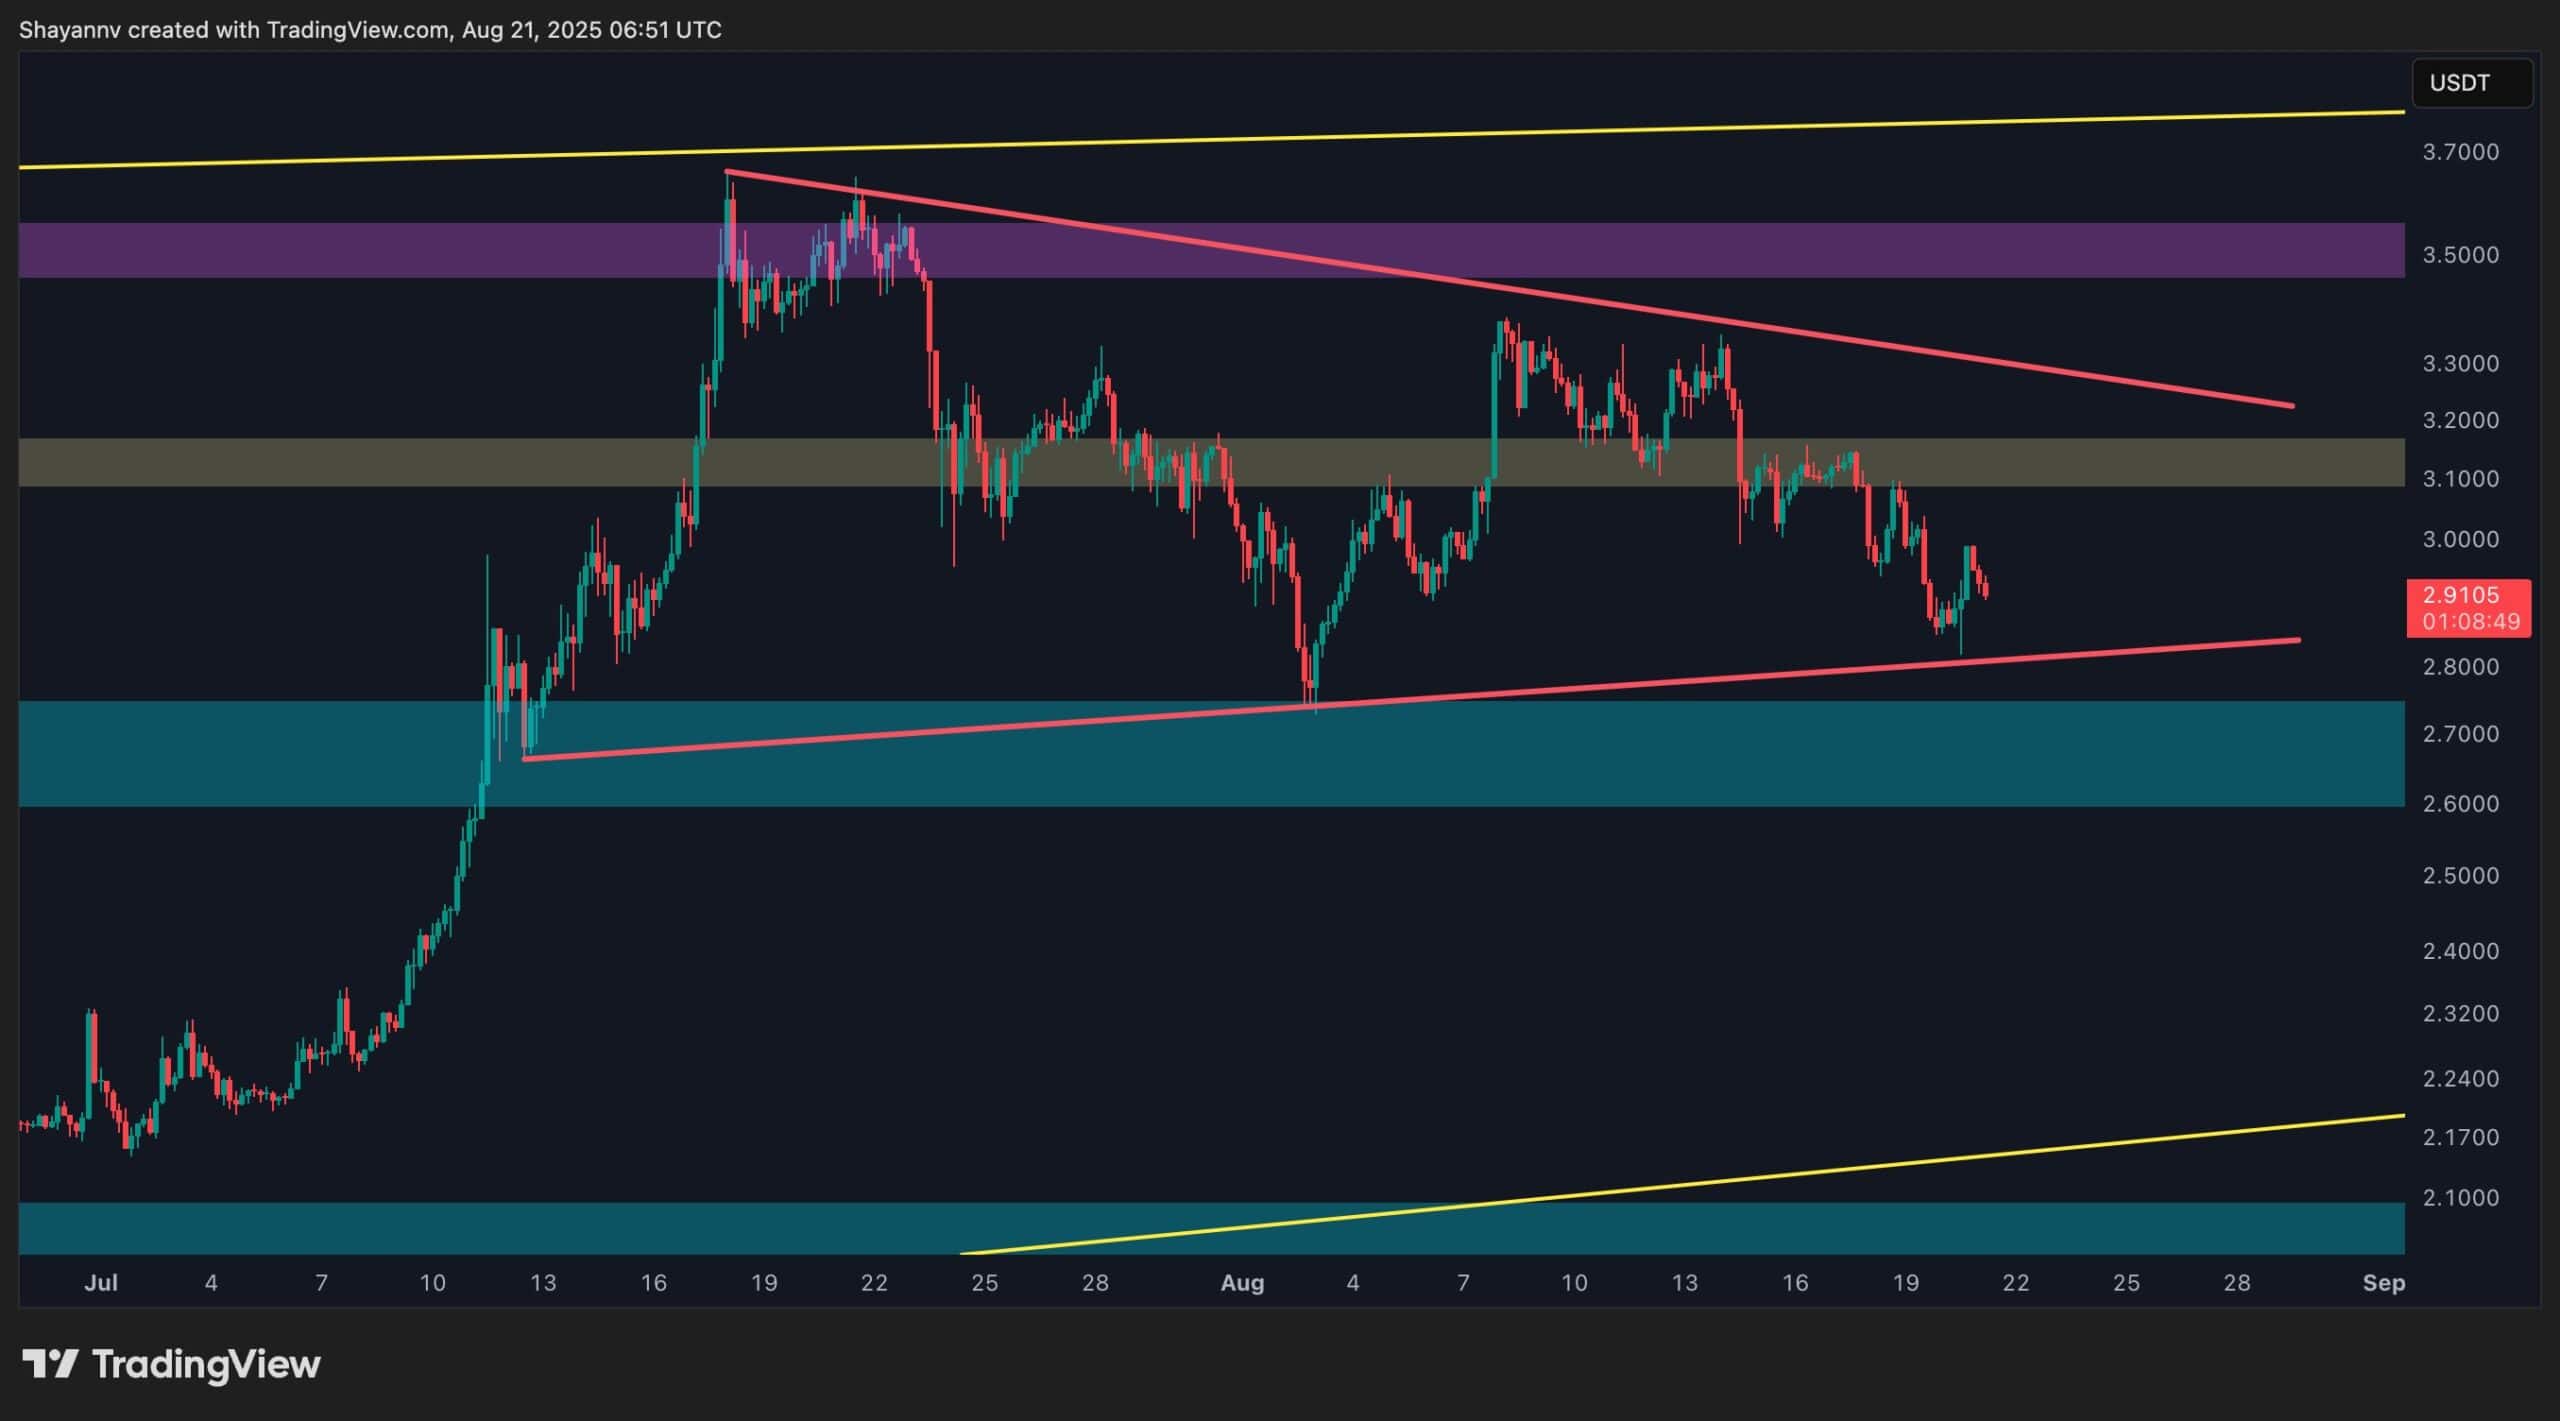
On the 4-hour chart, Ripple’s native coin has formed a descending triangle pattern, with lower highs converging toward a relatively flat base at $2.8–$2.9. This setup reflects gradually intensifying selling pressure. A breakdown from this structure would likely confirm a bearish continuation, exposing liquidity zones at $2.7 and $2.2.
Conversely, if the bulls manage to defend the $2.8 base and break above the descending trendline near $3.2, the bearish scenario would be invalidated. Such a move could reestablish short-term bullish momentum, targeting the $3.5 resistance once again.
The post Ripple Price Analysis: What’s Next for XRP After 20% Pullback? appeared first on CryptoPotato.


