Ethereum has recently shown a notable shift in short-term momentum, attracting renewed attention as it approaches a technically important area. While the broader structure remains corrective, recent price behaviour suggests that buyers are becoming more active near key technical levels.
Ethereum Price Analysis: The Daily Chart
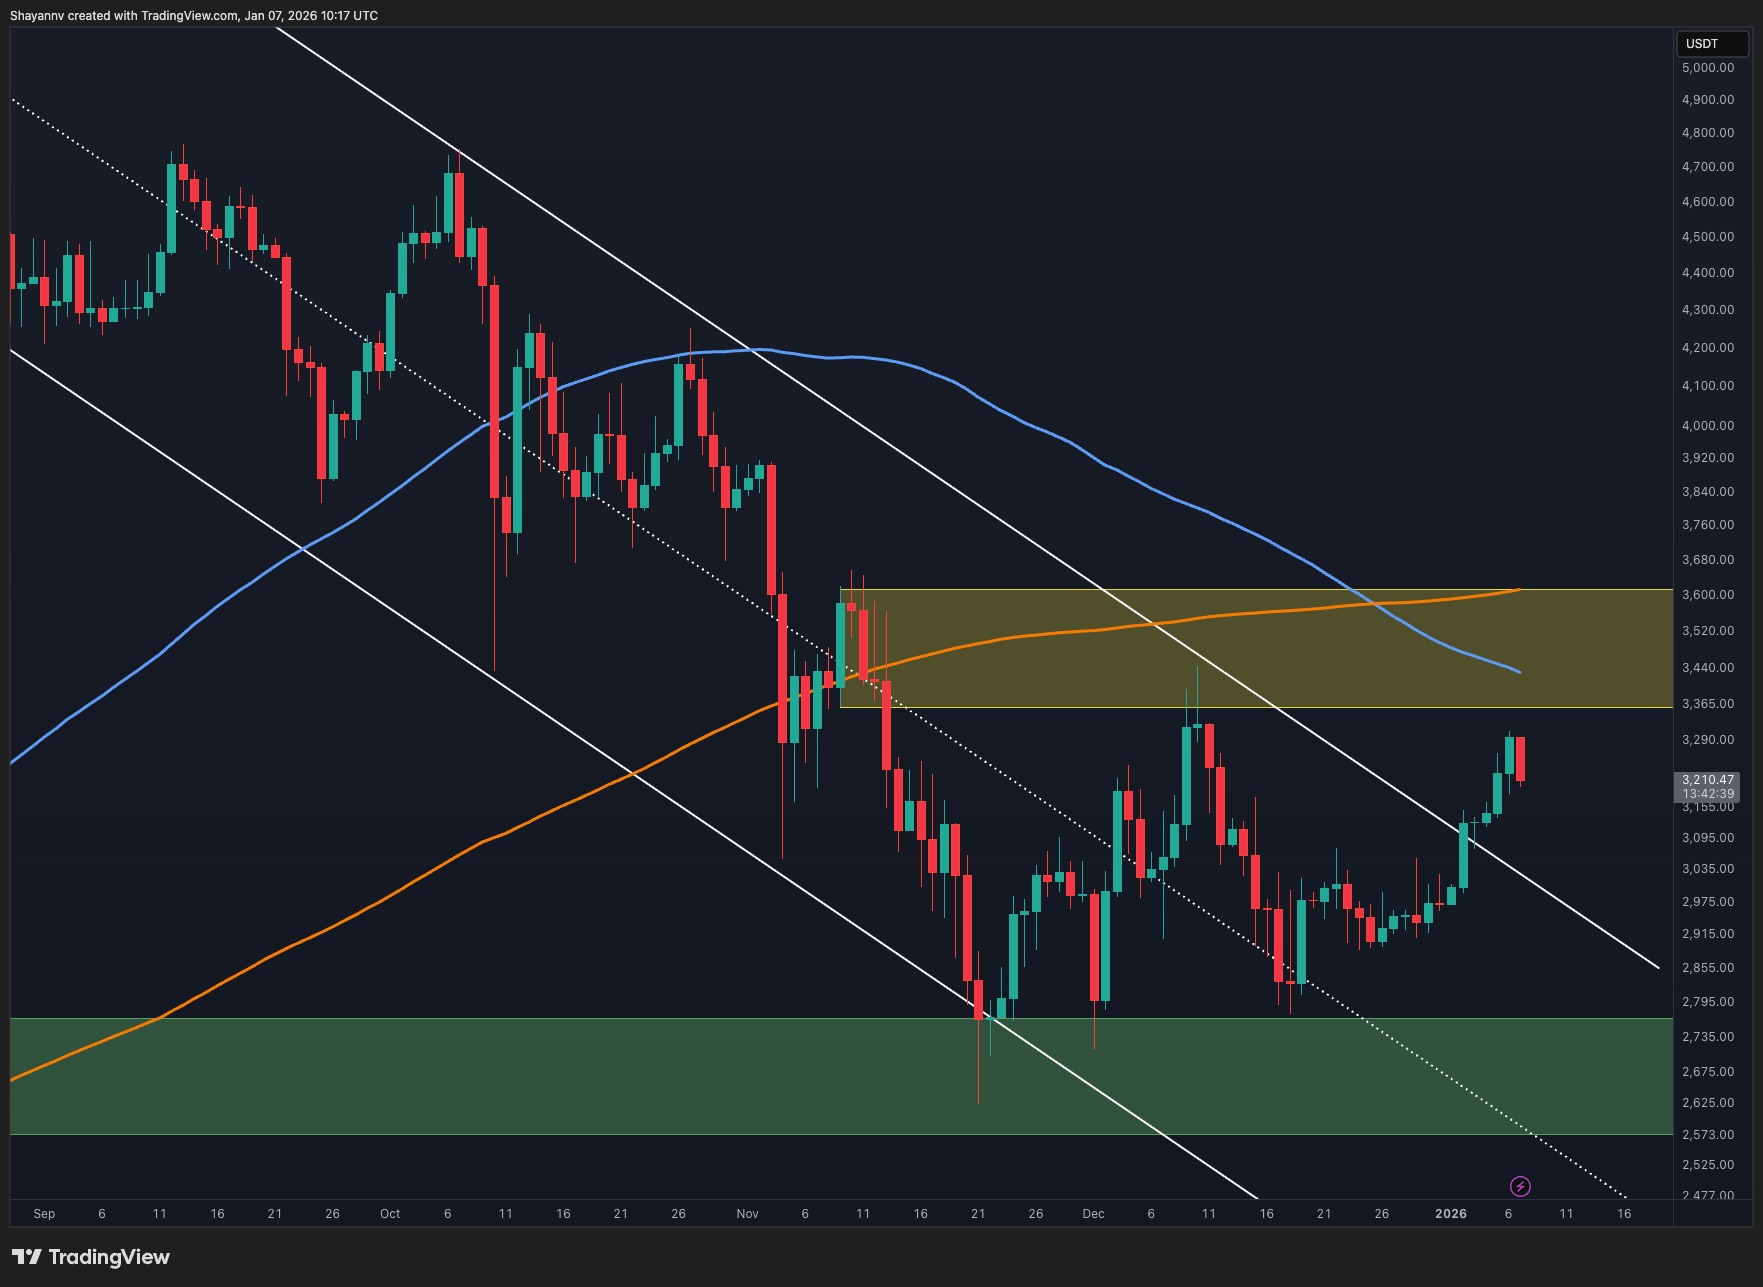
On the daily timeframe, ETH has experienced a clear upside surge from the $2.7K demand zone, pushing the price toward a substantial resistance zone. This resistance is defined by the confluence of the 100-day moving average of $3.4K and the highlighted yellow supply area. Historically, this region has acted as a strong barrier, and the current approach into this zone increases the probability of a reaction or consolidation.
Despite the recent bullish impulse, the asset is still trading within a broader descending channel, indicating that a move above this resistance is required to shift the higher-timeframe bias. Until then, this area should be treated as a critical decision zone where momentum may slow, or sellers could re-emerge.
ETH/USDT 4-Hour Chart
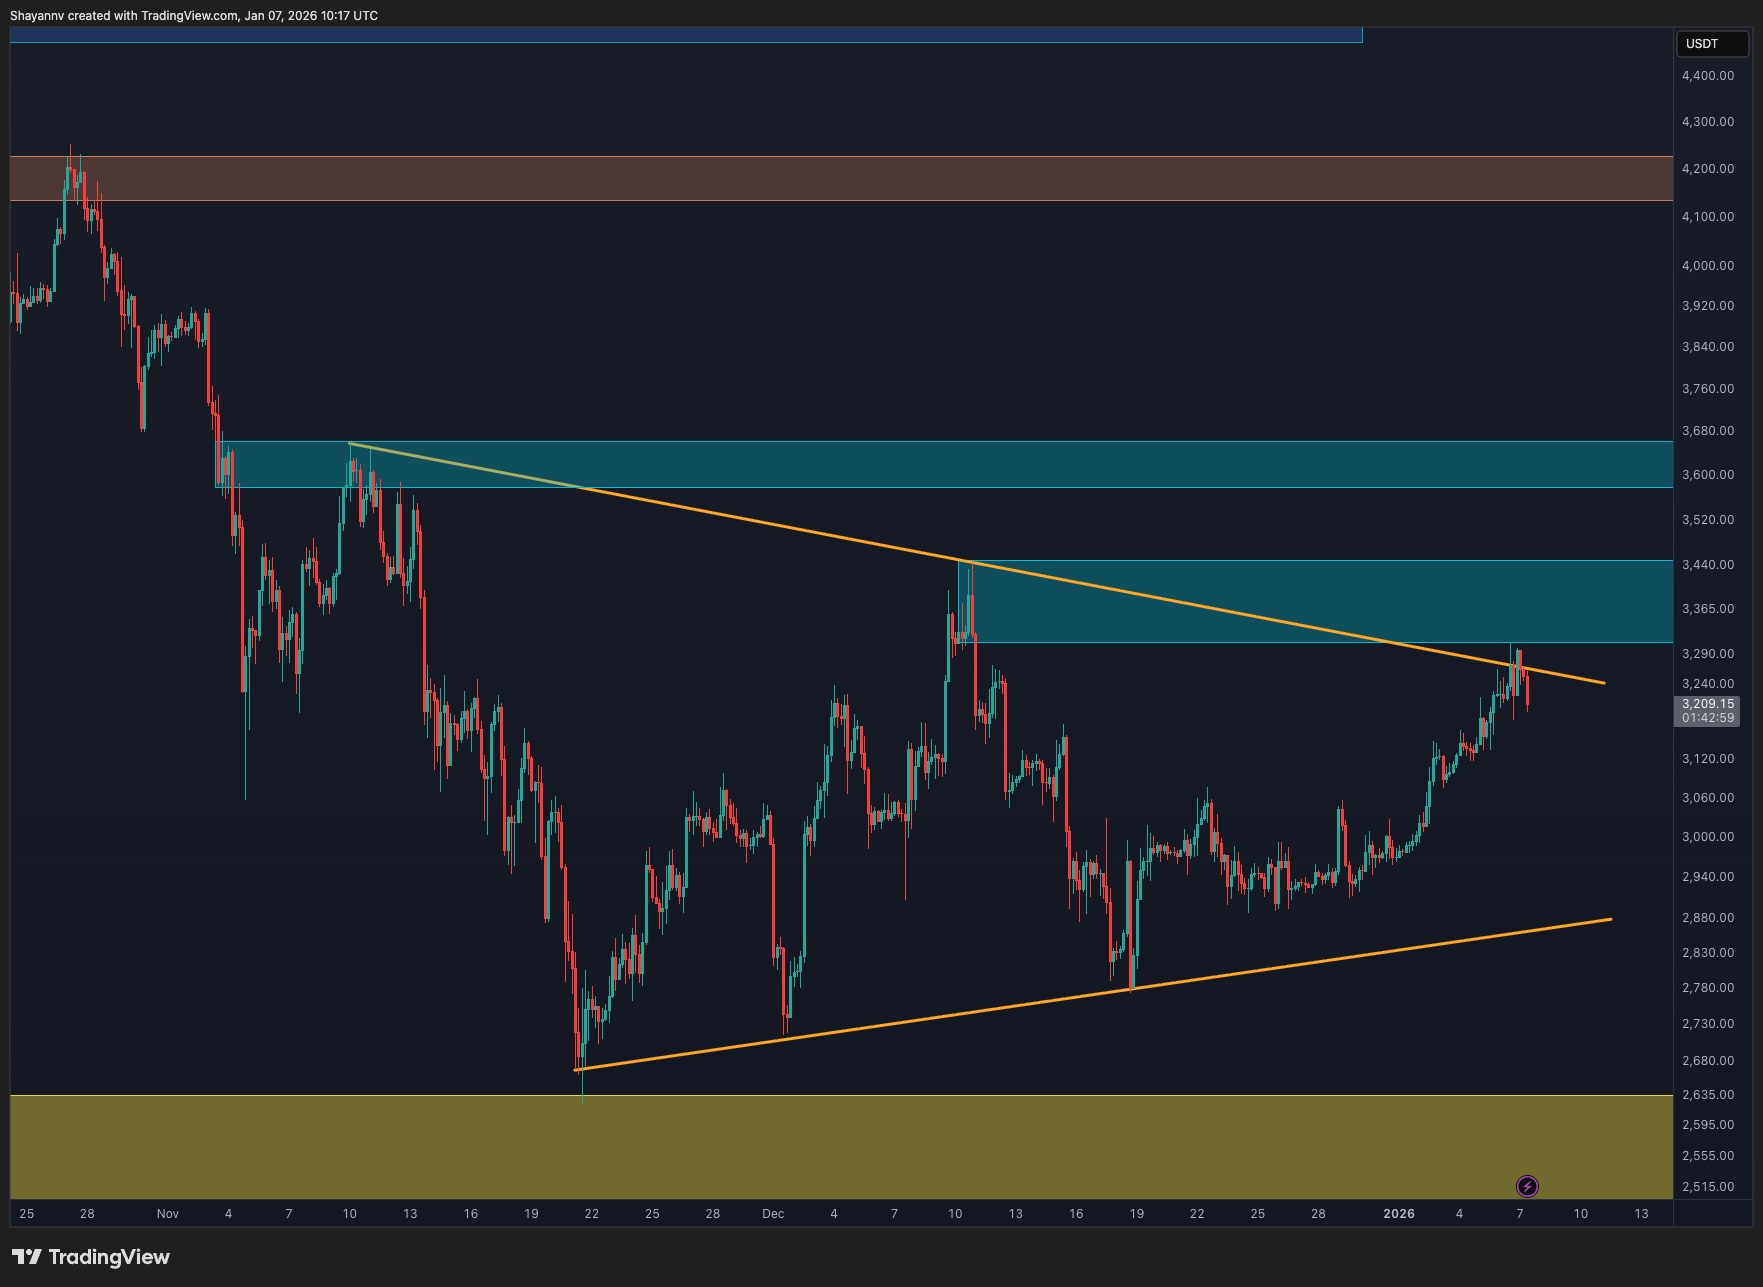
On the 4-hour chart, the structure provides a clearer view of the recent recovery. The price found solid support at the lower boundary of the wedge at $2.7K, confirming strong demand at that level. From there, Ethereum rallied steadily toward the upper boundary of the wedge $3.3K and has now slightly broken above it.
This breakout reflects improving short-term momentum, but it does not yet confirm a full trend reversal. The blue resistance box above, bounded by the $3.3K-$3,450 thresholds, remains the primary obstacle for continuation, as the price has previously reacted sharply from this zone. A clean acceptance above this area would be needed to confirm sustained bullish continuation, while rejection could lead to another pullback toward wedge support or the mid-range levels.
Sentiment Analysis
From an on-chain perspective, the Ethereum Spot Average Order Size chart shows an important behavioural shift. The recent appearance and clustering of green spots indicate increased participation from whale-sized spot buyers during the current price recovery. This suggests that larger participants are becoming active again after a period dominated by retail-sized orders.
Such behaviour often aligns with accumulation phases rather than distribution, especially when it occurs near structural support zones. While this does not guarantee immediate upside continuation, it adds weight to the idea that downside risk may be increasingly absorbed by stronger hands.
Overall, Ethereum is currently positioned at a technically sensitive area where short-term momentum has improved, but higher-timeframe resistance still dominates. Price reaction around the $3.4K–$3.5K region will be crucial in determining whether the recent recovery evolves into a broader trend shift or remains a corrective bounce within the existing structure.

The post Ethereum Price Analysis: ETH Shows Strong Signs of Revival but Key Hurdles Approach appeared first on CryptoPotato.