Ethereum has been consolidating just below its recent high, with price action slowly tightening within a defined structure. While short-term traders are beginning to worry about potential exhaustion, the broader trend remains intact.
Some key on-chain metrics still suggest strong holding behaviour, which adds a layer of confidence to the ongoing trend.
Technical Analysis
By Shayan
The Daily Chart
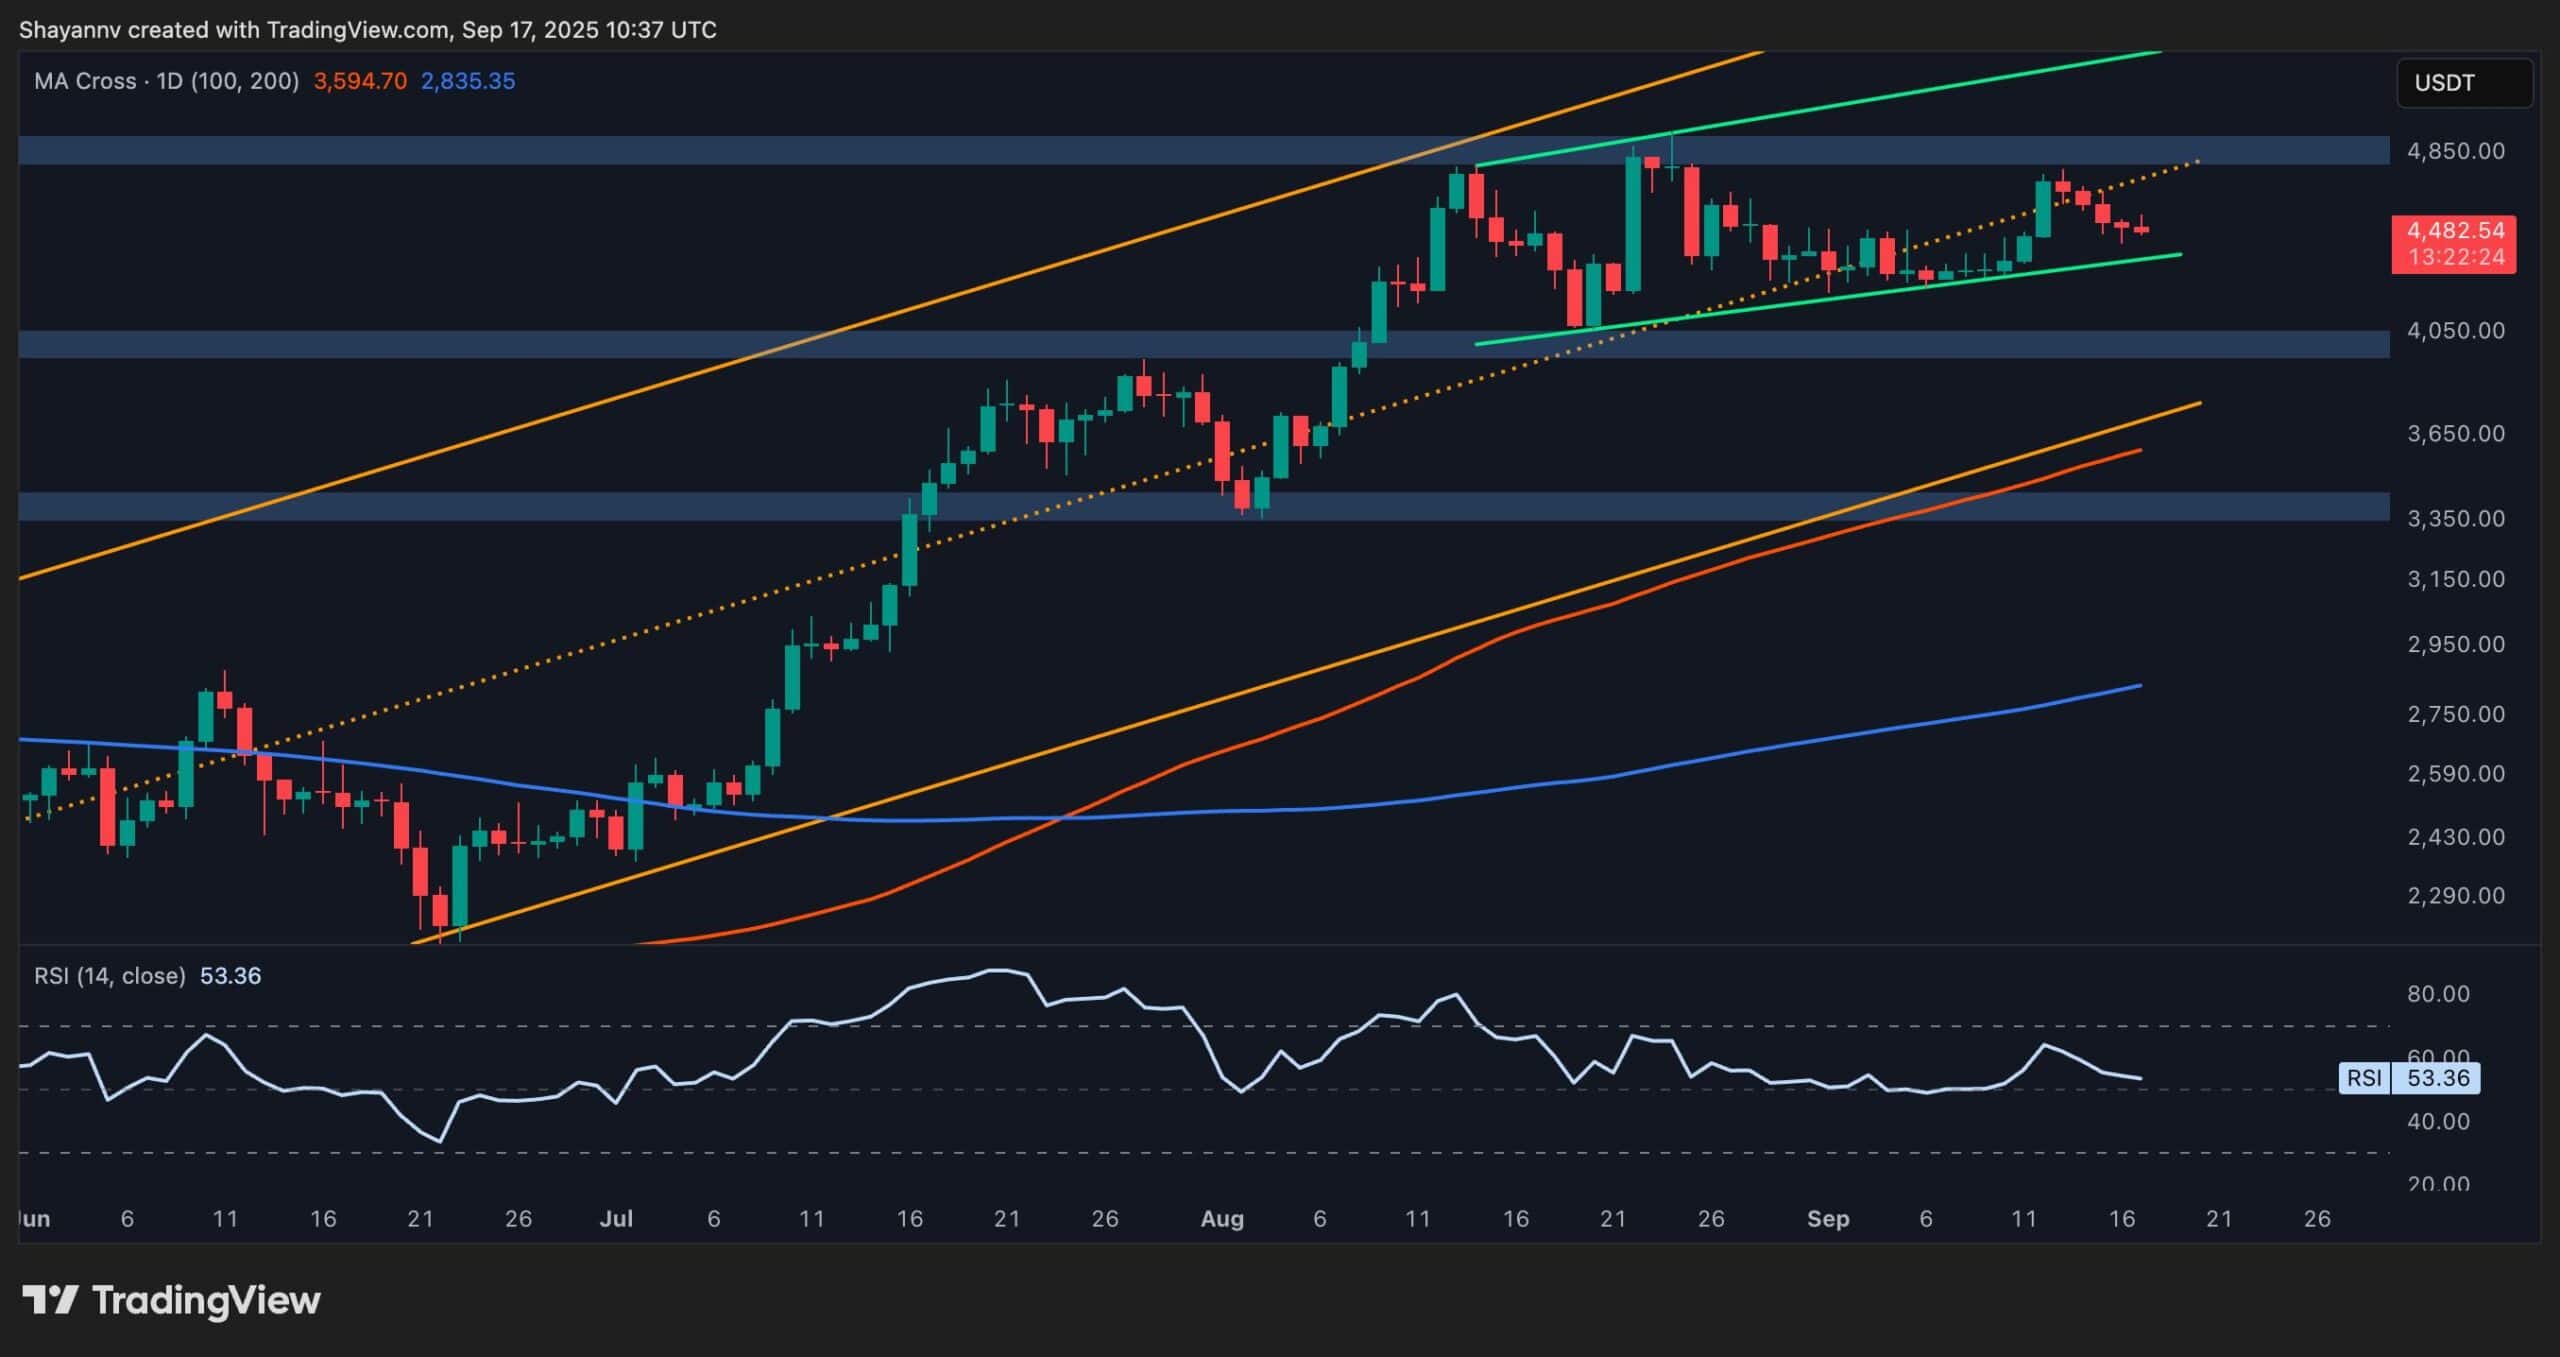
On the daily timeframe, ETH has been respecting a steep ascending channel over the past few months. The price action has continued to make higher highs and higher lows, which confirms a strong bullish structure.
Importantly, the 100-day moving average has also crossed above the 200-day MA a couple of months ago, which historically signals a mid-term uptrend. Despite minor pullbacks, the asset has been finding support near the midline of the channel.
Meanwhile, the bullish momentum is definitely fading, as the price has also been consolidating below a key resistance area at $4,850, which was tested multiple times without a breakout. This kind of tightening range can often lead to explosive moves in either direction.
If ETH breaks above the $4,850 ceiling with volume, the rally could extend toward the channel’s upper boundary. On the flip side, a breakdown from the current ascending pattern could see ETH retest the $4,000 zone before finding fresh buyers.

The 4-Hour Chart
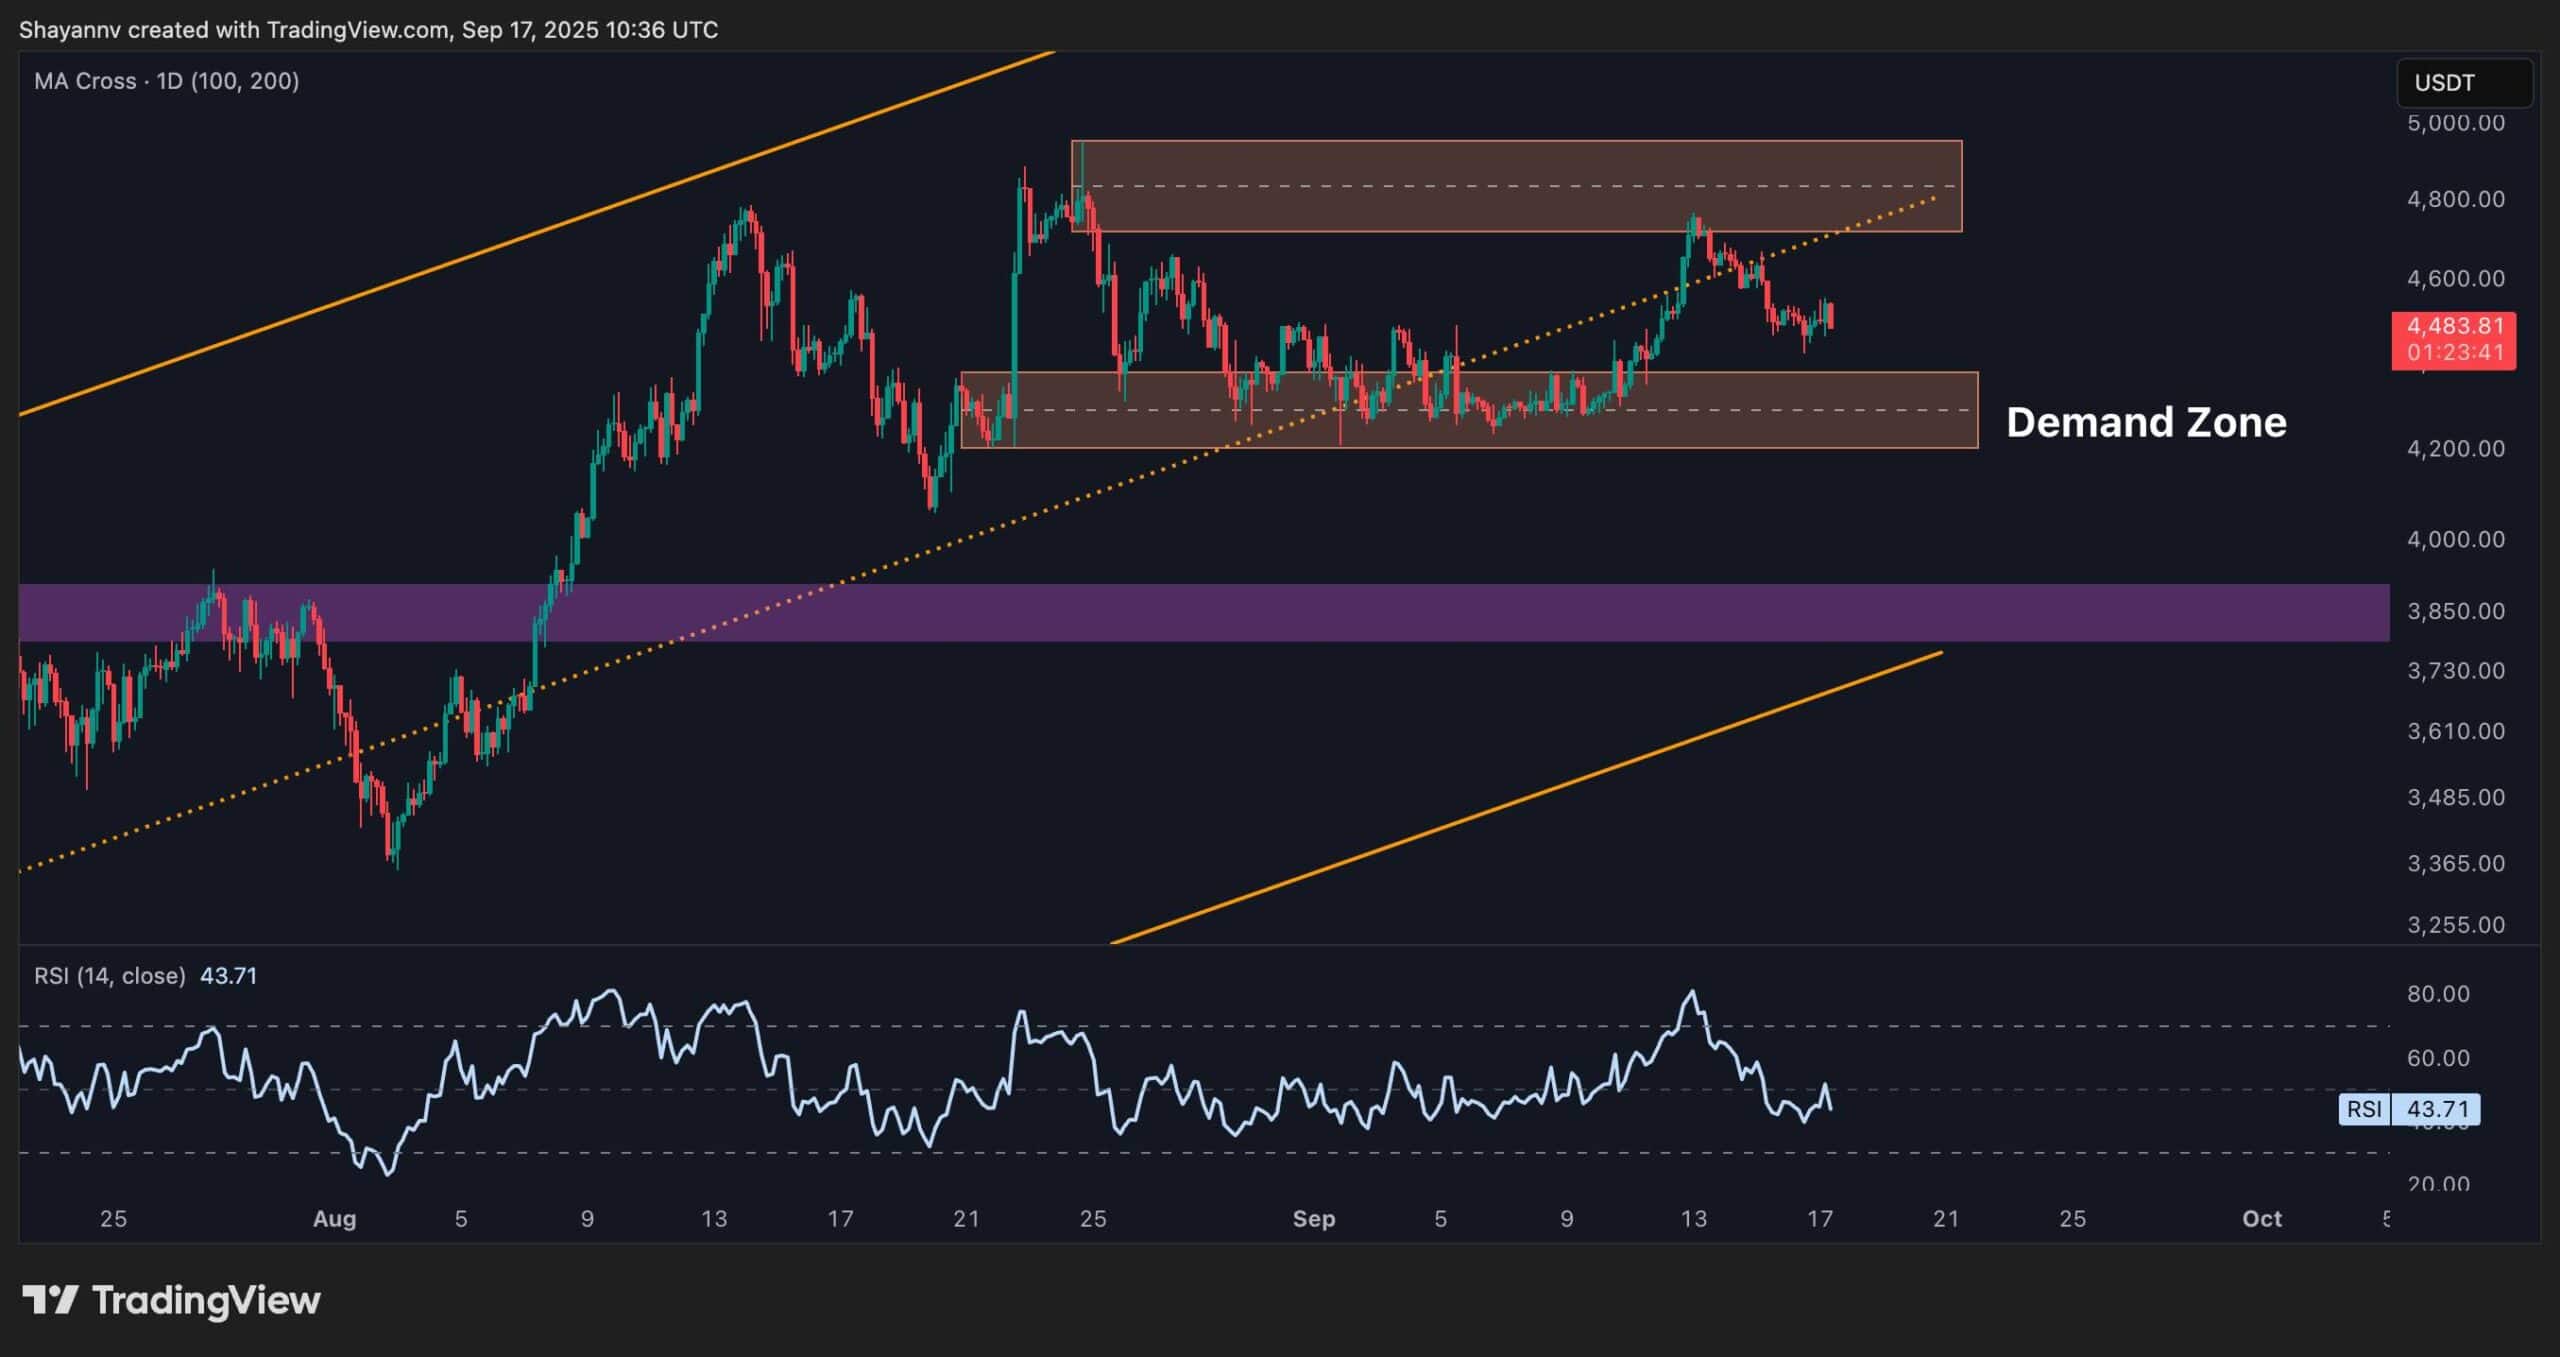
The 4H chart gives us a closer view of what’s happening inside that daily range. ETH has been moving within a clean consolidation range, bouncing between the $4,300 and $4,800 levels. This sideways structure is forming just beneath a key resistance zone, which shows that buyers are not aggressively chasing prices here. Instead, they’re waiting for a deeper pullback or a confirmed breakout.
If this range breaks to the downside, the next area of interest is the highlighted purple demand zone just below the $4,000 key level. This zone also has confluence with the ascending trendline and could attract long-term buyers. Yet, for now, the RSI has dipped below 50, and it suggests that the bulls are losing a bit of control on the intraday timeframe. Therefore, a pullback might be the more probable scenario in the short term.
Onchain Analysis
Exchange Reserve
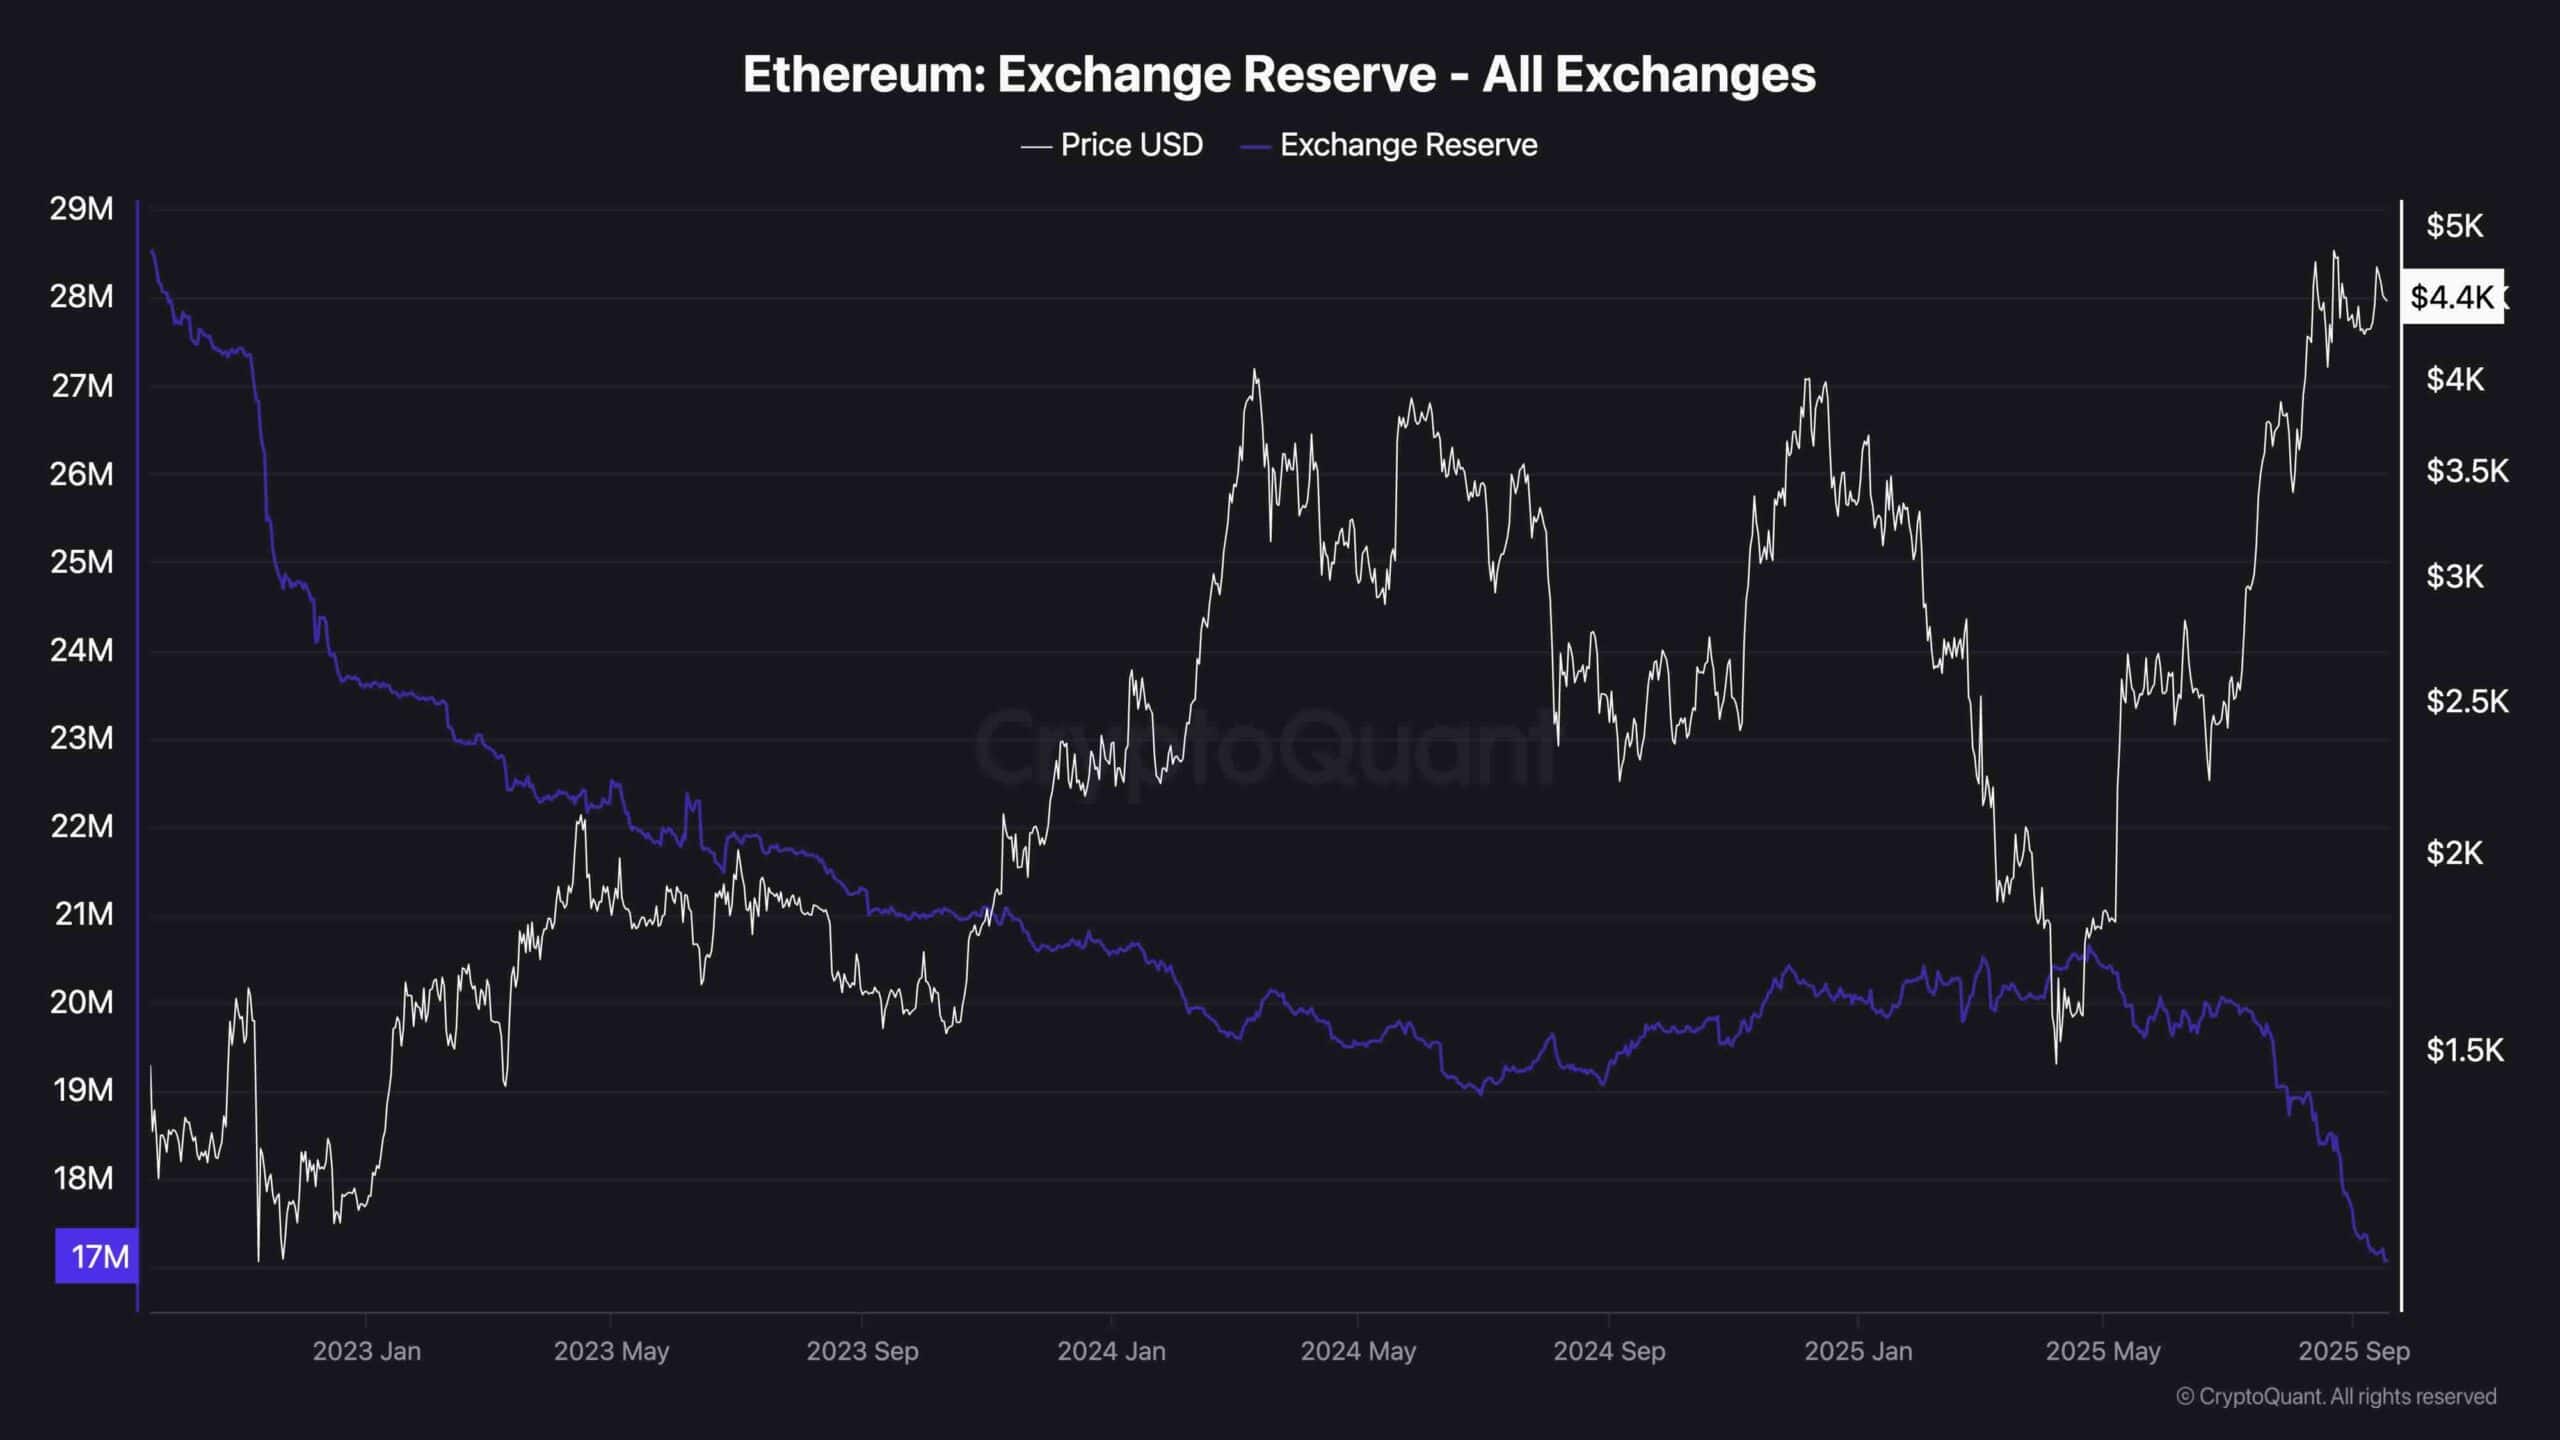
On-chain data from CryptoQuant shows a clear trend of declining ETH exchange reserves, which is a strong bullish signal from a long-term perspective. Since 2022, ETH held on exchanges has dropped from over 28 million to under 17 million, marking a multi-year low.
This consistent outflow indicates that large holders and long-term investors continue withdrawing their ETH from centralized platforms, likely for staking, DeFi use, or cold storage.
The relationship between exchange reserves and price is often inverse. When reserves fall, it means there’s less ETH available to sell on the open market, which can lead to supply-side pressure and eventual price appreciation.
The recent acceleration in outflows during the price rally to $4.4K adds another layer of conviction. It shows that despite price gains, holders are not rushing to take profit. This is a healthy sign of confidence in ETH’s longer-term potential.
The post Ethereum Price Analysis: Can ETH Push Toward $5K as Bullish Momentum Returns? appeared first on CryptoPotato.