Bitcoin is on the verge of breaking below its crucial wedge pattern, likely indicating a bearish sentiment in the market. Nevertheless, the price is recharging within equilibrium, awaiting either institutional absorption or a deeper liquidity sweep before the next major expansion.
Technical Analysis
By Shayan
The Daily Chart
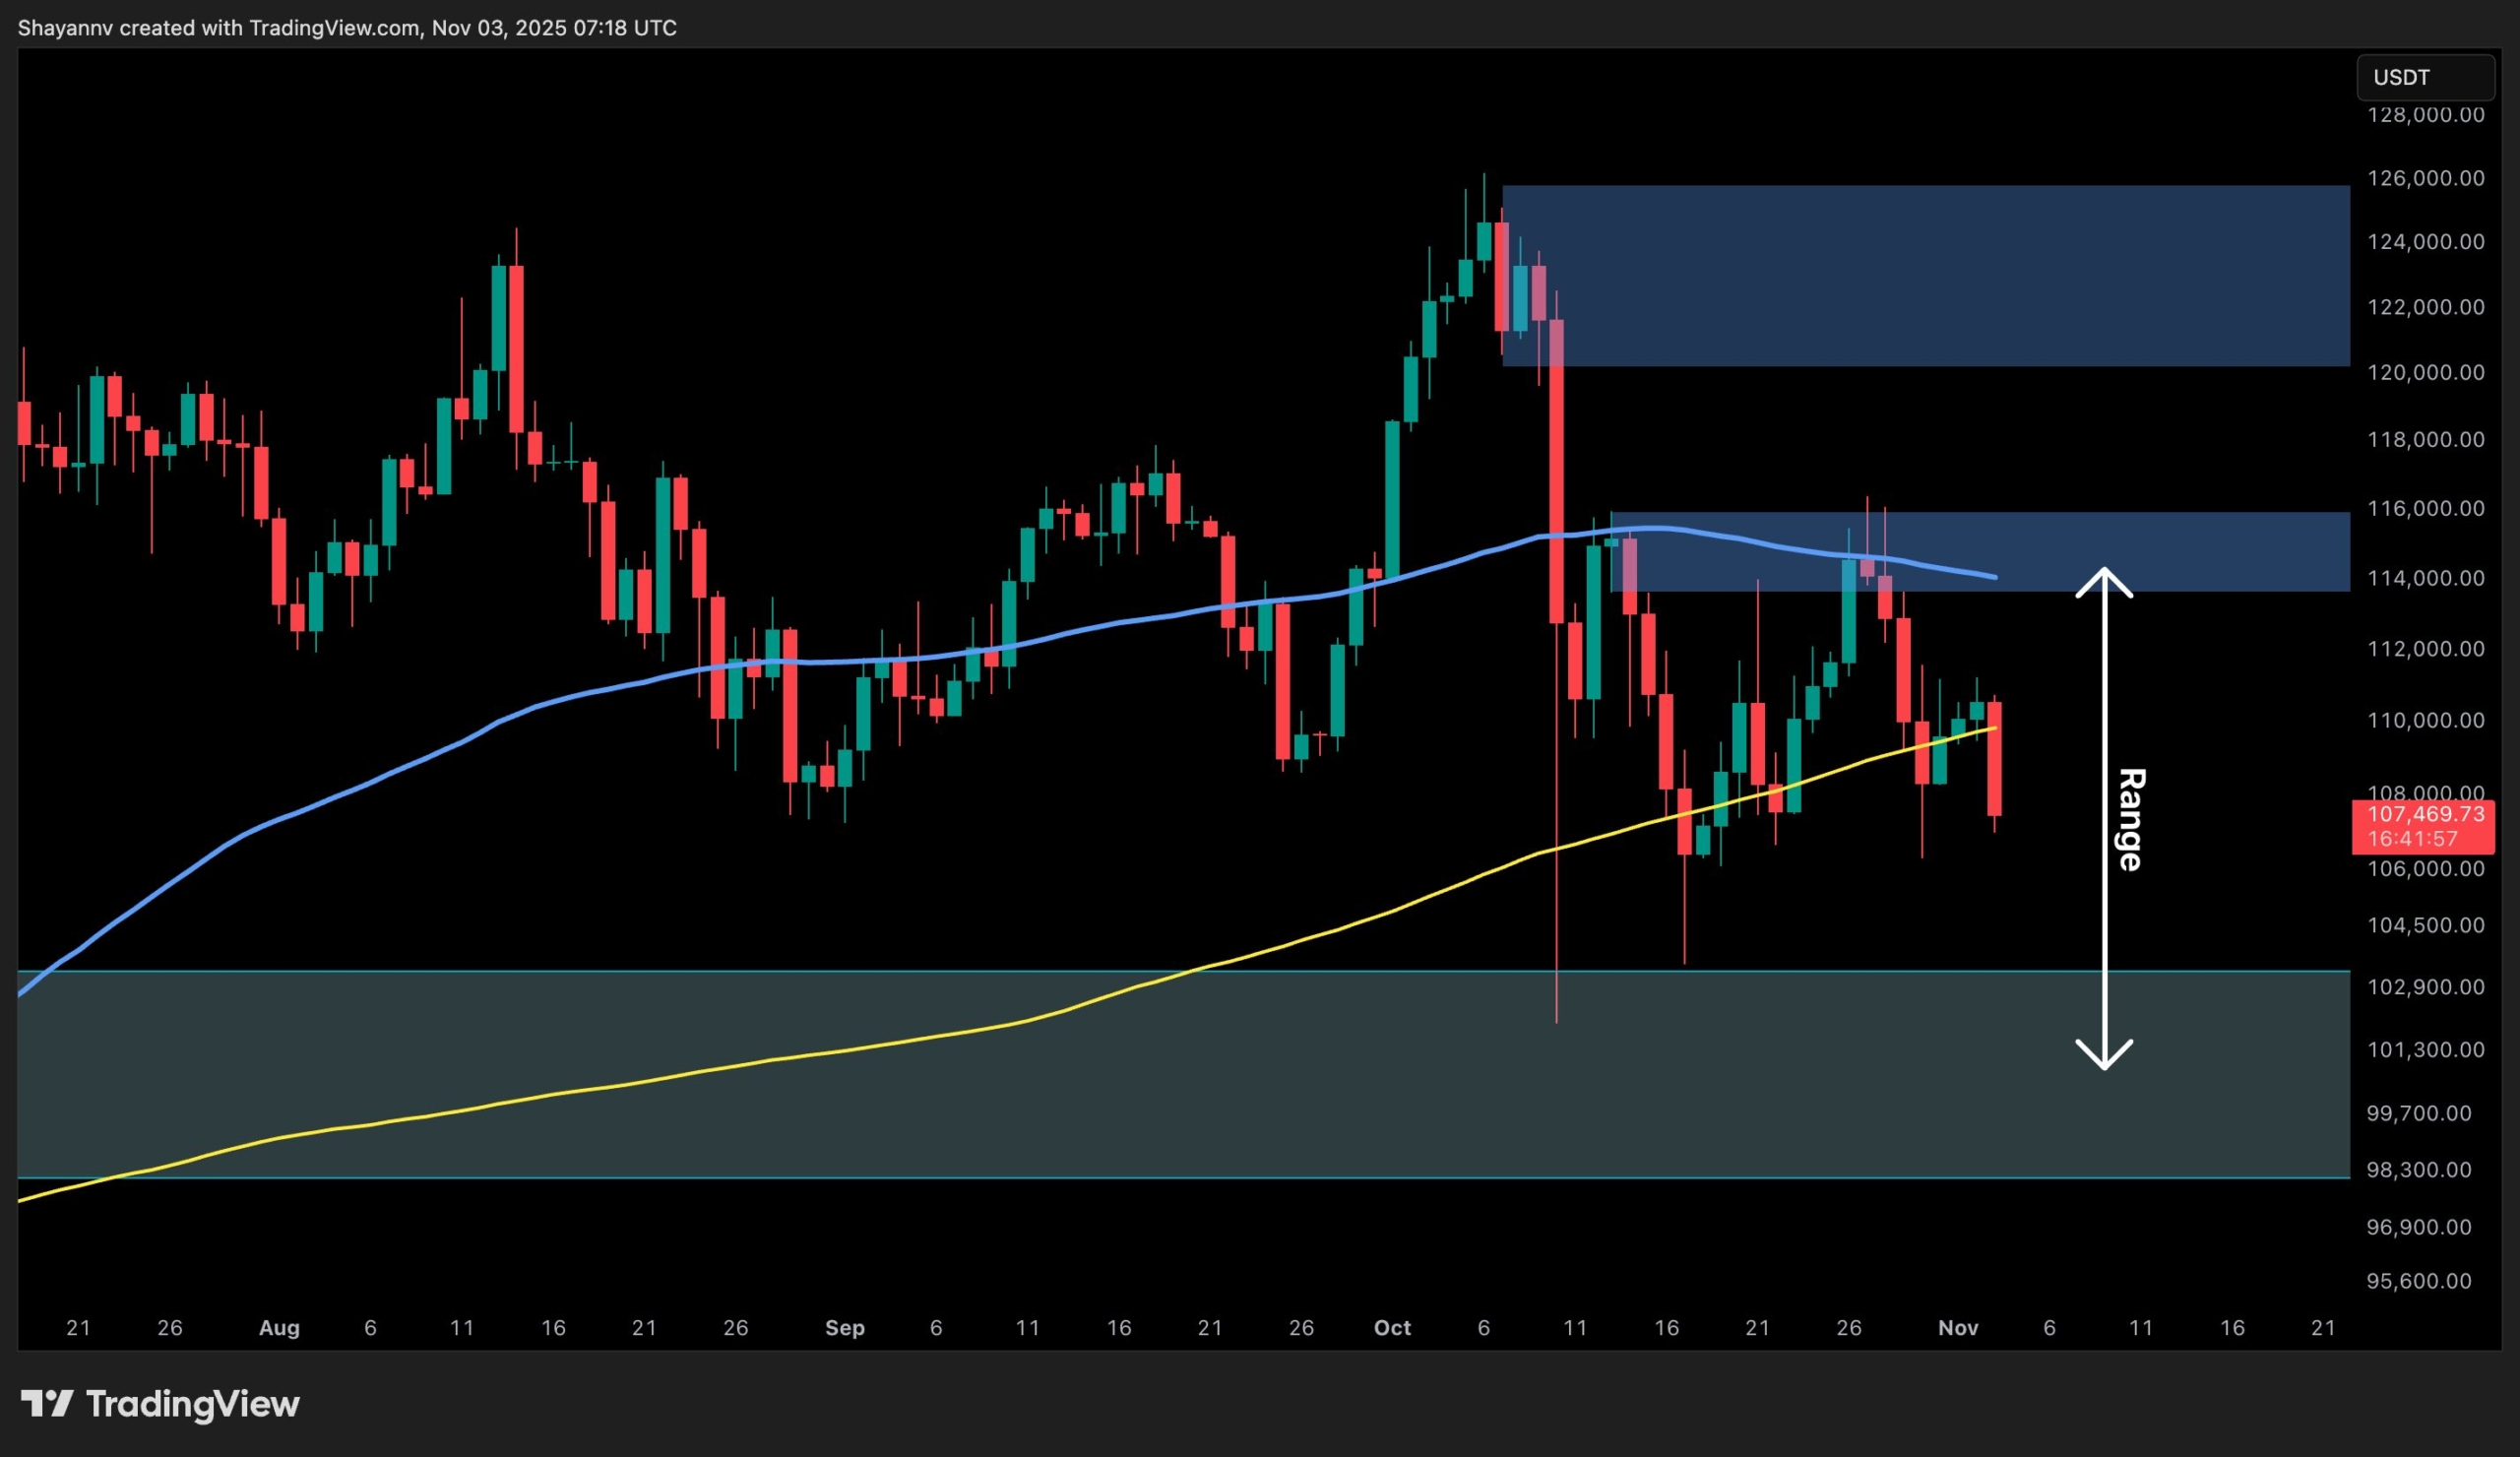
On the daily timeframe, Bitcoin has decisively broken below the 200-day MA of $109K, indicating a notable bearish sign.
The market has repeatedly rebounded from the $103K–$108K demand zone, suggesting that buyers are still active at these levels. Yet, the series of lower highs below $116K indicates ongoing pressure from the supply zone, keeping the price locked in an equilibrium range between $105K and $116K.
This structure resembles a mid-range accumulation pattern, where liquidity is continuously recycled between buyers and sellers before a larger directional expansion.
A decisive daily close back above the 200-day MA would mark a bear trap and false breakout, leading to a bullish structural shift toward $116K supply zone, while a breakdown below the $106K support could trigger a retest of the $102K–$100K institutional demand block.
The 4-Hour Chart
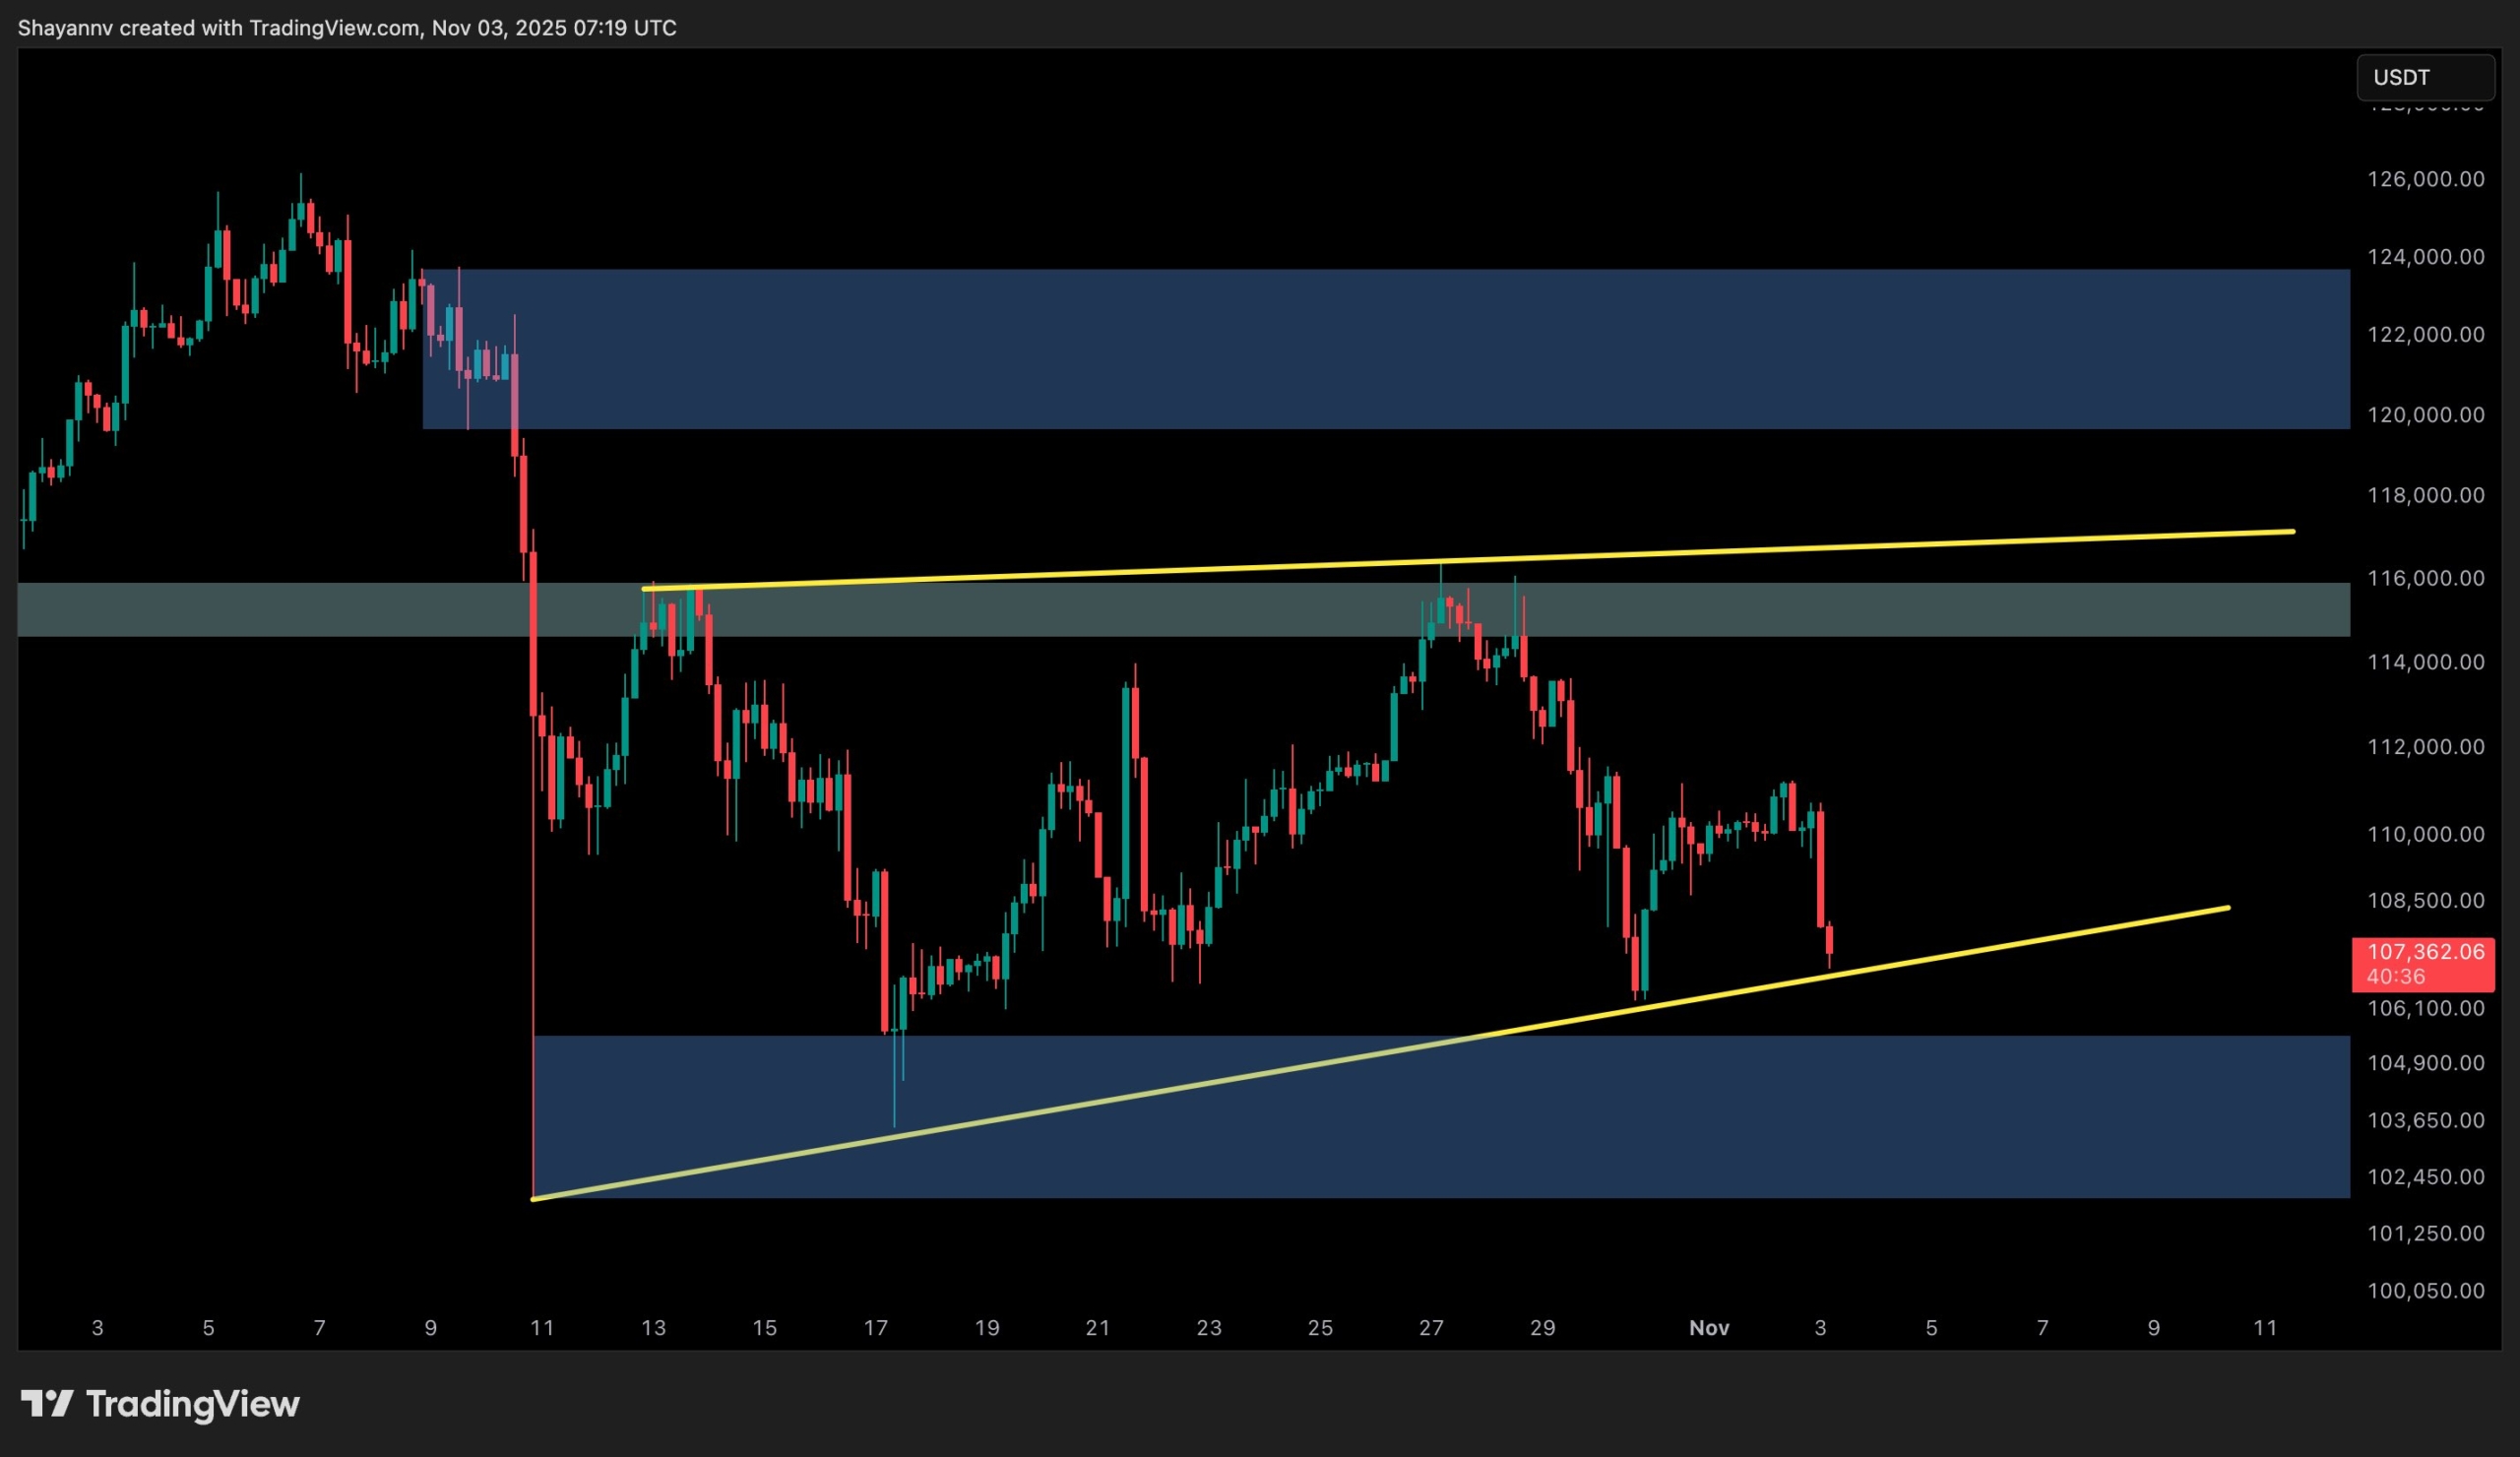
The 4-hour chart highlights the current ascending wedge formation, with BTC retesting the lower trendline near the $106K support zone.
This area aligns with the bottom of the larger daily equilibrium range, making it a critical region to monitor for a potential rebound. A successful defense of this zone would likely set the stage for another retest of the $114K–$116K resistance, while failure to hold could result in a sharper move toward the $102K demand region.
Volume and liquidity metrics suggest that buyers remain cautious, waiting for clear confirmation before re-engaging aggressively.
On-Chain Analysis
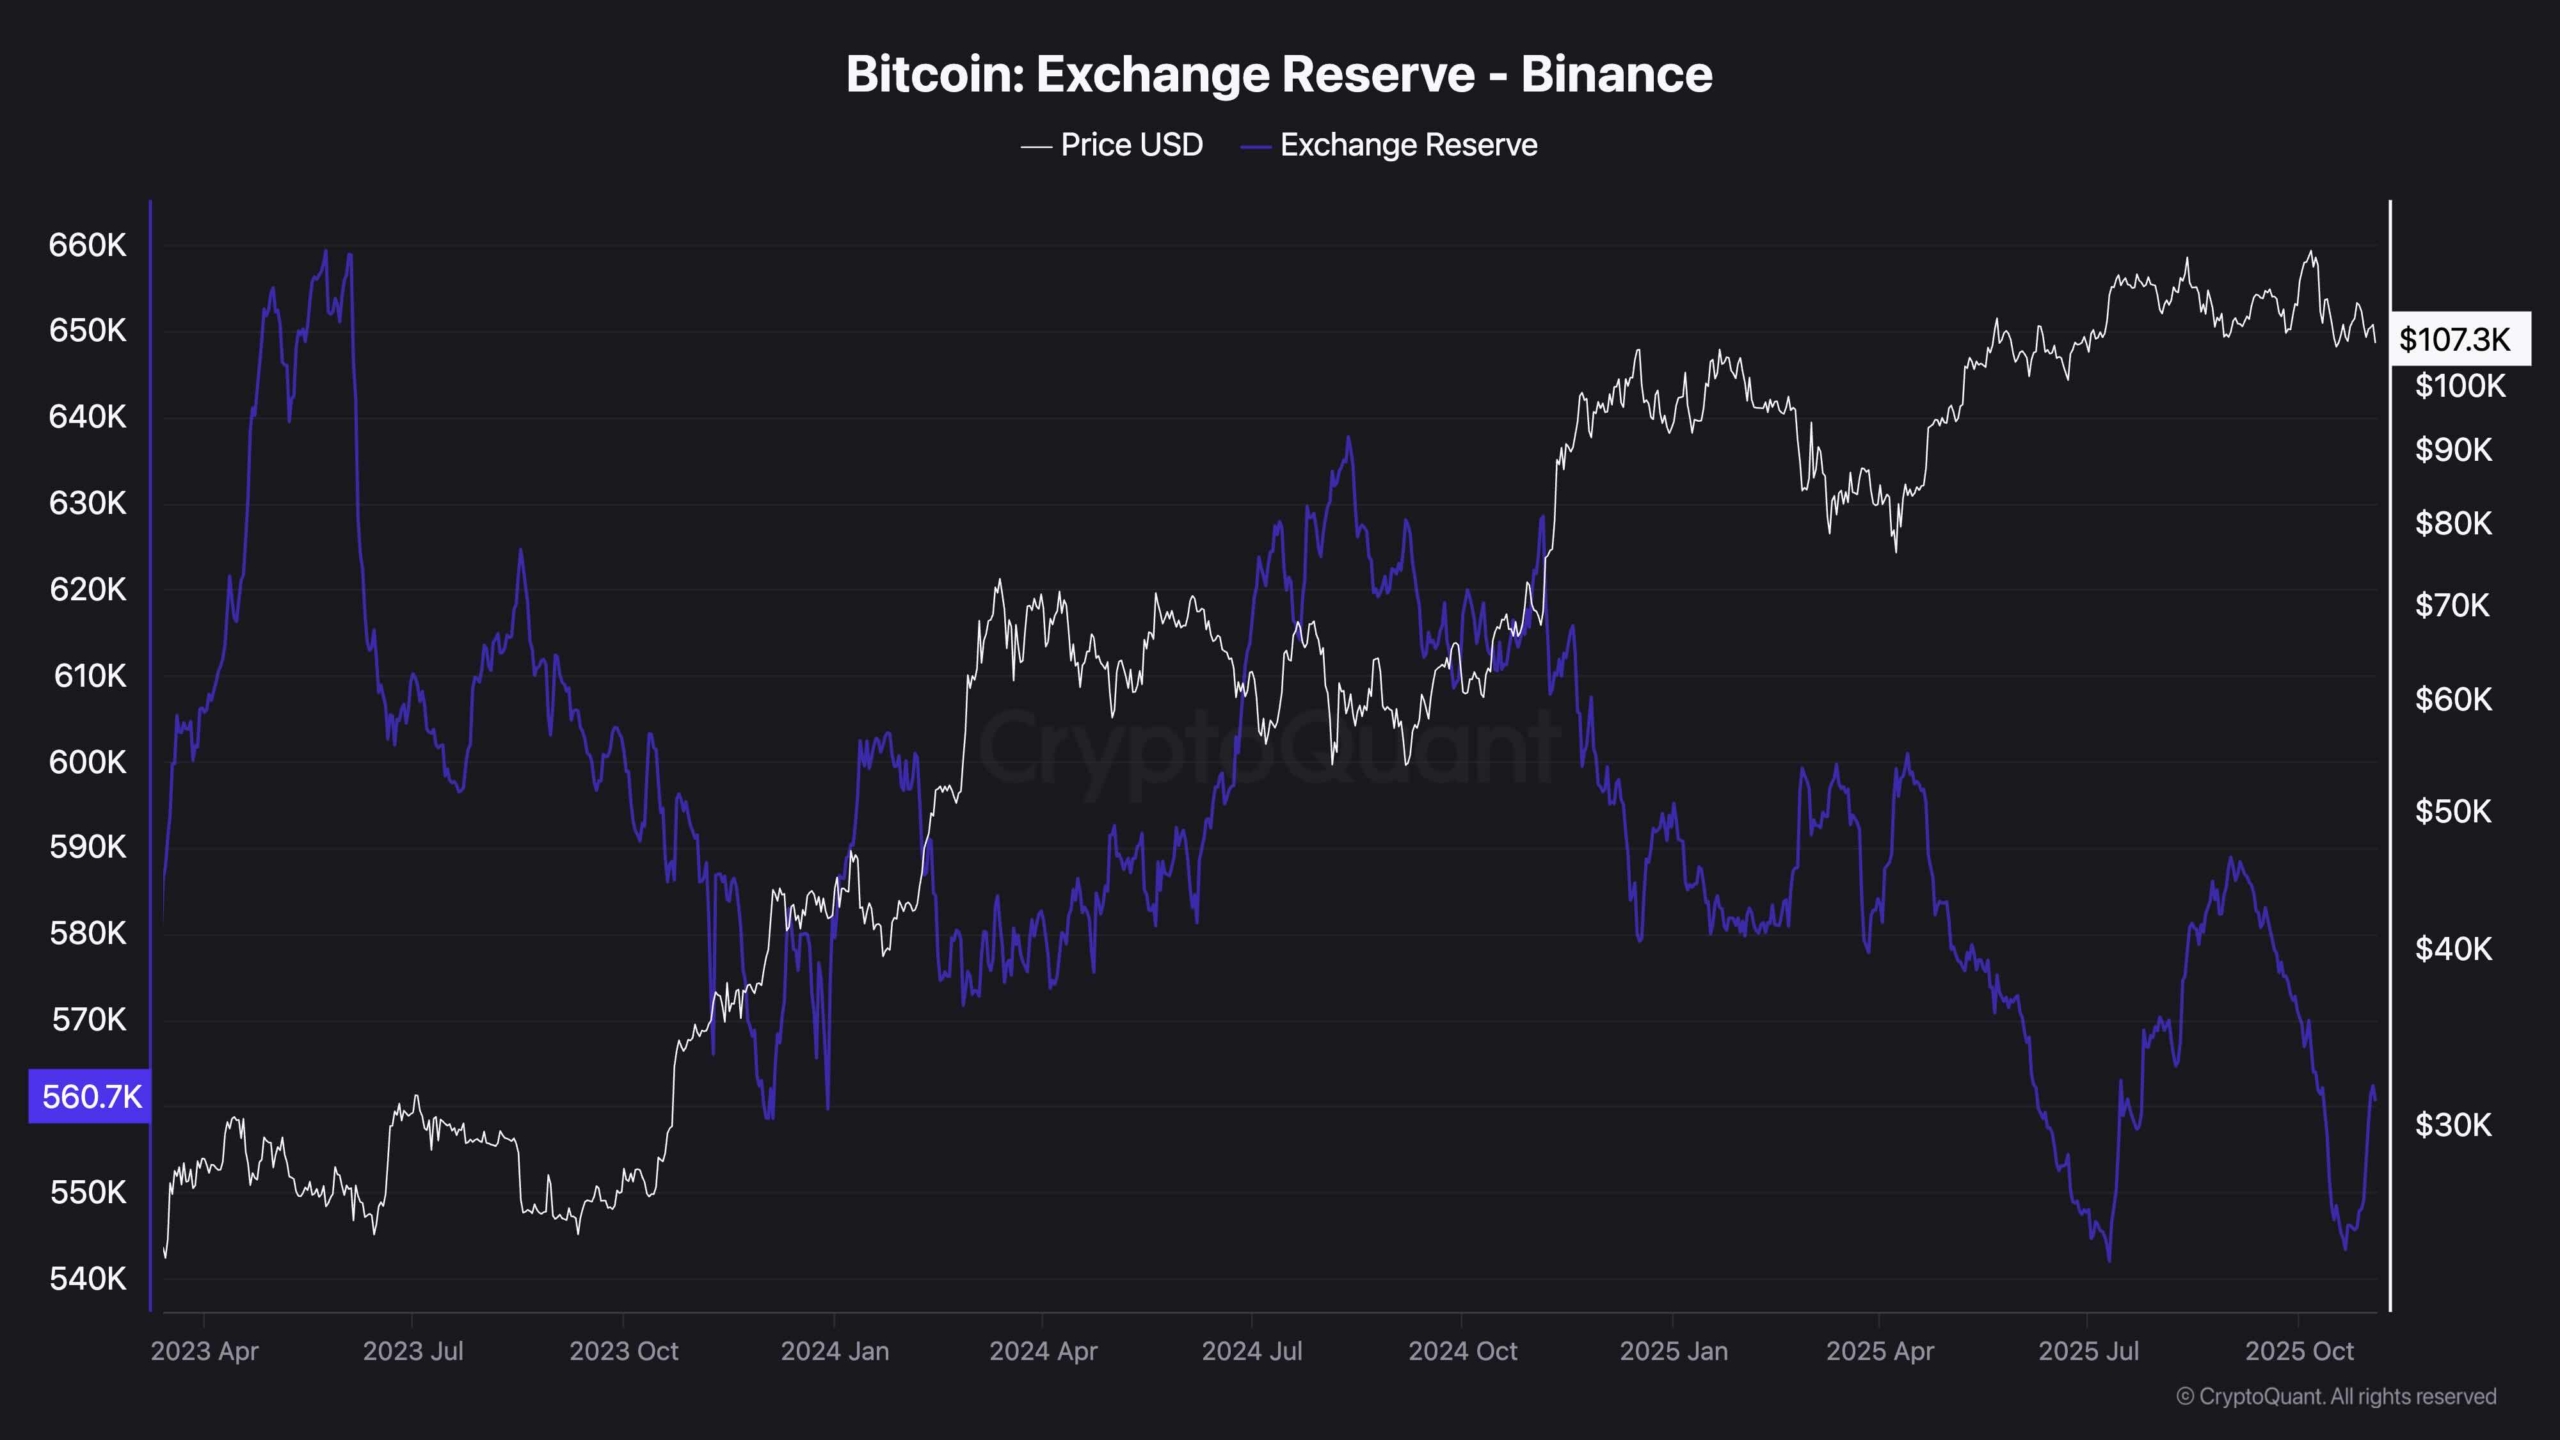
The latest Exchange Reserve data reveals a crucial divergence between global and localized exchange trends. While total Bitcoin reserves across all major exchanges have continued to decline, signaling long-term accumulation and reduced selling pressure, Binance’s exchange reserves have notably increased in recent weeks.
This discrepancy implies that while the broader market participants are moving coins into self-custody (a bullish long-term signal), short-term liquidity is building up on Binance, potentially representing increased trading activity or hedging by institutional participants.
Historically, such inflows to a dominant exchange during consolidation phases often precede heightened volatility, as market makers position for the next major move.
If this rising Binance reserve trend continues while total exchange reserves drop, it may point toward a pre-distribution or rebalancing phase before another accumulation-driven rally begins.
The post Bitcoin Price Analysis: Bearish Signs Emerge as BTC Breaks Below Crucial Support appeared first on CryptoPotato.