Ripple’s XRP has trended upward since June 22, soaring by nearly 30% over the past two weeks. This rally has been fueled partly by renewed interest across the broader market, which has sent many assets to multi-week highs.
However, there’s a catch. Despite the bullish sentiment, two key on-chain signals suggest a potential pullback may be on the horizon.
XRP Rally Faces Test as Long-Held Coins Return to Market
Since XRP plunged to a cycle low of $1.90 during the intraday trading session on June 22, its price has maintained an uptrend. Climbing by almost 30% since then, the altcoin currently trades at $2.58.
Since the rally began, XRP’s Dormancy Flow has been on a gradual upward climb. On-chain data reveals that the metric also hit a year-to-date low on June 22, but has since trended higher. At press time, Dormancy Flow stands at 1.19 billion XRP.
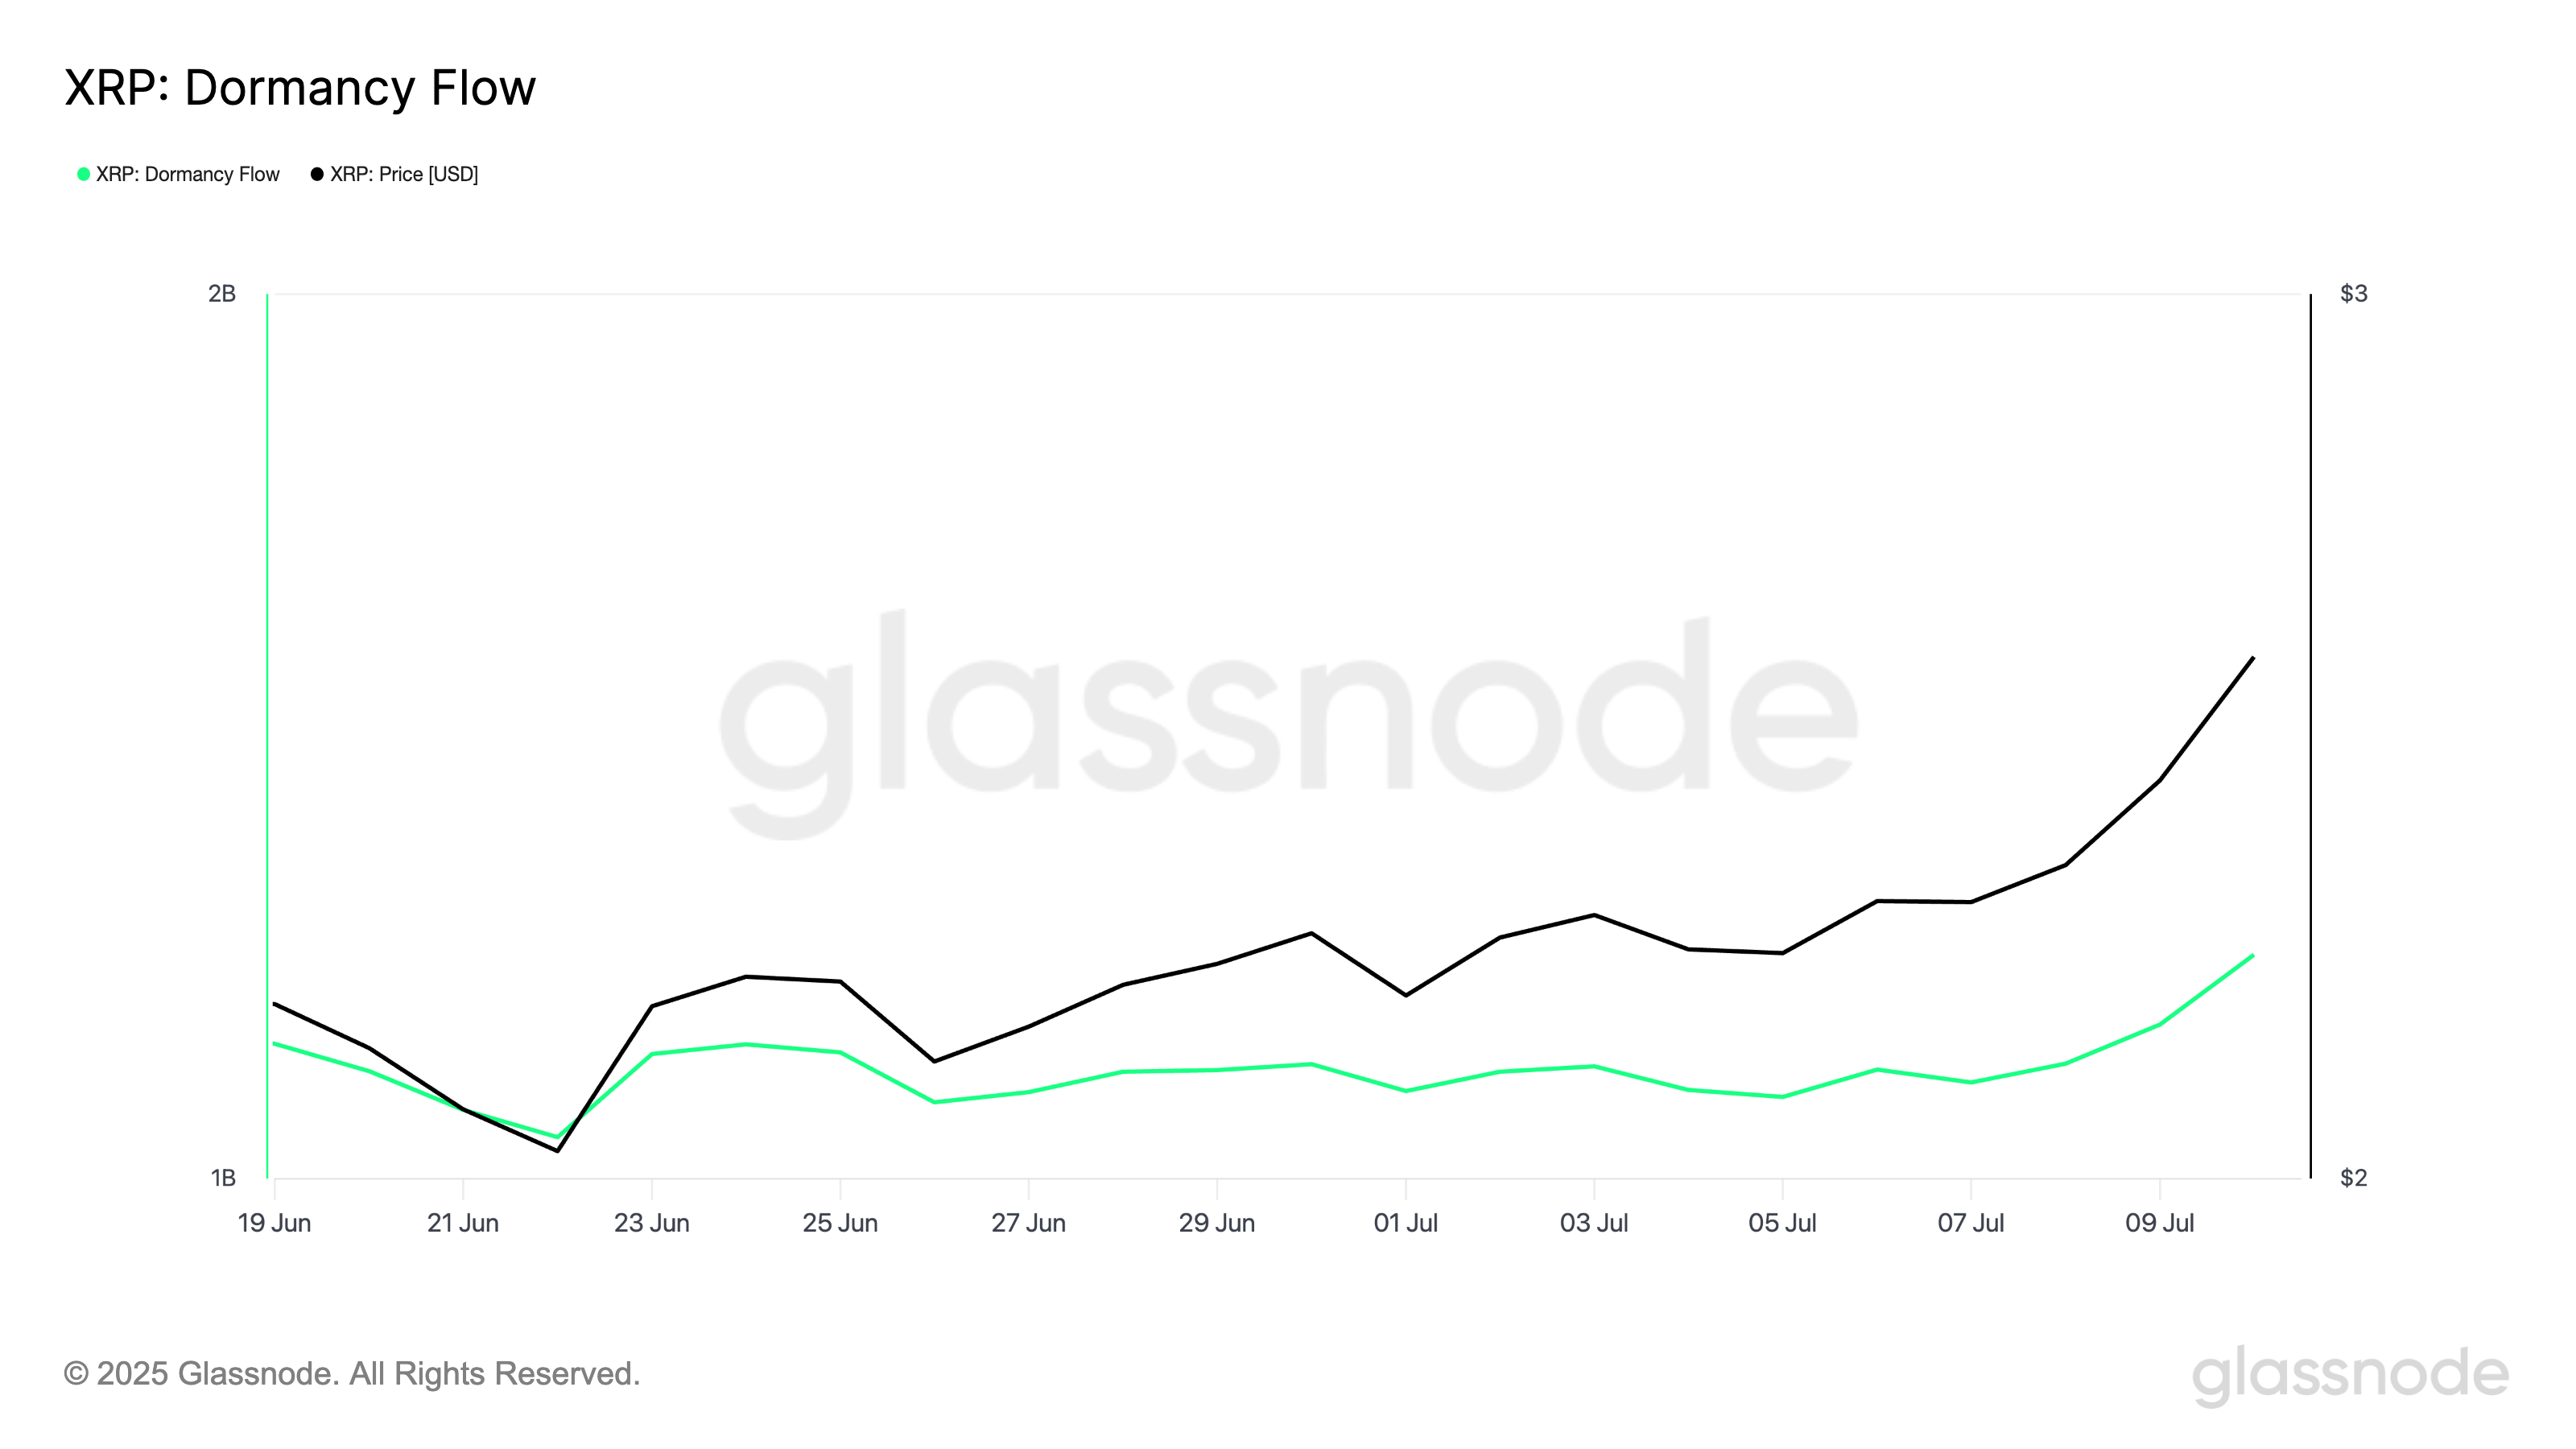
Dormancy Flow gives insight into whether long-term holders (LTHs) are actively spending or staying put. When it falls, especially to historically low levels, it indicates that the coins being transacted are relatively “young,” and long-term holders stay inactive.
This occurs during bear markets or accumulation phases, when prices are low and conviction is high among long-term holders.
Conversely, as with XRP, when an asset’s Dormancy Flow climbs, it suggests that older, dormant coins are being moved or sold. This activity is often seen in late-stage bull markets, when long-term holders start taking profits after a significant price run-up.
XRP’s rising Dormancy Flow reflects that more seasoned investors are confident enough to sell, a trend that could trigger a bearish reversal in the coming days.
Traders May Want To Lock In Profits
Additionally, per Glassnode, XRP’s Net Unrealized Profit/Loss (NUPL) metric places the market in a state of “belief.” At press time, the metric rests at 0.56 and continues to climb upward.
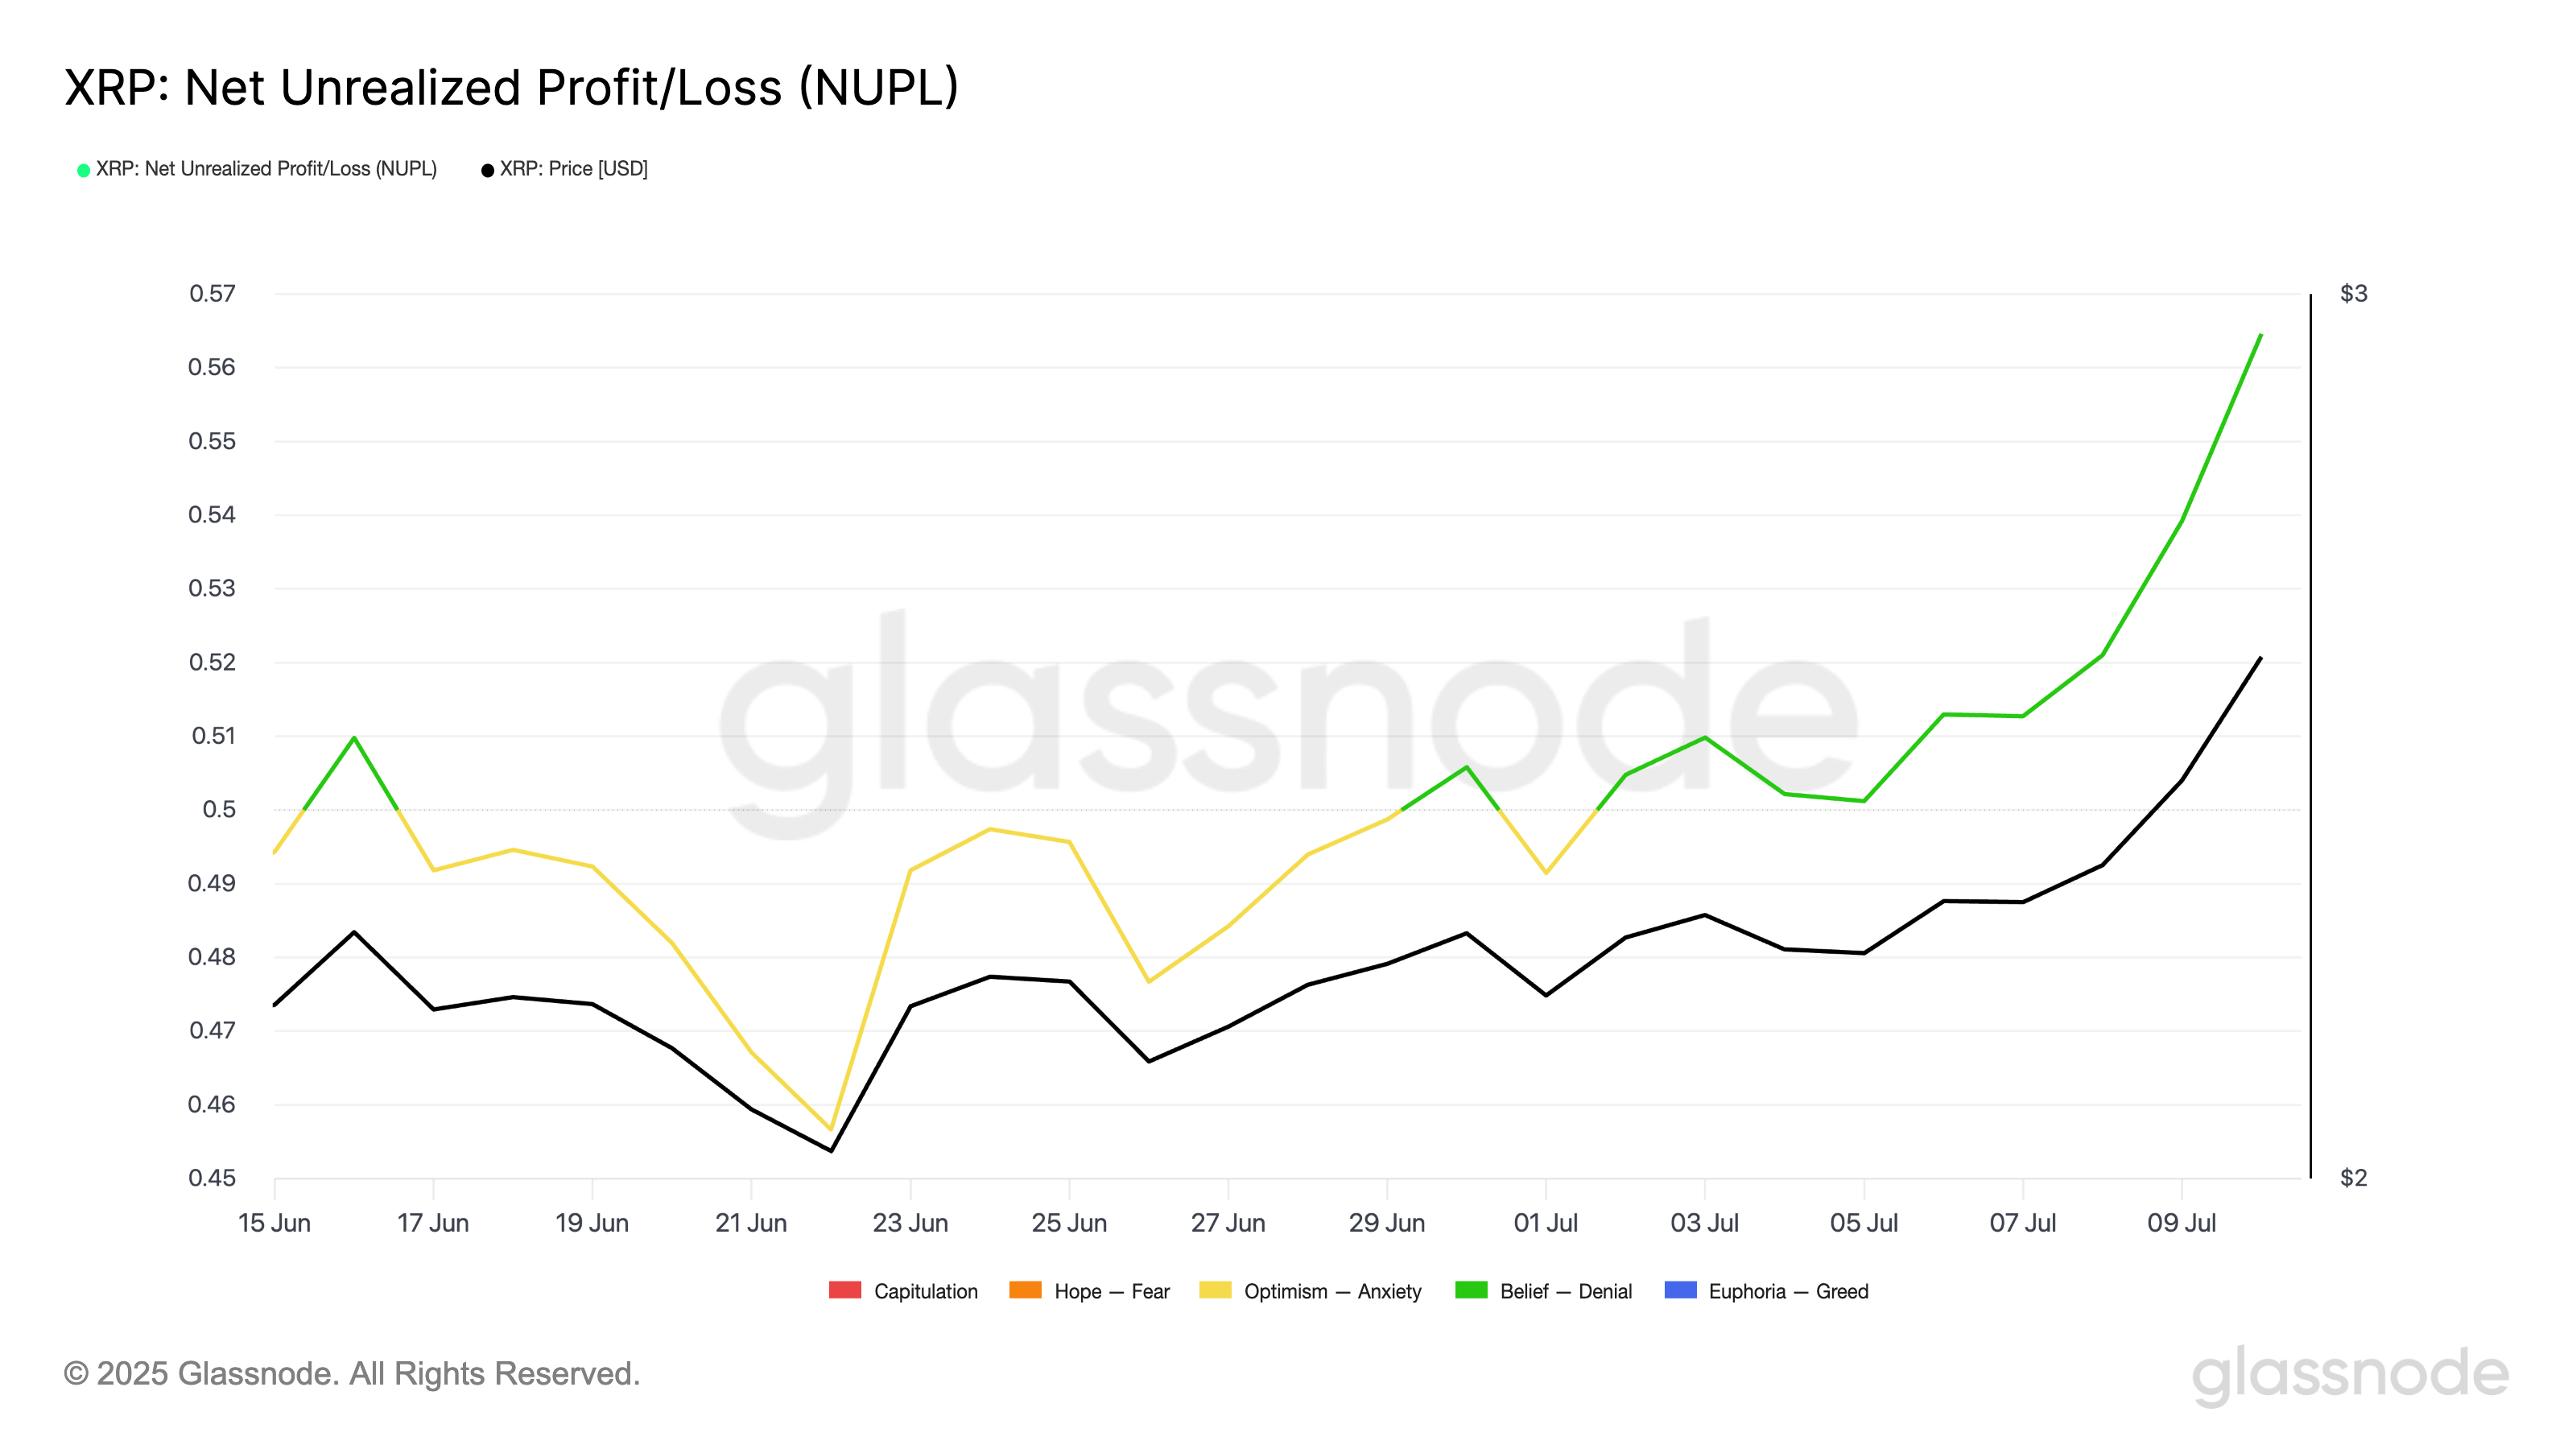
NUPL measures the difference between an asset’s current price and the price at which its coins
When the metric enters the Belief phase, it signals that investors are sitting on strong unrealized profits. If this follows a prolonged period of low price action—like what has been seen with XRP—holders may feel increasingly tempted to sell and secure gains.
With LTHs already beginning to move their coins, this phase can trigger a wave of selling pressure, potentially triggering a near-term price correction for XRP.
XRP Bulls Show Signs of Exhaustion
On the daily chart, readings from XRP’s Relative Strength Index (RSI) suggest that the market might be overheated. As of this writing, the token’s RSI is above 70 at 72.95, signalling impending buyers’ exhaustion.
The RSI indicator measures an asset’s overbought and oversold market conditions. It ranges between 0 and 100. Values above 70 suggest that the asset is overbought and due for a price decline, while values under 30 indicate that the asset is oversold and may witness a rebound.
At 72.95 and climbing, XRP’s RSI signals that the bullish momentum will soon experience a cooldown. Traders may interpret this as a cue to take profits, putting more pressure on XRP’s price.
If demand stalls over the next few trading sessions, XRP’s price could fall to $2.45.
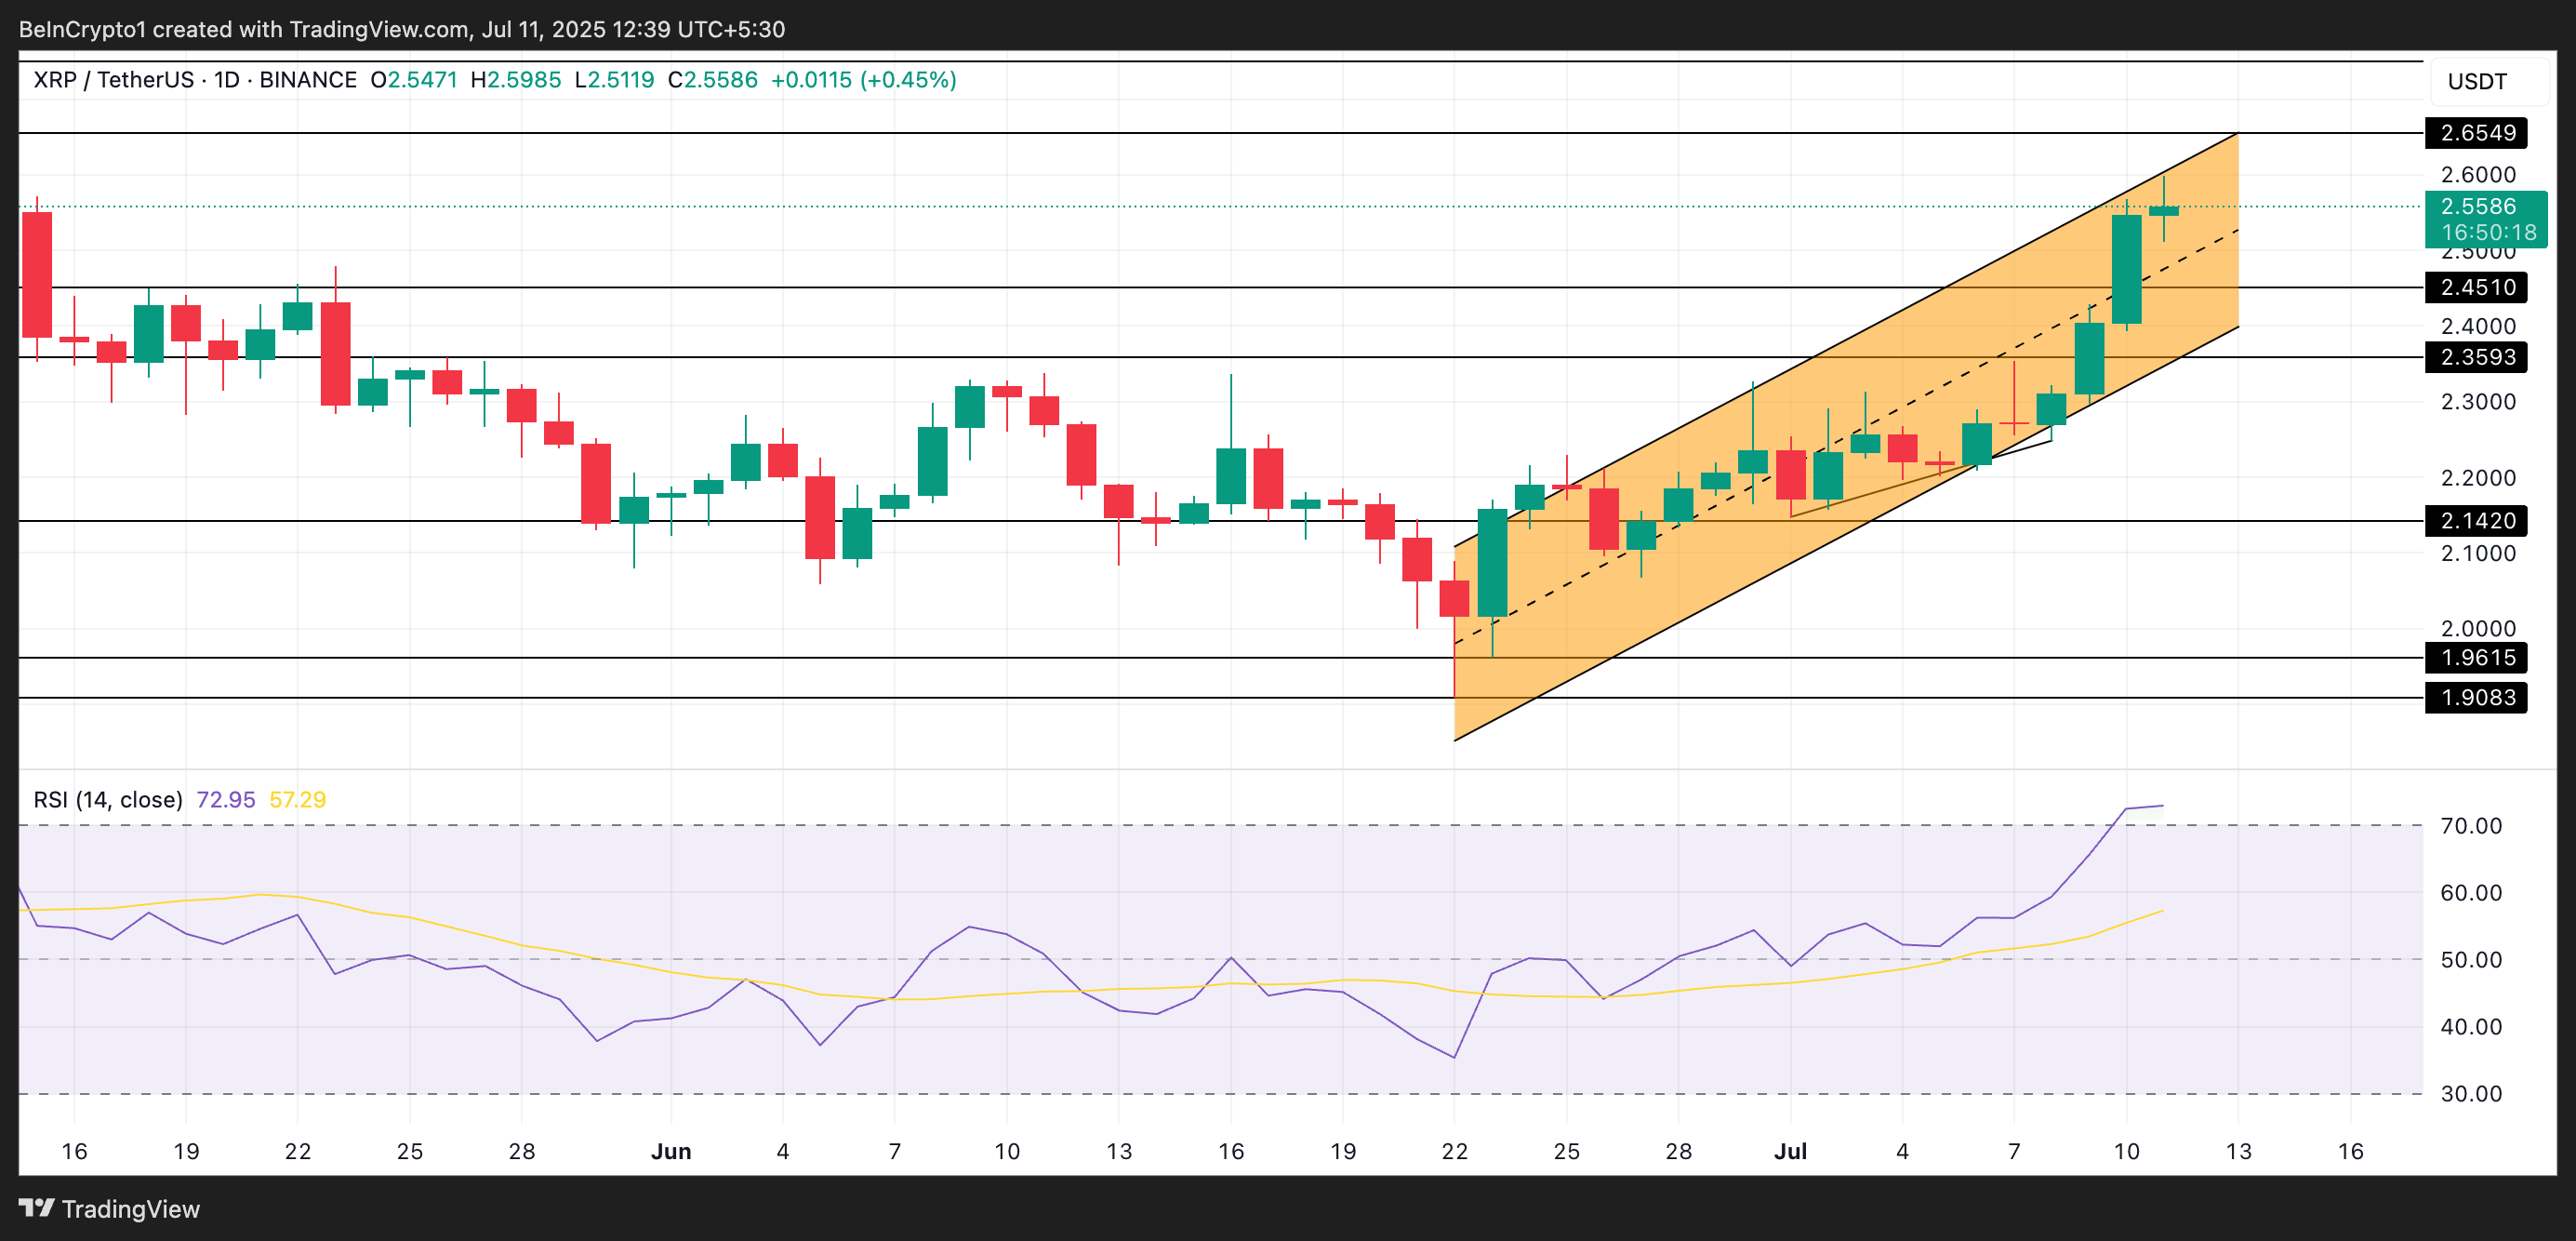
However, if buying pressure continues to grow, XRP could rally toward $2.65.
The post XRP’s Rally May Be Running Out of Steam—Here’s What On-Chain Data Shows appeared first on BeInCrypto.