XRP’s (XRP) price has declined nearly 10% since last Wednesday as macroeconomic pressures continue to weigh on the broader cryptocurrency market.
Notably, three key patterns that last appeared in 2022 have resurfaced, fueling concerns that XRP could slip below the $1 level.
3 Historical Parallels Signal Growing Risk for XRP
First, Glassnode’s data indicates that investors active in the 1-week to 1-month range are now accumulating at prices below the cost basis of the 6-month to 12-month holders. This shows that newer market participants are gaining exposure at more favorable levels.
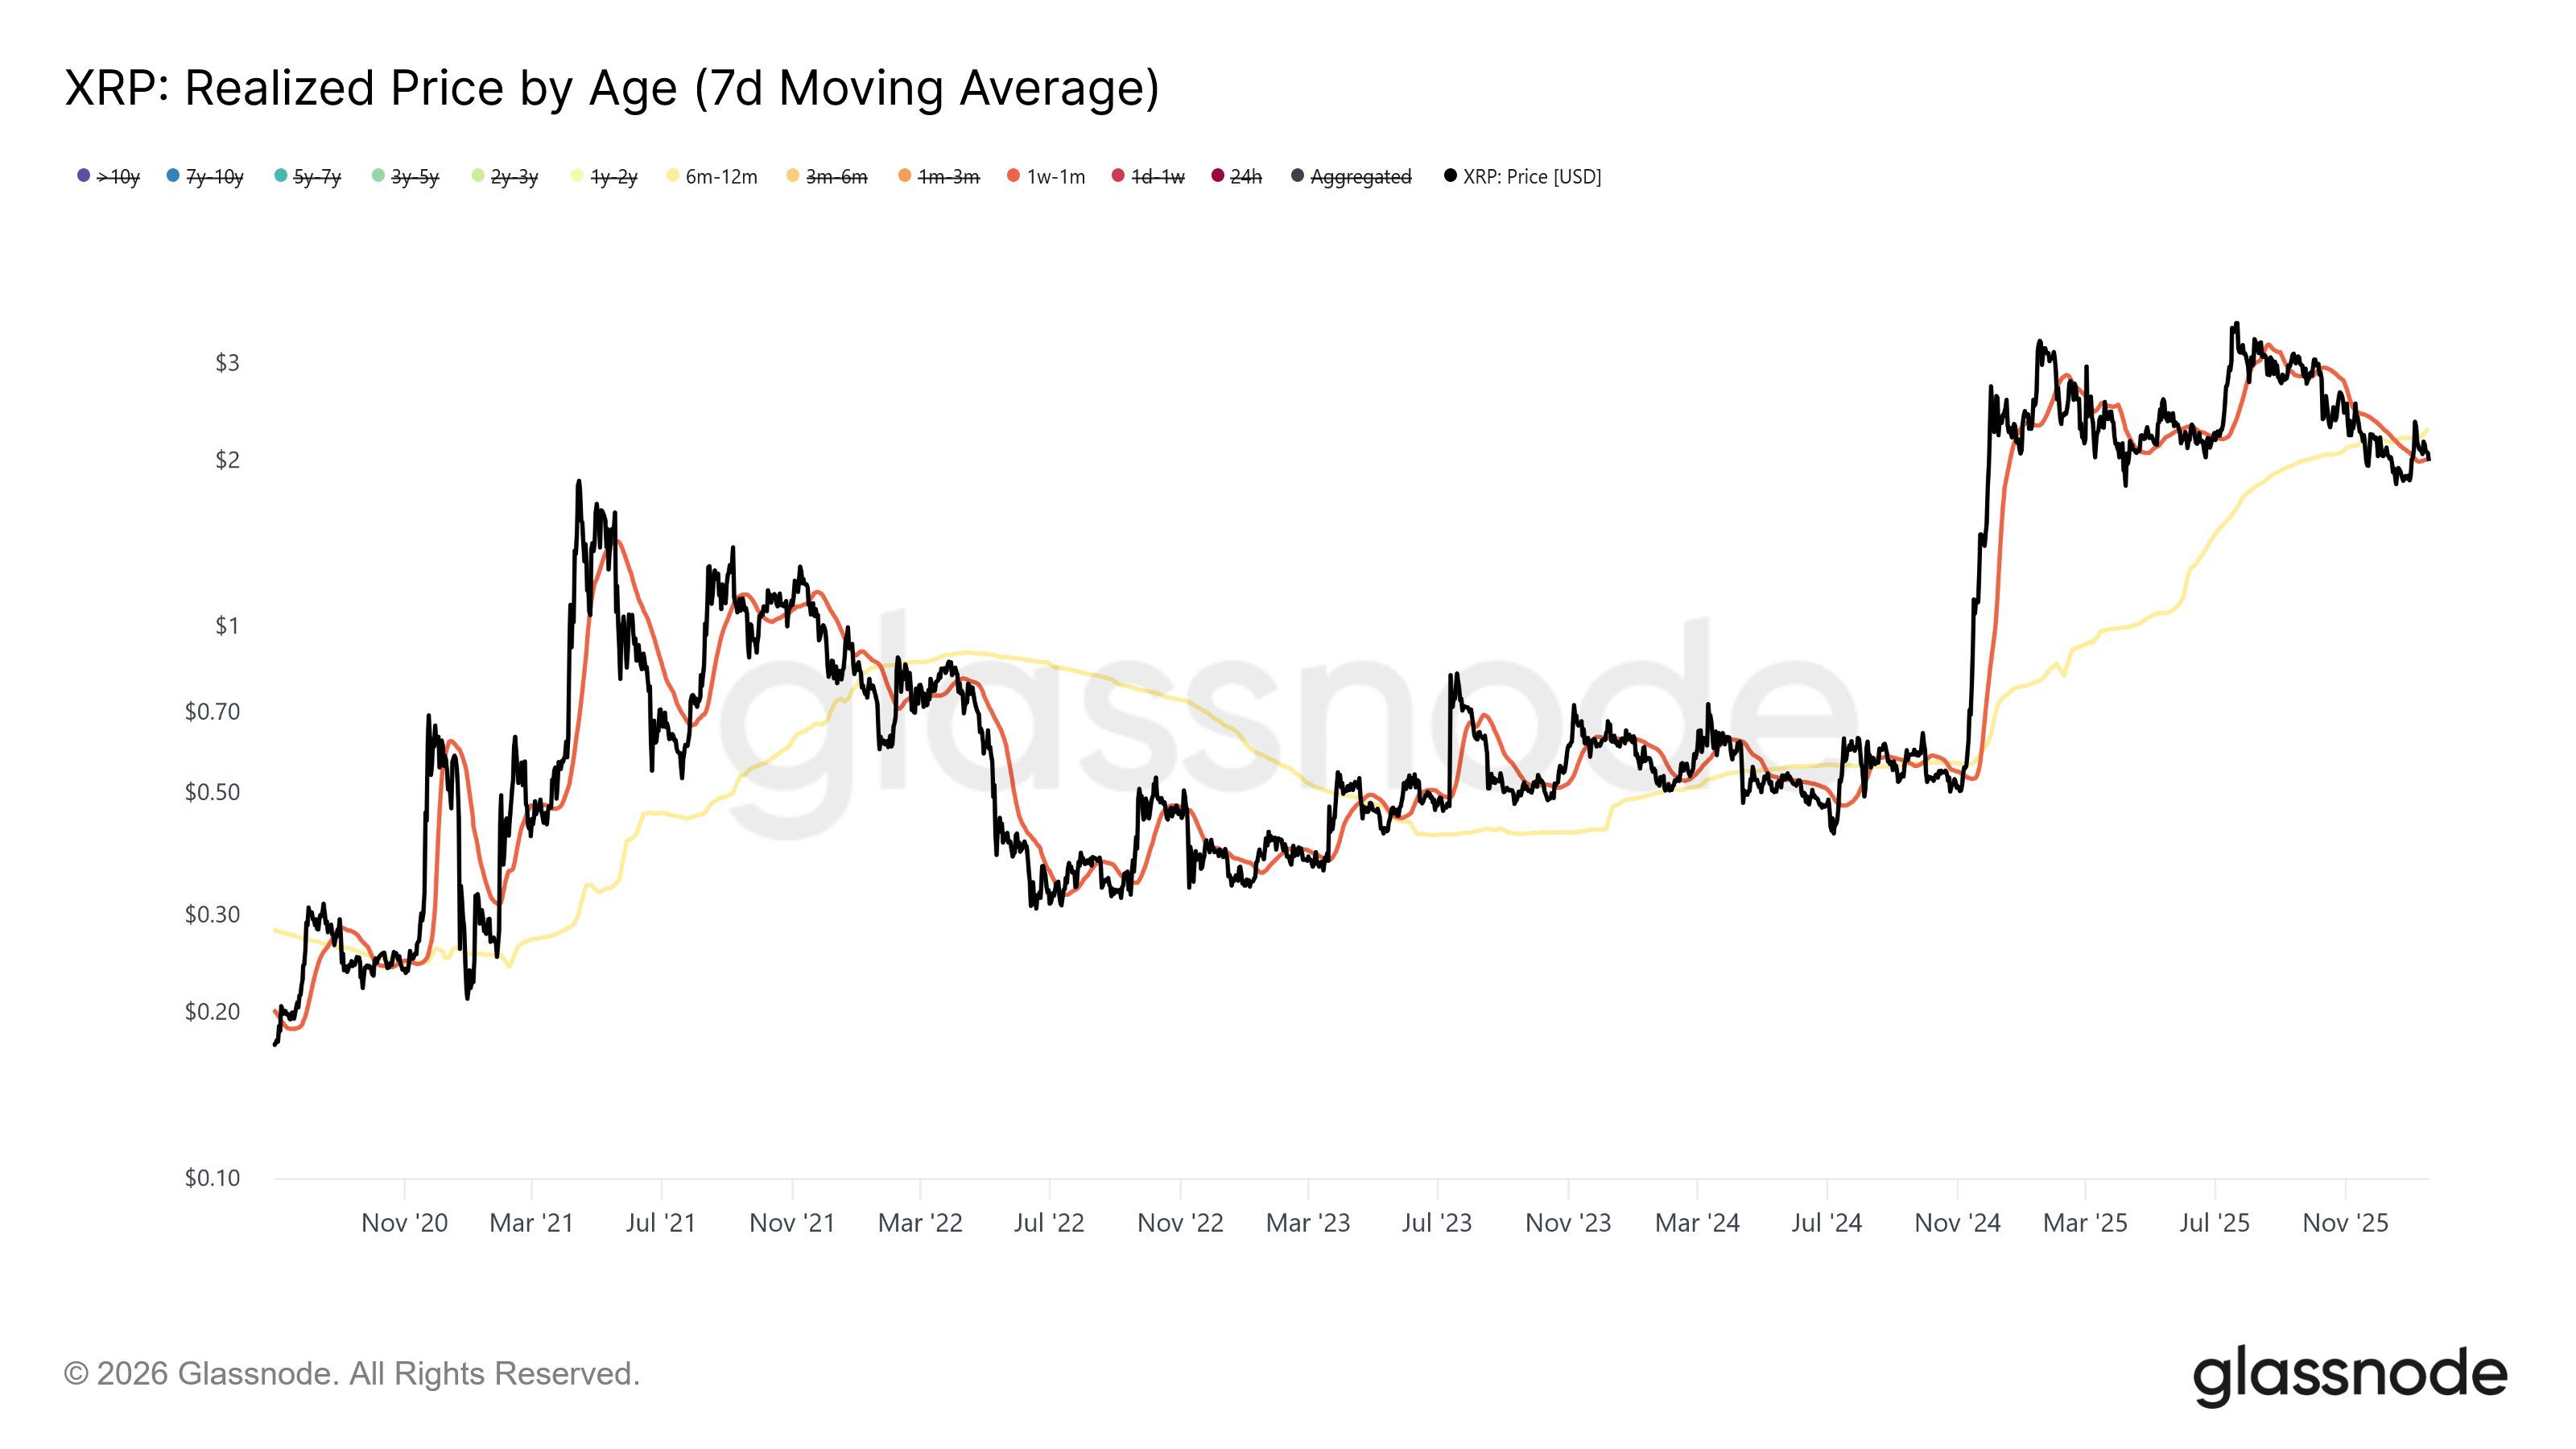
As this imbalance persists, psychological pressure continues to build on investors who bought near highs. Glassnode warns that these “top buyers” may face increasing stress over time. This pattern mirrors the structure observed in February 2022.
“That pattern didn’t end gently last time,” a market watcher added.
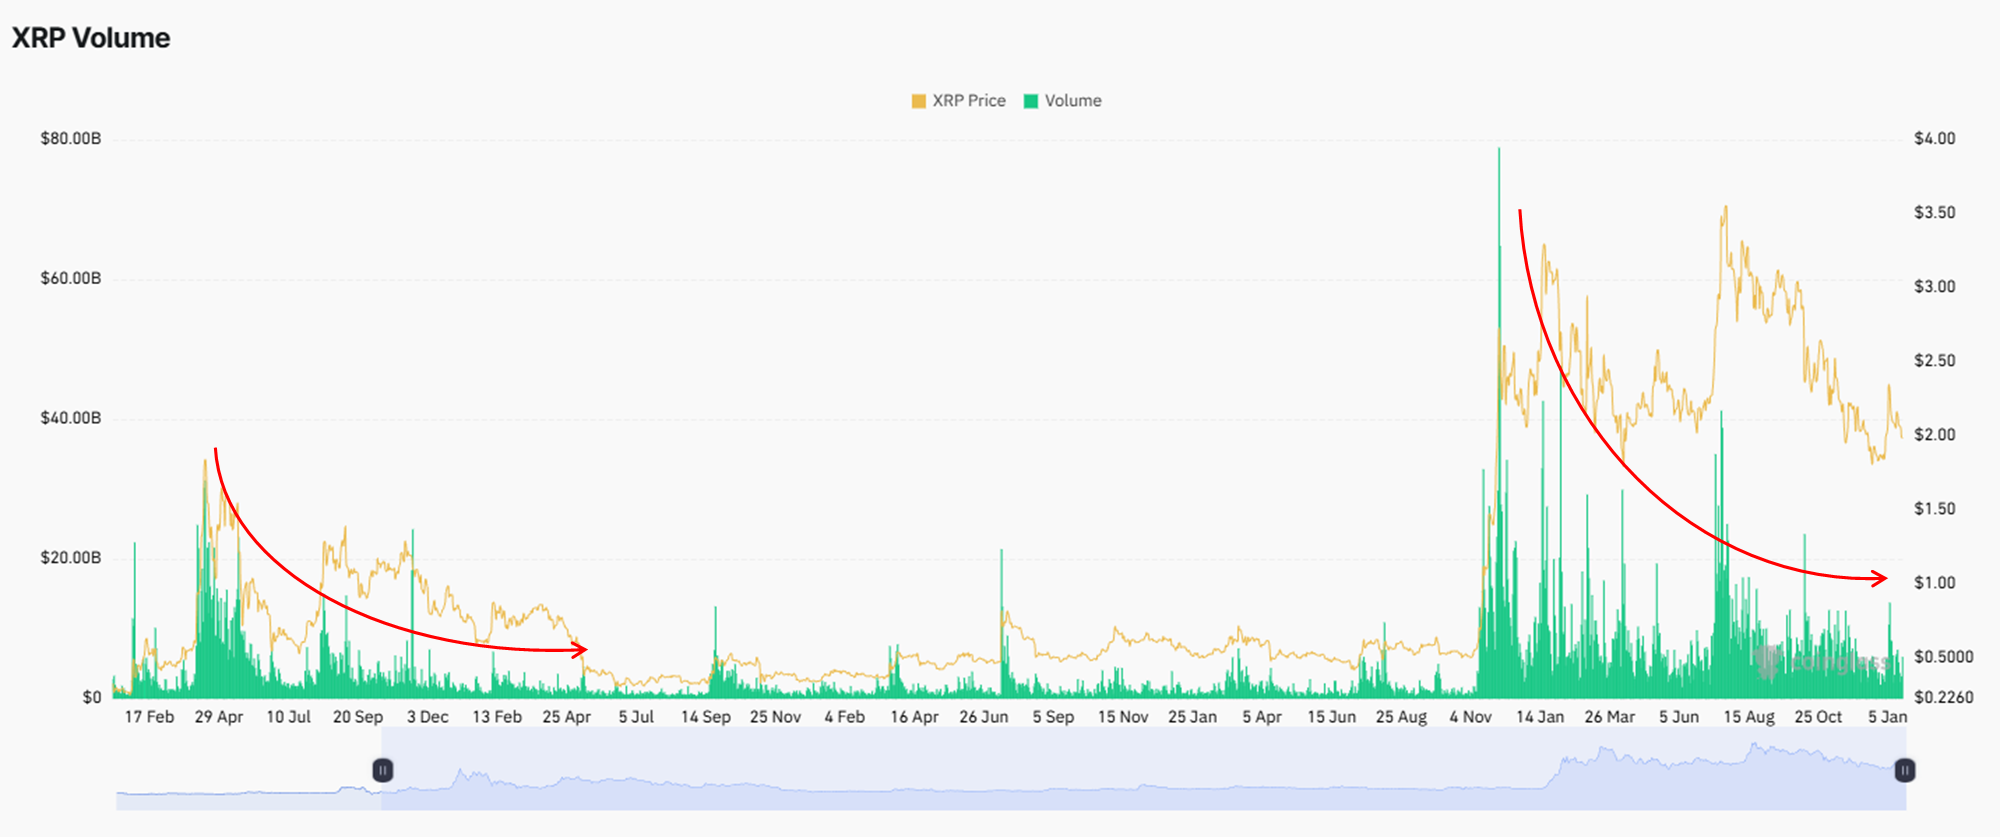
Secondly, the ongoing decline in volume alongside falling prices closely mirrors the market behavior observed during the 2021–2022 period.
This combination suggests that XRP’s recent price weakness has not attracted meaningful dip-buying interest. It indicates a lack of conviction among market participants. This same pattern preceded the February 2022 sell-off.
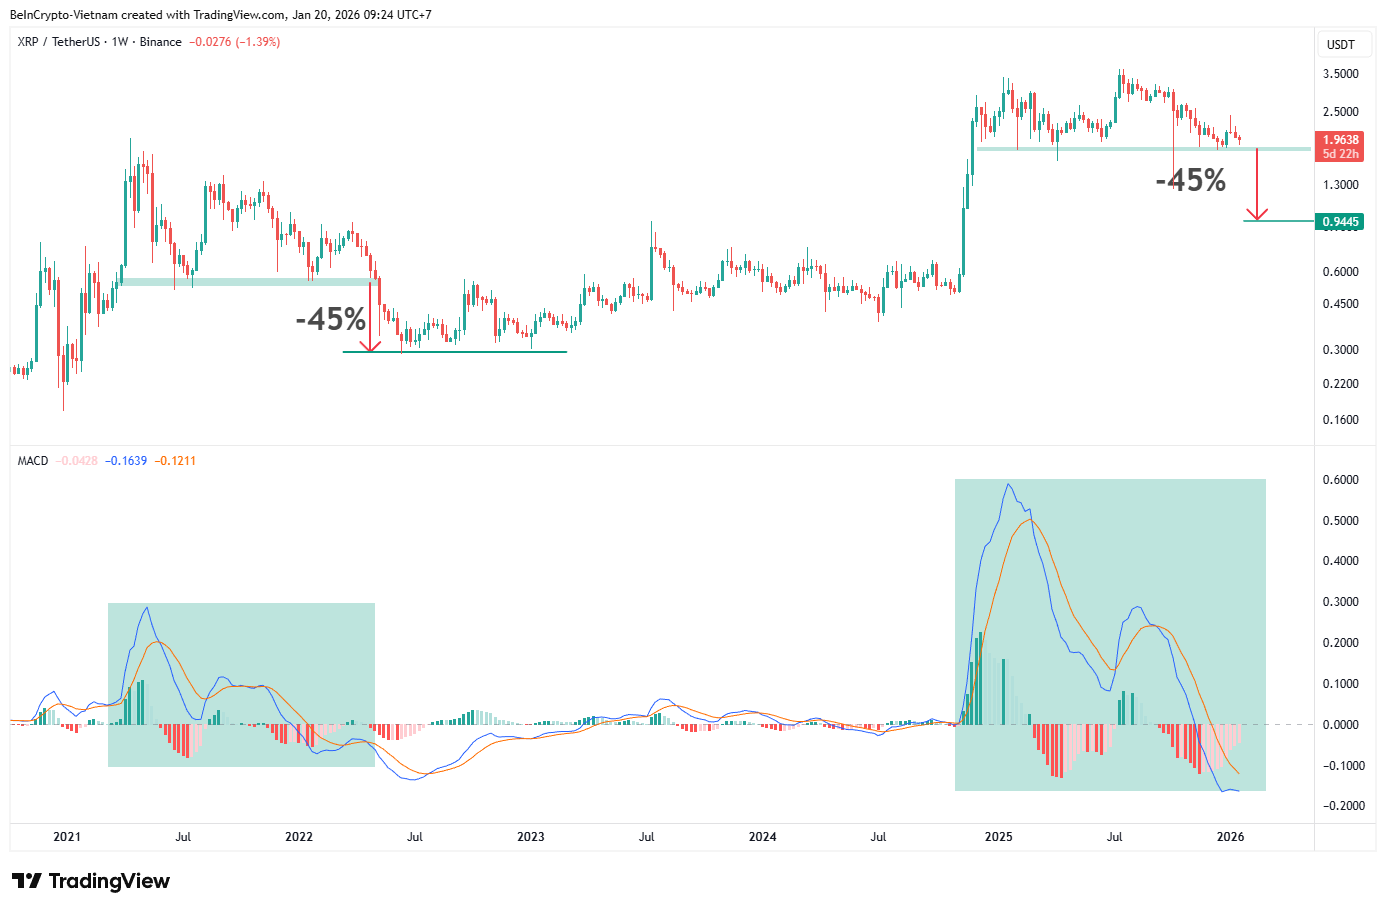
Lastly, technical signals highlight added risks. A comparison of the Moving average convergence/divergence (MACD) histogram structure between the 2025–2026 period and the 2021–2022 cycle reveals a closely matching momentum pattern.
Thus, the data suggests that XRP could fall by 45% if it breaks the $1.8-$ 1.9 support zone. Such a breakdown would push the price below $1, crossing a vital psychological and technical threshold for XRP.
Meanwhile, BeInCrypto’s analysis suggests that XRP is at a make-or-break moment. The price is forming a potential inverse head-and-shoulders pattern.
This turns bullish only if XRP reclaims the 100-day EMA above $2.24 and breaks the $2.48–$2.52 neckline zone. If confirmed, the setup implies a possible 33% upside.
Furthermore, some market participants believe a rally could be developing for XRP. An on-chain crypto analyst noted that XRP’s CME daily trend retest has been completed and the 4-hour CME gap has been filled.
According to the analyst, these conditions may set the stage for a decoupling move, potentially allowing XRP to stage a solid rally from current levels.
In the weeks ahead, traders will be watching closely to see whether the 2022 pattern plays out. For now, both technical and on-chain signals, alongside broader market conditions, point toward a cautious outlook as XRP navigates this critical phase.
The post XRP Mirrors 2022 Breakdown Patterns: Will History Repeat Below $1? appeared first on BeInCrypto.