As geopolitical tensions intensify and investor sentiment deteriorates, bearish pressure has continued spreading across Bitcoin’s spot and derivatives markets.
The uncertainty surrounding global macroeconomic stability has led many market participants to take a risk-off approach, with the coin showing signs of vulnerability as the second quarter draws to a close.
Bitcoin Futures Turn Bearish
With the coin struggling to rally momentum around the $103,000 price mark, Bitcoin futures traders have increasingly positioned against the coin.
According to Coinglass, the coin’s long/short ratio — a key measure of trader sentiment — has tilted heavily toward shorts since June 17, indicating a growing belief that BTC’s recent rally may be losing momentum. At press time, the ratio is 0.95, indicating more traders are betting against the altcoin.
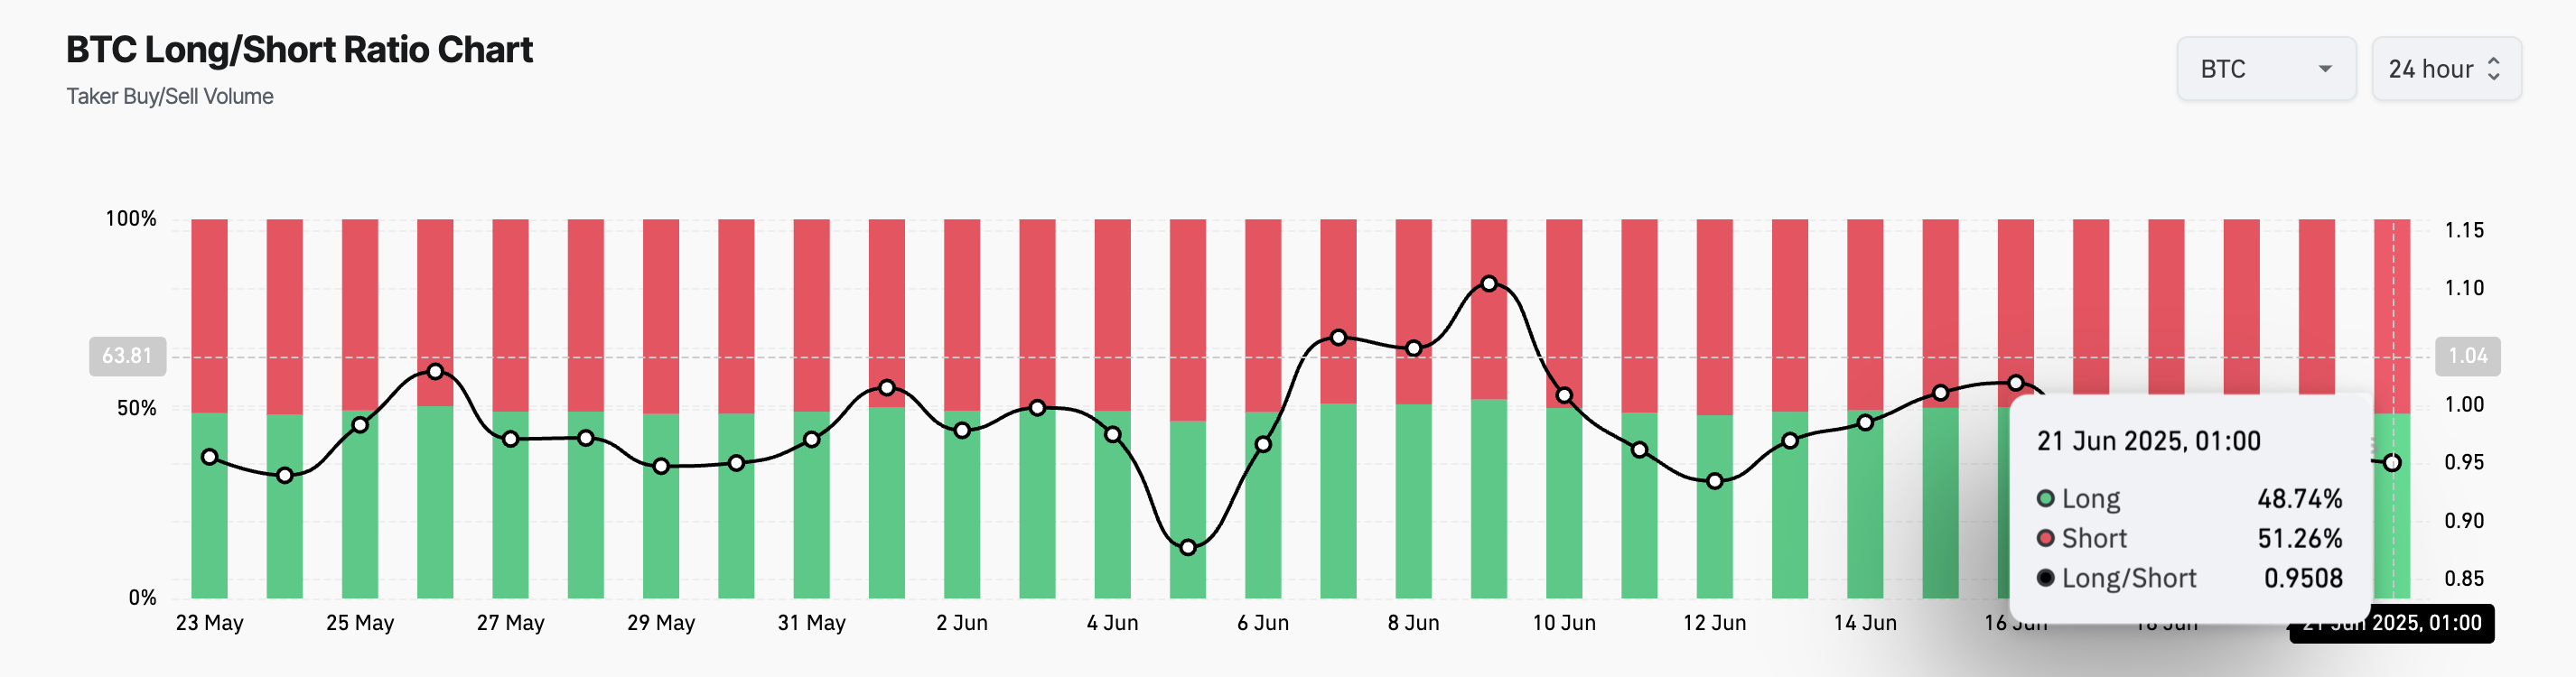
This ratio compares the number of long and short positions in a market. When an asset’s long/short ratio is above 1, there are more long than short positions, indicating that traders are predominantly betting on a price increase.
Conversely, as seen with BTC, a ratio below one indicates that most traders are positioning for a price drop. This reflects heightened bearish sentiment and growing expectations of continued downside movements in the short term.
Moreover, daily chart readings from BTC’s BBTrend indicator reinforce the bearish outlook. As BTC’s price momentum weakens, the green histogram bars on the indicator have steadily fallen in size, signaling a decline in buying pressure and a loss of bullish strength.
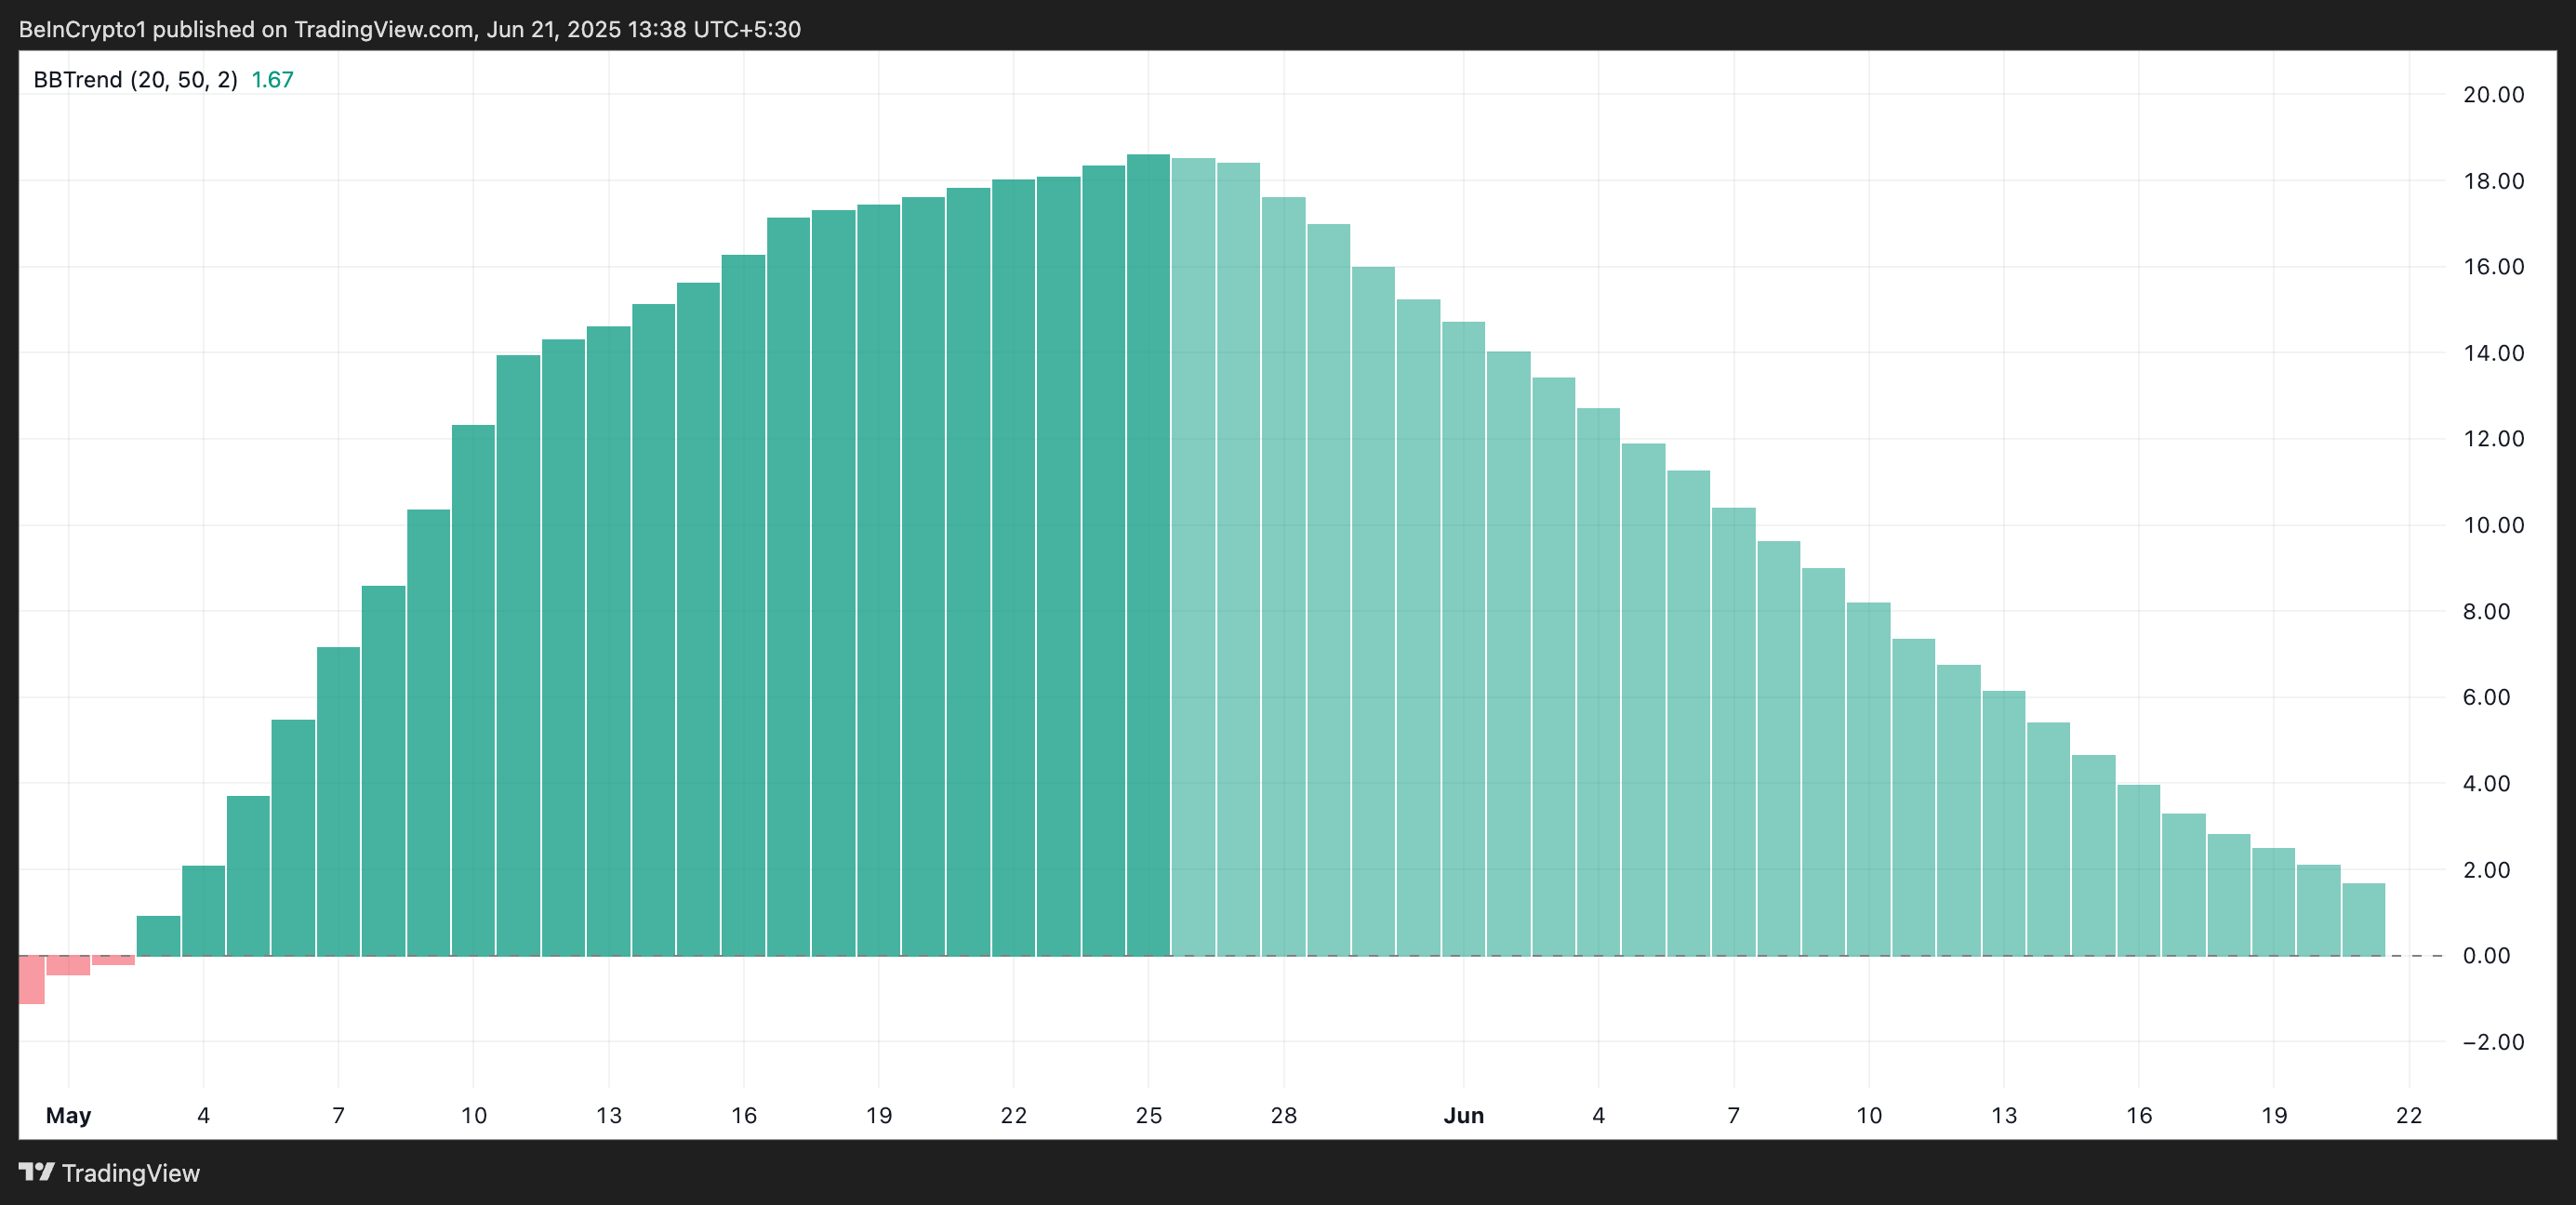
The BBTrend is used to gauge the strength and direction of price trends. It appears as histogram bars — green when the trend is bullish and red when bearish.
When the BBTrend turns negative or the green bars shrink, upward momentum is fading, and the asset may be entering a consolidation phase or facing a reversal.
A consistently negative BBTrend suggests that selling pressure is dominating, increasing the likelihood of an extended price correction for BTC.
BTC Slips to Two-Week Low: Will Support at $102,000 Hold?
Yesterday, BTC’s price fell to a 15-day low of $102,345. Although it rebounded and closed at $103,297, bearish pressure remains, with the coin still down 2% over the past 24 hours.
If new demand continues to be limited, BTC’s price could extend its dip toward $101,520. Should the bulls fail to defend this critical support level, the asset could plunge further to $97,658.

On the other hand, if buying pressure strengthens, BTC could rebound and attempt a break above $103,952. A successful move past this level may open the door for a rally toward $106,295.
The post Will Bitcoin (BTC) Break Below $100,000 as Q2 Nears its End? appeared first on BeInCrypto.