
Leading digital asset Bitcoin (BTC) hit a record high of $126,199 on Monday, marking a major milestone. However, since reaching this peak, the coin has largely traded sideways, showing signs of hesitation among traders.
With many market participants anticipating a potential move below the $120,000 region, on-chain indicators suggest that a short-term downward trend could be looming.
Bitcoin Momentum Weakens as Holders Exit
Subtle signs of weakening momentum accompany BTC’s recent sideways trend. According to Glassnode, the coin’s Holder Accumulation Ratio has trended downward since Monday and continues to decline.
At press time, the ratio is at 54.42%, falling by 2% in the past four days.
For token TA and market updates: Want more token insights like this? Sign up for Editor Harsh Notariya’s Daily Crypto Newsletter here.
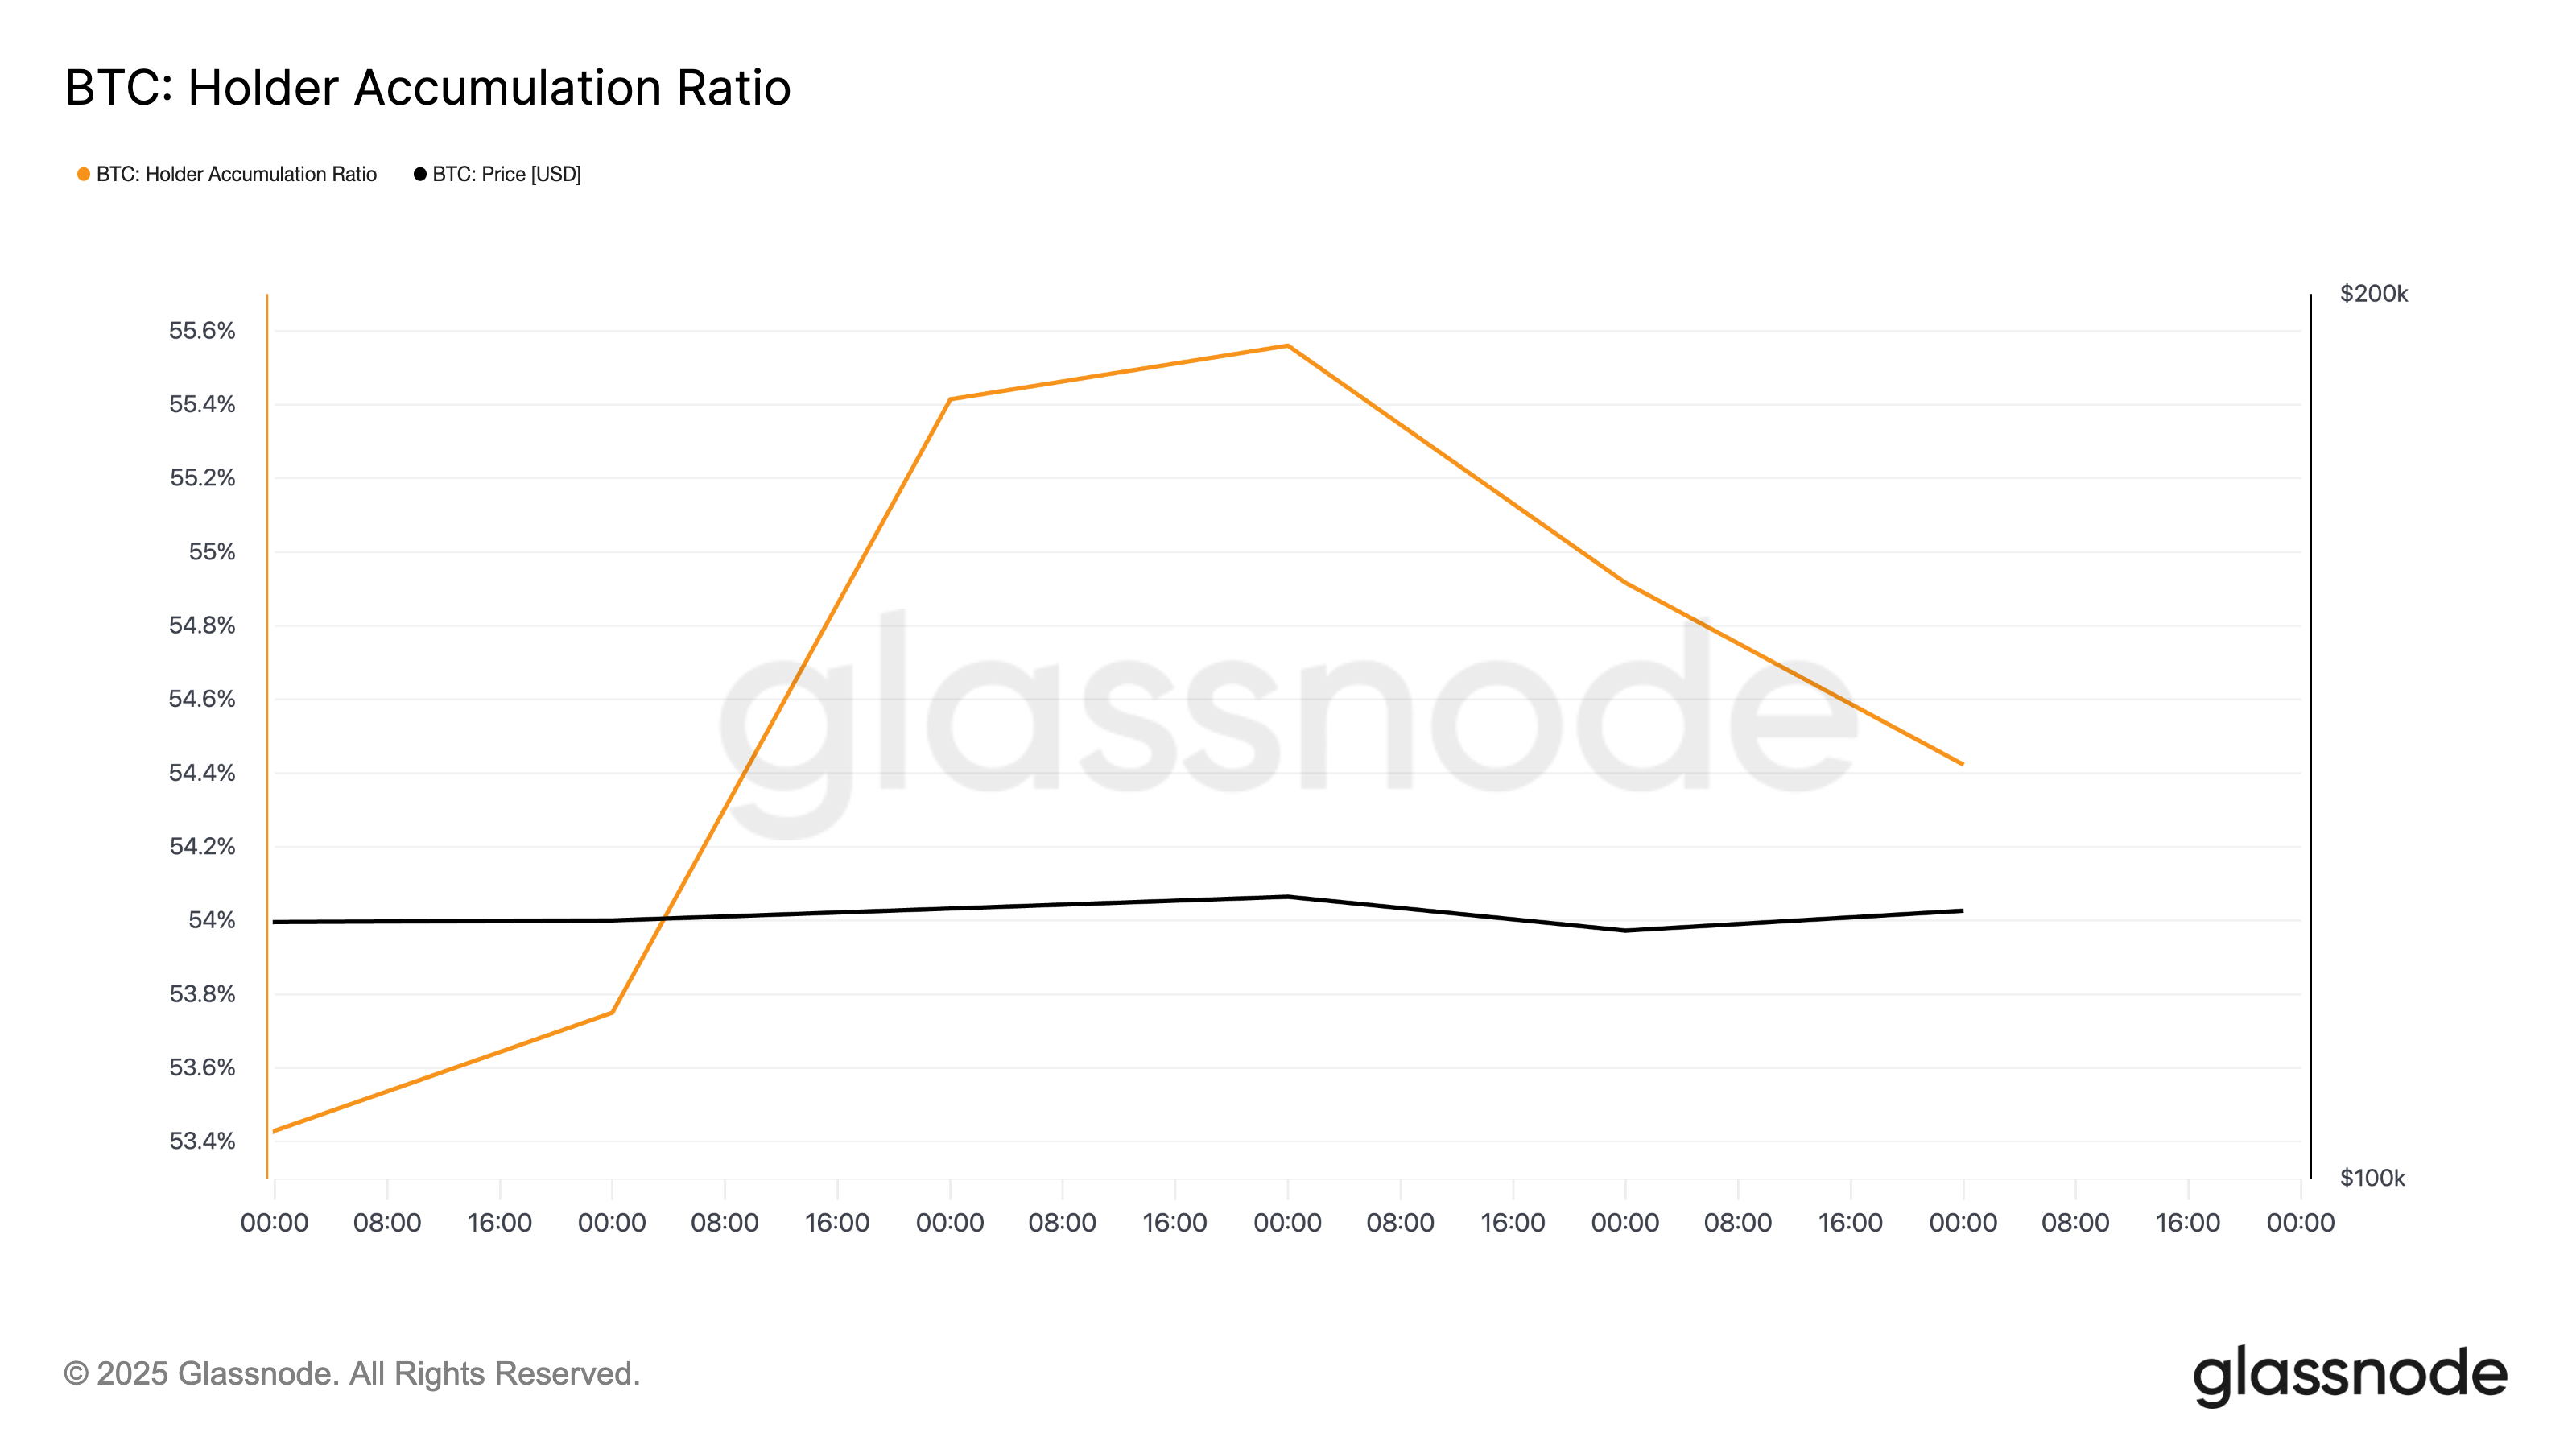
The Holder Accumulation Ratio measures the proportion of active holders increasing their positions versus those decreasing them.
A higher ratio indicates that more BTC is being retained, signaling strong confidence and accumulation among investors.
Conversely, when it falls, as seen over the past few days, it suggests that more holders are selling or moving their coins rather than accumulating them.
At the same time, BTC’s Liveliness has resumed its uptrend since Monday. The metric closed October 8 at 0.6298.
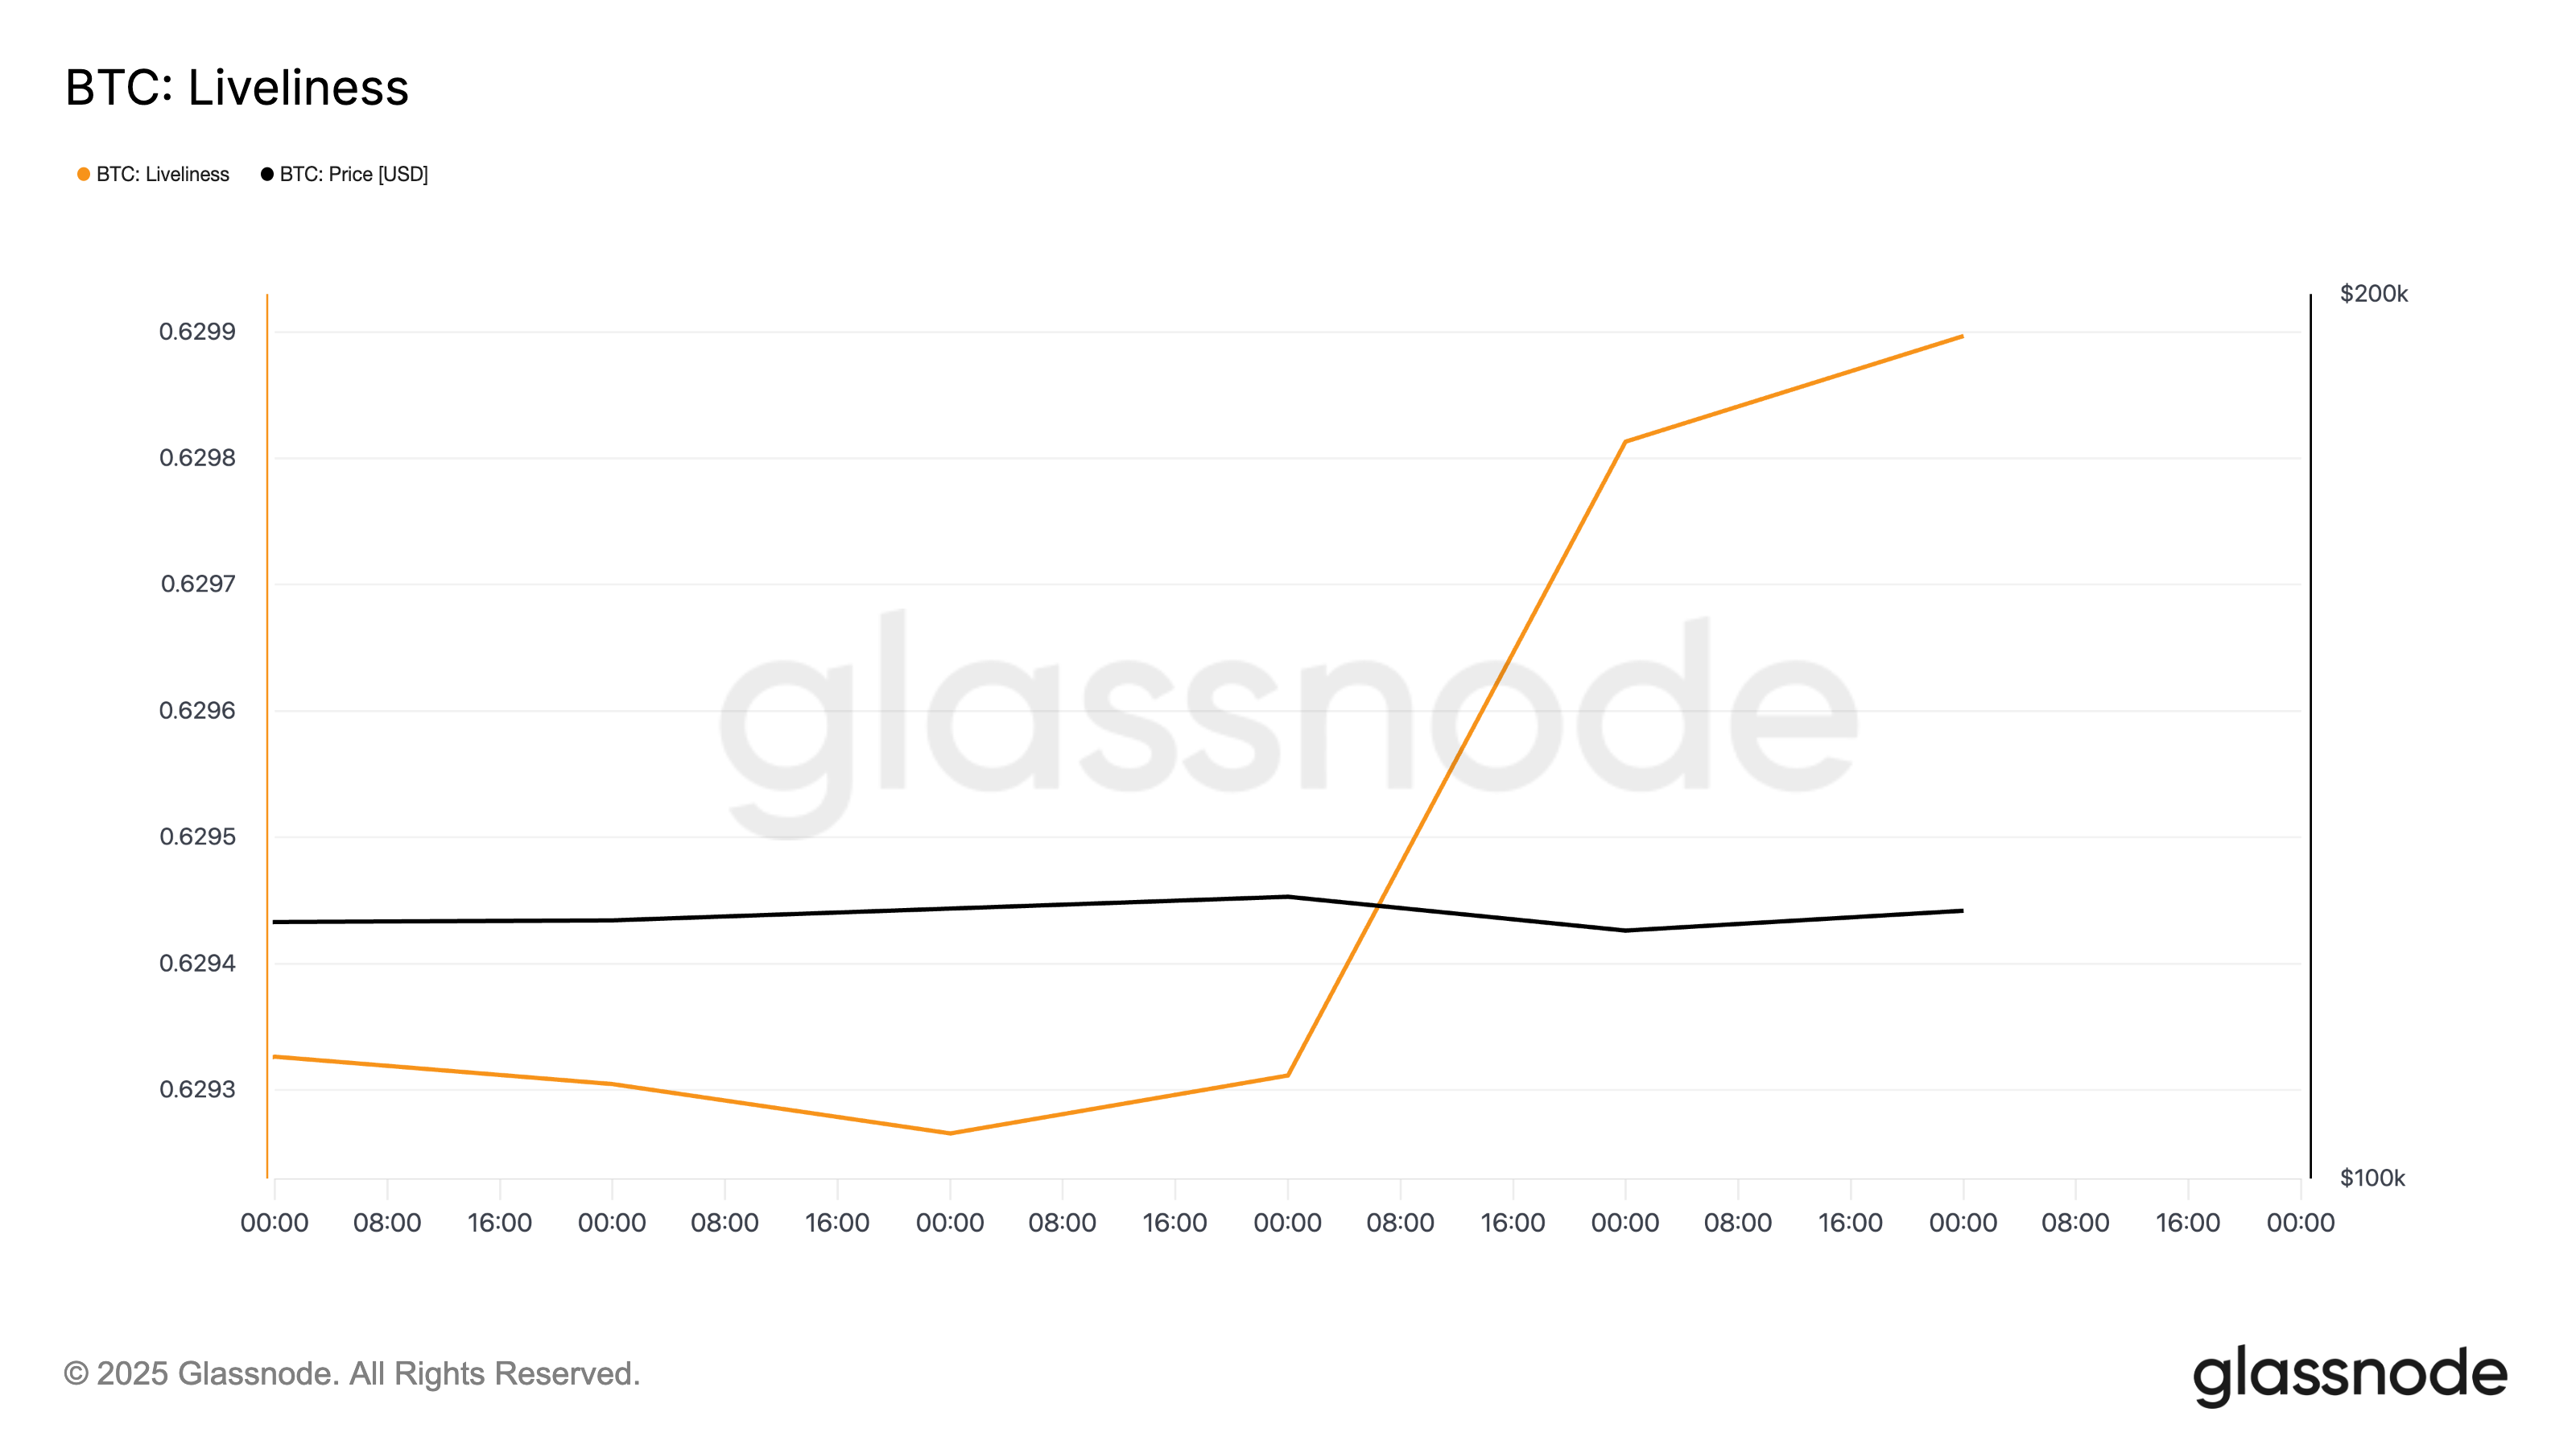
Liveliness tracks the movement of long-held/dormant tokens. It does this by measuring the ratio of an asset’s coin days destroyed to the total coin days accumulated.
When the metric falls, LTHs are moving their assets off exchanges, a move seen as a bullish signal of accumulation.
Conversely, when it climbs like this, it means that LTHs are moving their coins and selling them. This signals caution and a buildup of a profit-taking trend that could lower BTC’s price.
Can Buyers Step In Before a Deeper Drop?
Without renewed buying interest, BTC risks slipping toward the $120,000 zone. A breach of the support floor at $120,090 could trigger a further decline to $118,922.
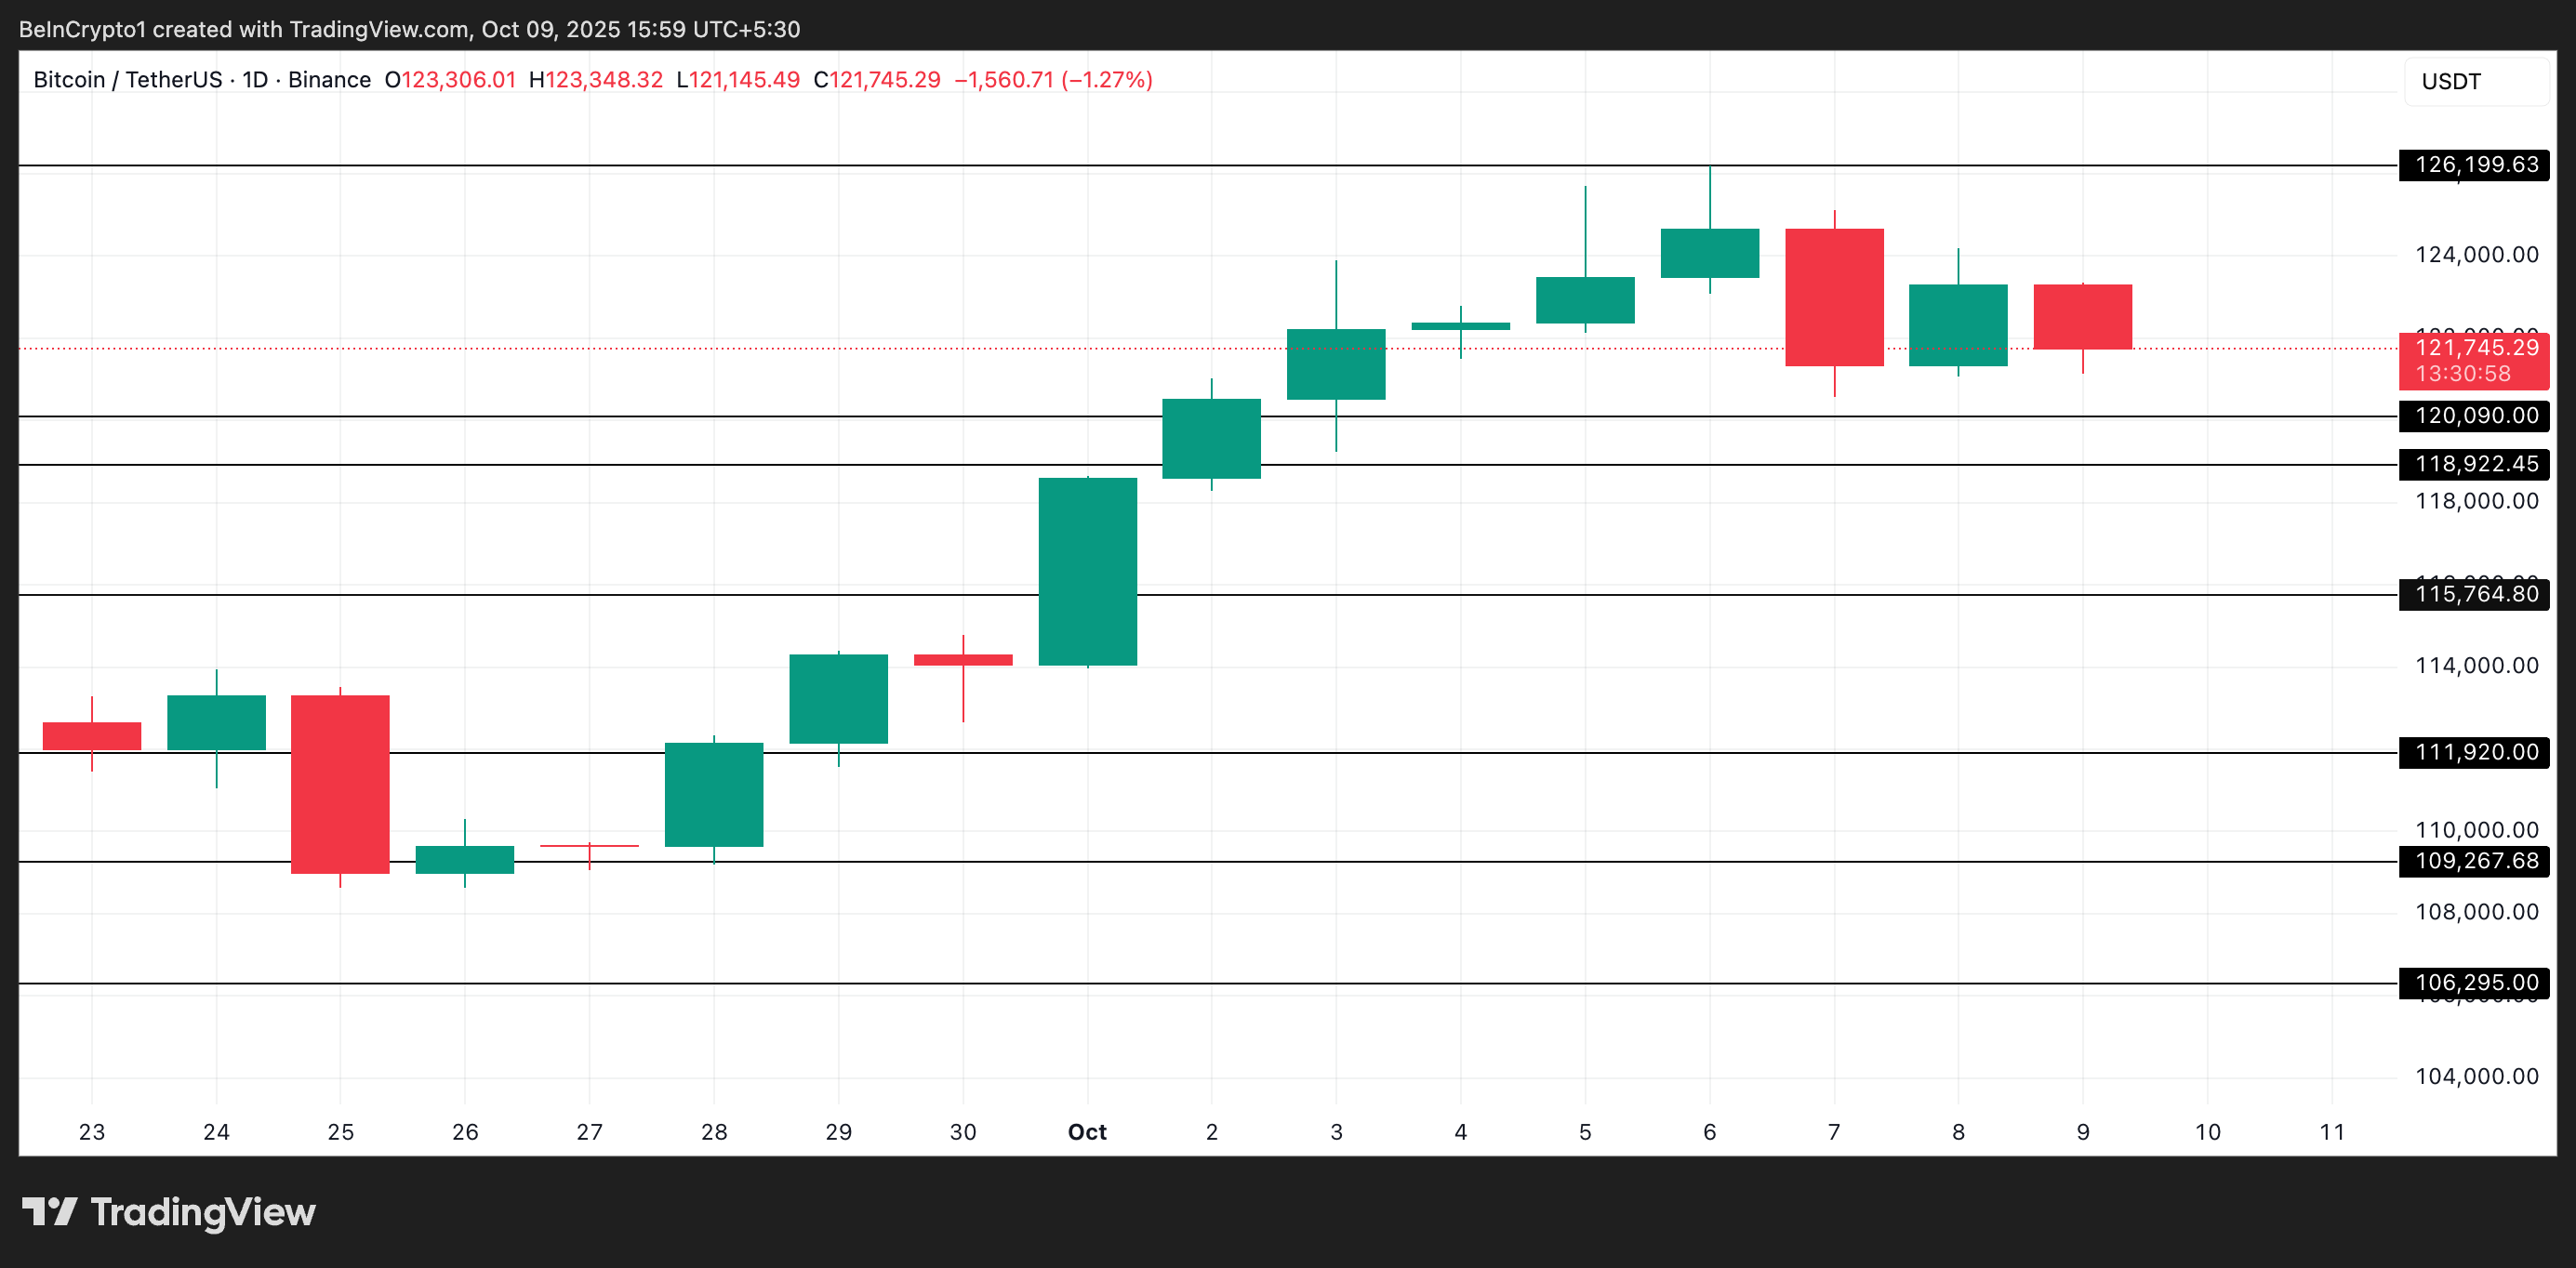
However, if new buyers enter the market and demand picks up, the cryptocurrency could stabilize above current levels and potentially revisit its all-time high of $126,199.
The post Why Bitcoin’s Record High May Be Followed by a Decline Below $120,000 appeared first on BeInCrypto.