
Stellar (XLM) price showed early signs of a comeback this month, but over the past 24 hours, the price has dropped by more than 4%. After a solid 53% gain for July, XLM is starting to look shaky, and one key technical signal just flashed a warning that another dip may be on the cards.
By looking at shorter timeframes, investor positioning, and price levels, we can get an early read on whether this weekly downtrend has more room to run.
2-Hour Chart Flashes a Bearish Signal; And Netflows Confirm It
To understand if this weakness is just a quick dip or the start of a larger correction, it’s worth examining short-term timeframes. On the 2-hour chart, the 20-period Exponential Moving Average (EMA) or the red line has crossed under the 50-period EMA (orange line), a setup often called a “death crossover.” This usually signals growing momentum from short-term sellers.
For token TA and market updates: Want more token insights like this? Sign up for Editor Harsh Notariya’s Daily Crypto Newsletter here.
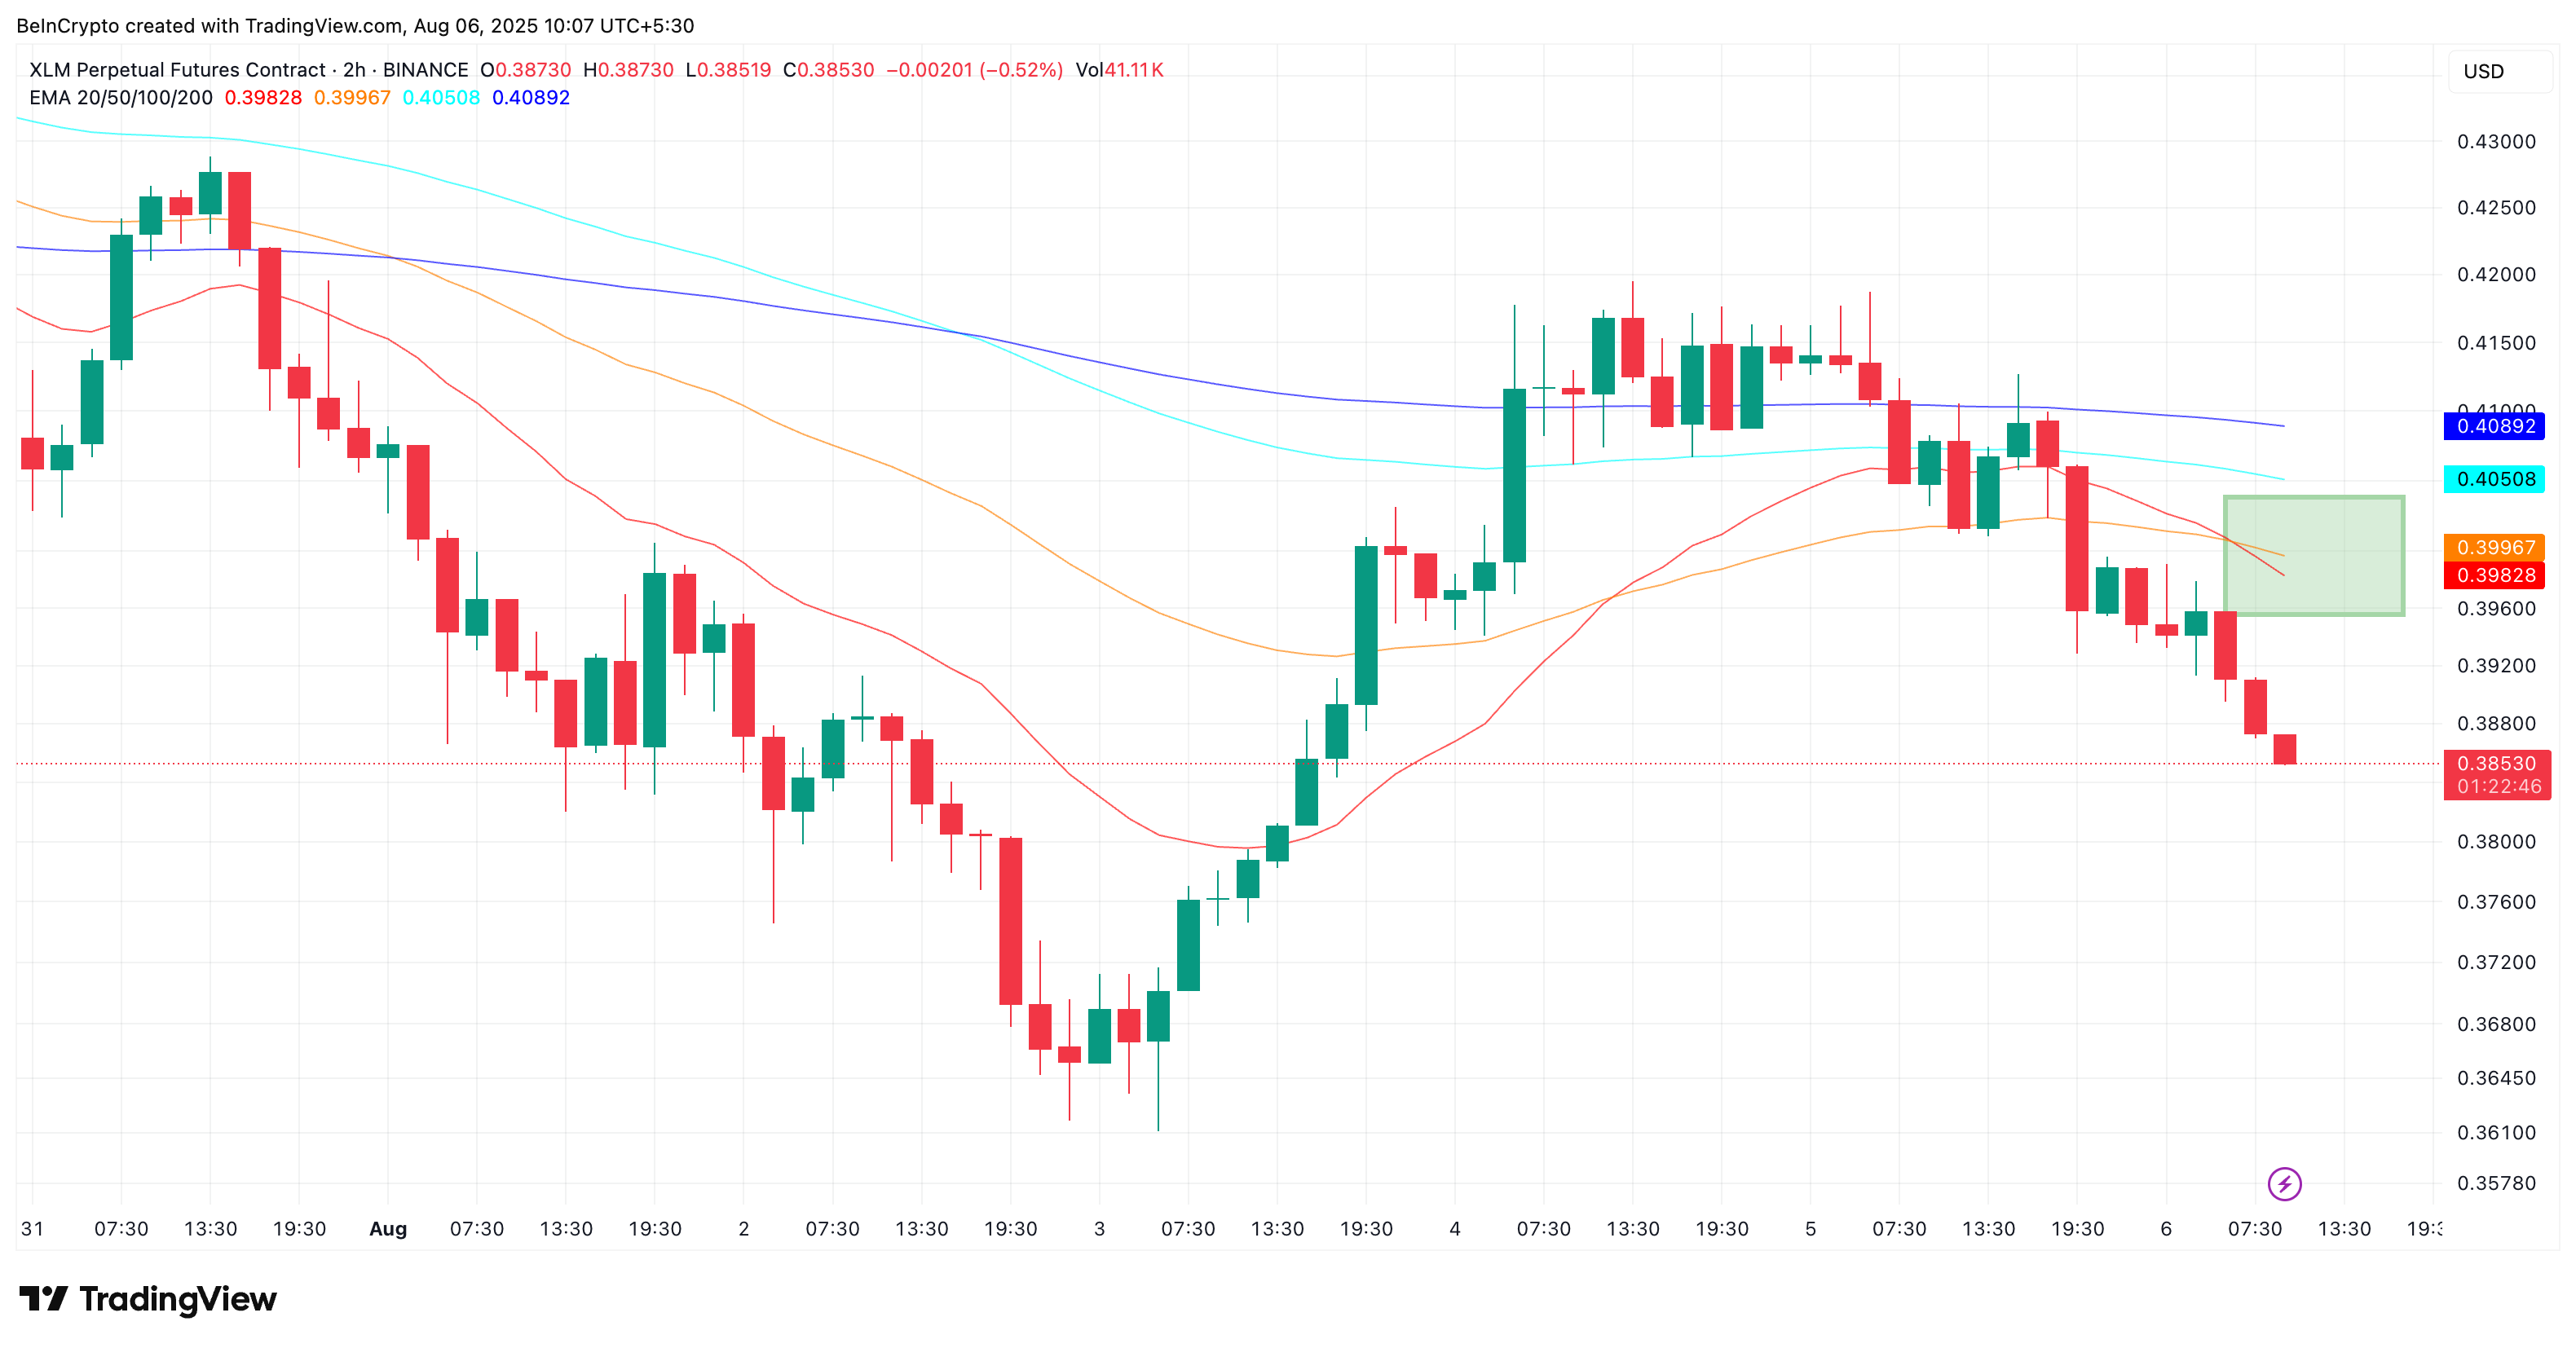
An EMA crossover happens when one moving average line crosses another on a chart. A short-term EMA (like a 20-period) crossing below a longer-term EMA (like a 50-period) means short-term selling may be picking up.
Backing this up is the shift in net exchange flows. For the past two weeks, netflows were slightly negative, meaning more tokens were leaving exchanges than entering. But this week, the flows finally flipped positive (even though it’s just a small speck of green). That’s a red flag because it often means holders are preparing to sell.

Bearish Momentum Is Building, And The Market Bias Backs It
Even beyond the chart signals, market sentiment shows that bearish momentum is creeping back in. The Bull-Bear Power (BBP) index, which compares recent highs and lows to spot buying power, flipped sharply back toward the bears over the last two sessions. That suggests buyers are struggling to keep up, and sellers are pushing the Stellar price lower.
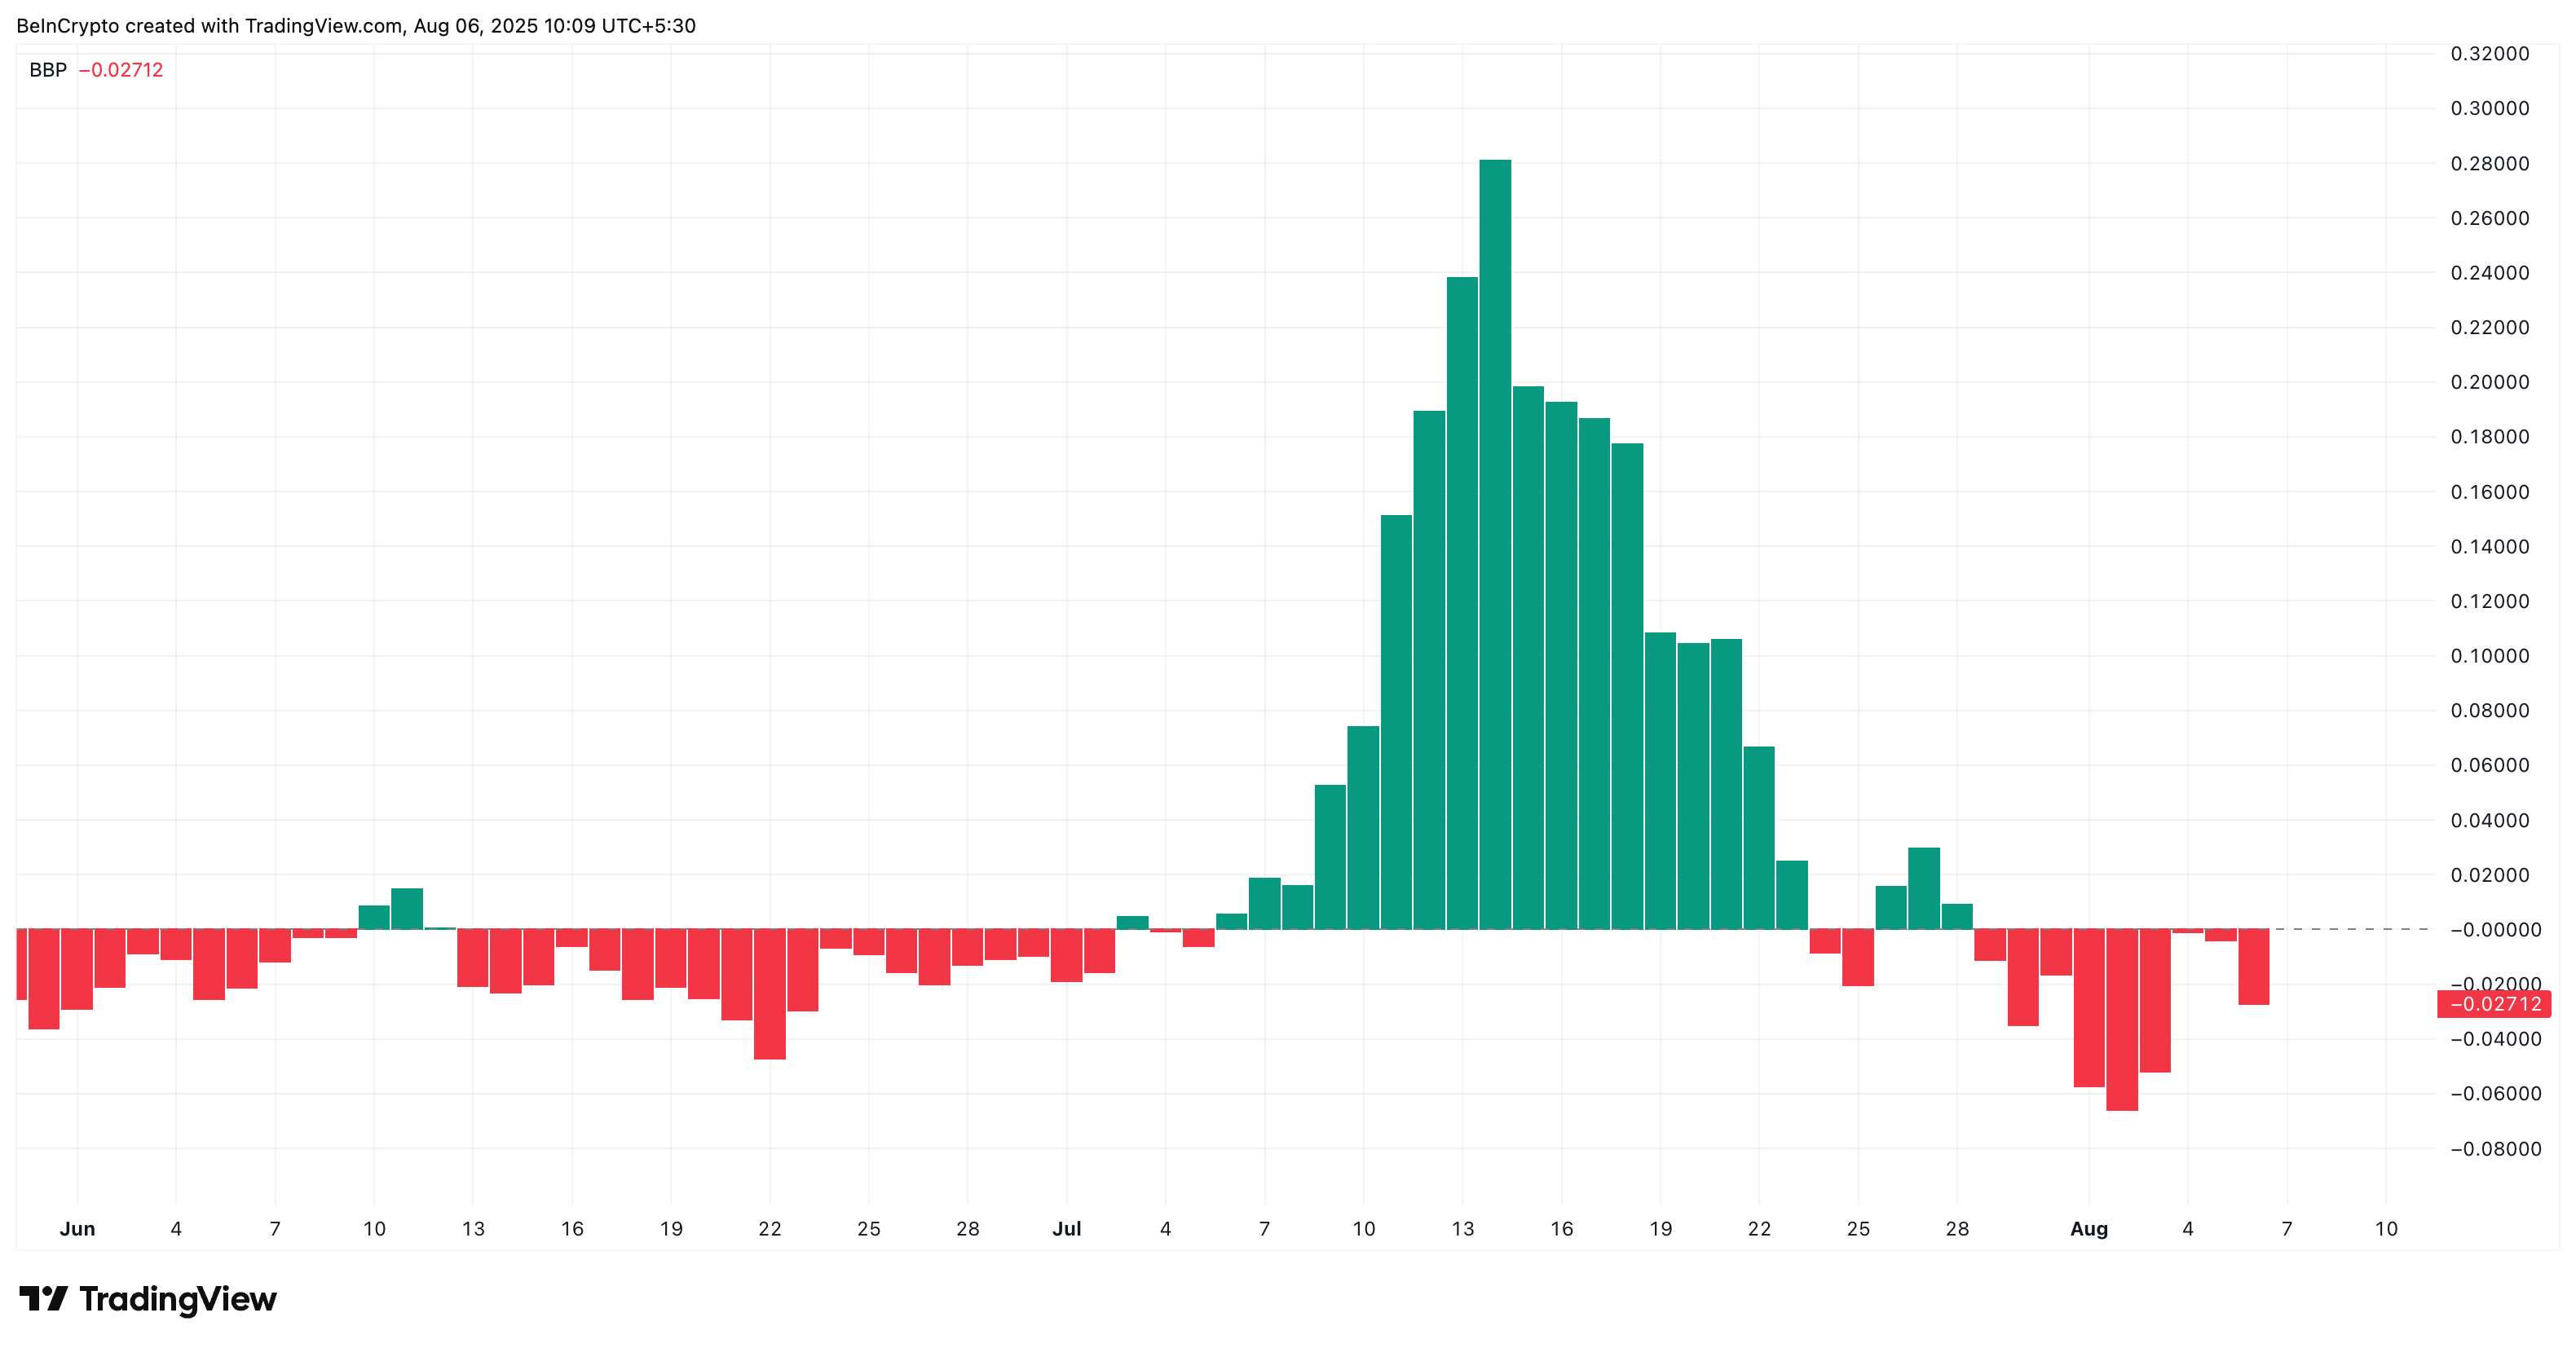
BBP measures the strength of buyers (bulls) vs sellers (bears) in recent price movements. When it’s negative, it shows bears are in control.
The shift is also clear in the long/short account ratio. According to Coinglass, 60.67% of traders are currently holding short positions on XLM, a sign that most expect the Stellar (XLM) price to fall further. While a heavily shorted market can sometimes lead to a short squeeze, in this case, it aligns with the negative Stellar price action and trend indicators.

The Long-Short ratio shows how many traders are betting on the price going up (long) versus down (short). A high short ratio means the majority expect an XLM price drop.
Support Levels to Watch as Stellar (XLM) Price Teeters on a Breakdown
The XLM price is currently trading around $0.38, right above a short-term support zone at $0.37. A break below $0.37 followed by $0.33 would likely lead to a deeper sell-off. If $0.33 level doesn’t hold, the Stellar price could revisit $0.28. A dip below that would confirm a full breakdown in momentum.
If bulls can hold $0.37 and push back the XLM price above $0.40 and $0.45, there’s still hope for a recovery. A move beyond $0.40 would invalidate the short-term bearish hypothesis.
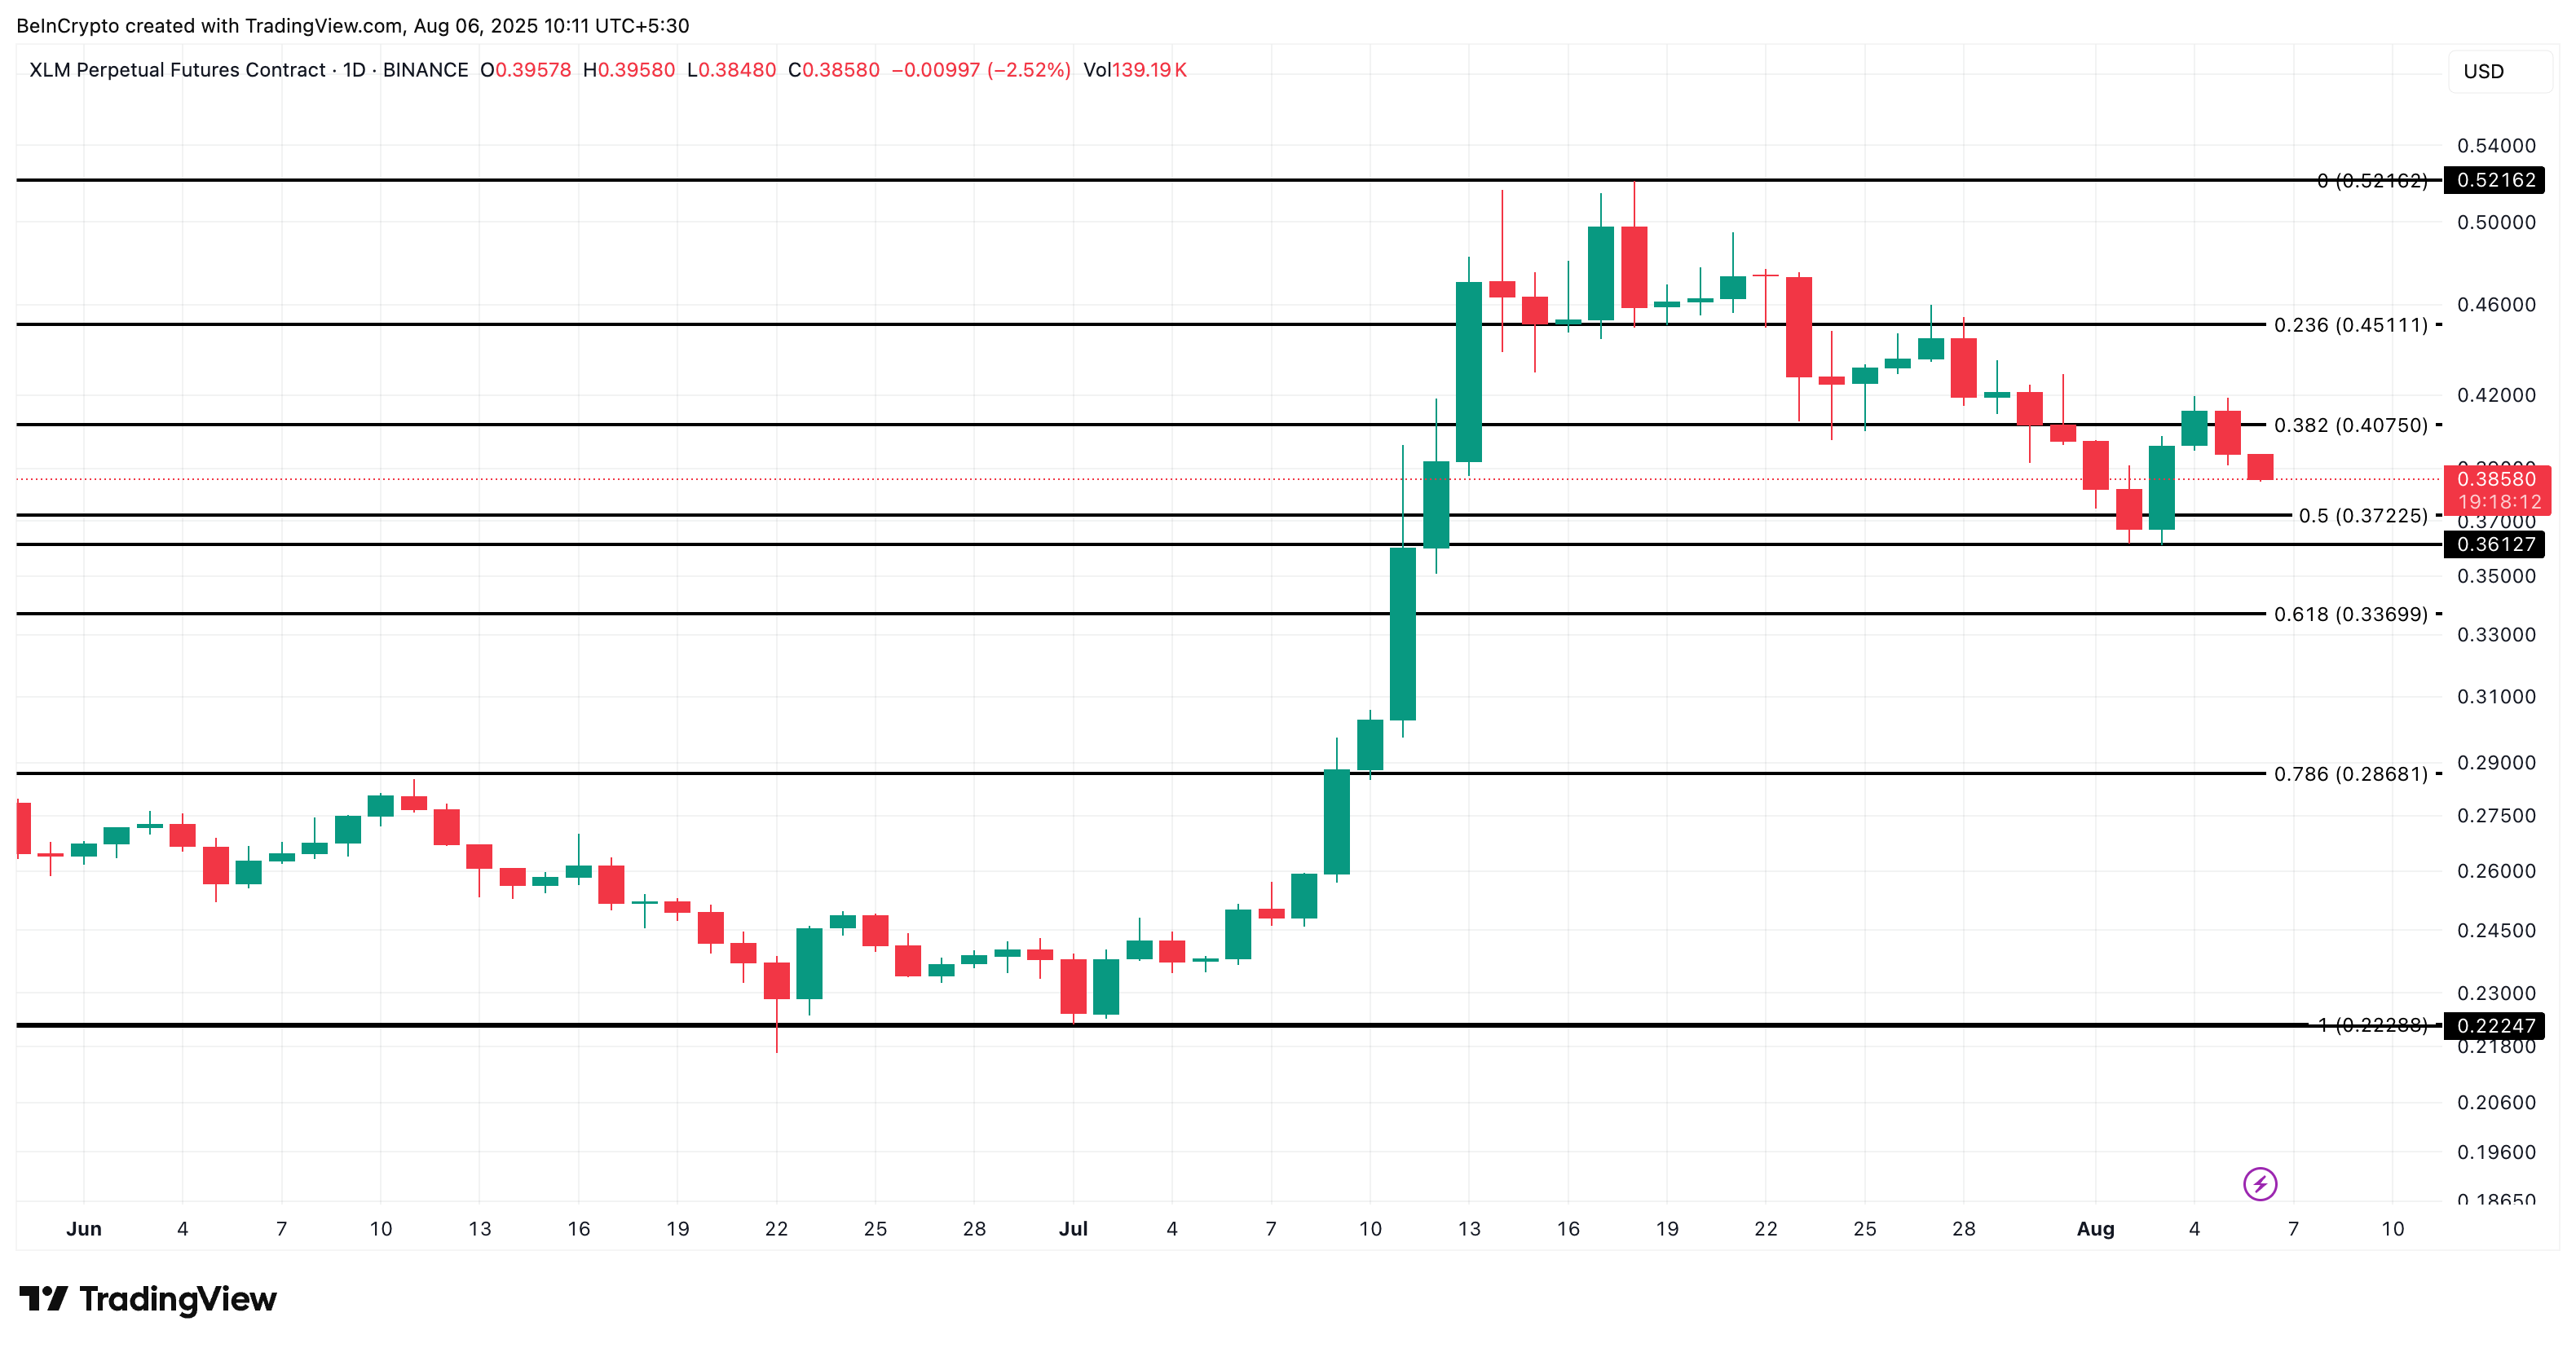
The real test comes at $0.52. Only a clean break above this resistance would fully confirm a new bullish trend. Until then, the Stellar (XLM) structure remains fragile.
The post Stellar (XLM) Chart Flashes a Warning, Will the Price Break Lower? appeared first on BeInCrypto.