Pi Network (PI) is down 14% over the past 30 days, with its market cap falling below $5 billion and the token trading under $1 since May 14.
Technical indicators continue to show bearish momentum, with PI struggling to break through key resistance levels. The Ichimoku Cloud, BBTrend, and EMA lines all point to ongoing weakness and a lack of bullish confirmation. Unless momentum shifts soon, PI may face further downside before any meaningful recovery can take shape.
Pi Network Faces Heavy Resistance
The Ichimoku Cloud shows that Pi Network (PI) remains under strong bearish pressure. The price continues to trade below the red cloud, indicating that downward momentum still dominates.
The Leading Span A (green line) remains below the Leading Span B (red line), reinforcing the cloud’s bearish structure ahead.
The cloud is wide and declining, suggesting that any potential reversal may face significant resistance soon.

The Tenkan-sen (blue line) is flat and hovering close to the Kijun-sen (red line), showing weak short-term momentum and indecision in the market.
Additionally, the price candles are compressed within a narrow range, indicating consolidation with no clear breakout.
The trend remains negative until the price decisively moves above the cloud and the lines flip bullish.
PI BBTrend Stabilizes, But Bearish Conditions Persist
Pi Network continues to show weak momentum, with its BBTrend indicator at -2.21, roughly unchanged over the past two and a half days.
The indicator has remained in negative territory for the last 14 days, with a sharp bearish peak of -18.7 recorded one week ago.
While the recent stabilization suggests the downtrend may be losing strength, PI has yet to show signs of a meaningful bullish reversal.

The BBTrend (Bollinger Band Trend) measures the strength and direction of price movements relative to Bollinger Bands.
Positive values suggest bullish momentum as the price pushes the upper band, while negative values indicate bearish conditions with prices staying near the lower band.
PI’s current BBTrend at -2.21 reflects a mildly bearish stance—less extreme than earlier, but still lacking upward pressure. The indicator must cross into positive territory and hold for sentiment to shift.
PI Breakout Could Trigger 37% Rally
PI price remains in a bearish technical setup, with its EMA lines showing short-term averages below the long-term ones.
This alignment confirms the continuation of a downtrend unless momentum shifts meaningfully.
If bearish pressure builds, PI could retest key support levels, and a breakdown would mark the first time the asset falls below a major historical threshold—intensifying downside risk.
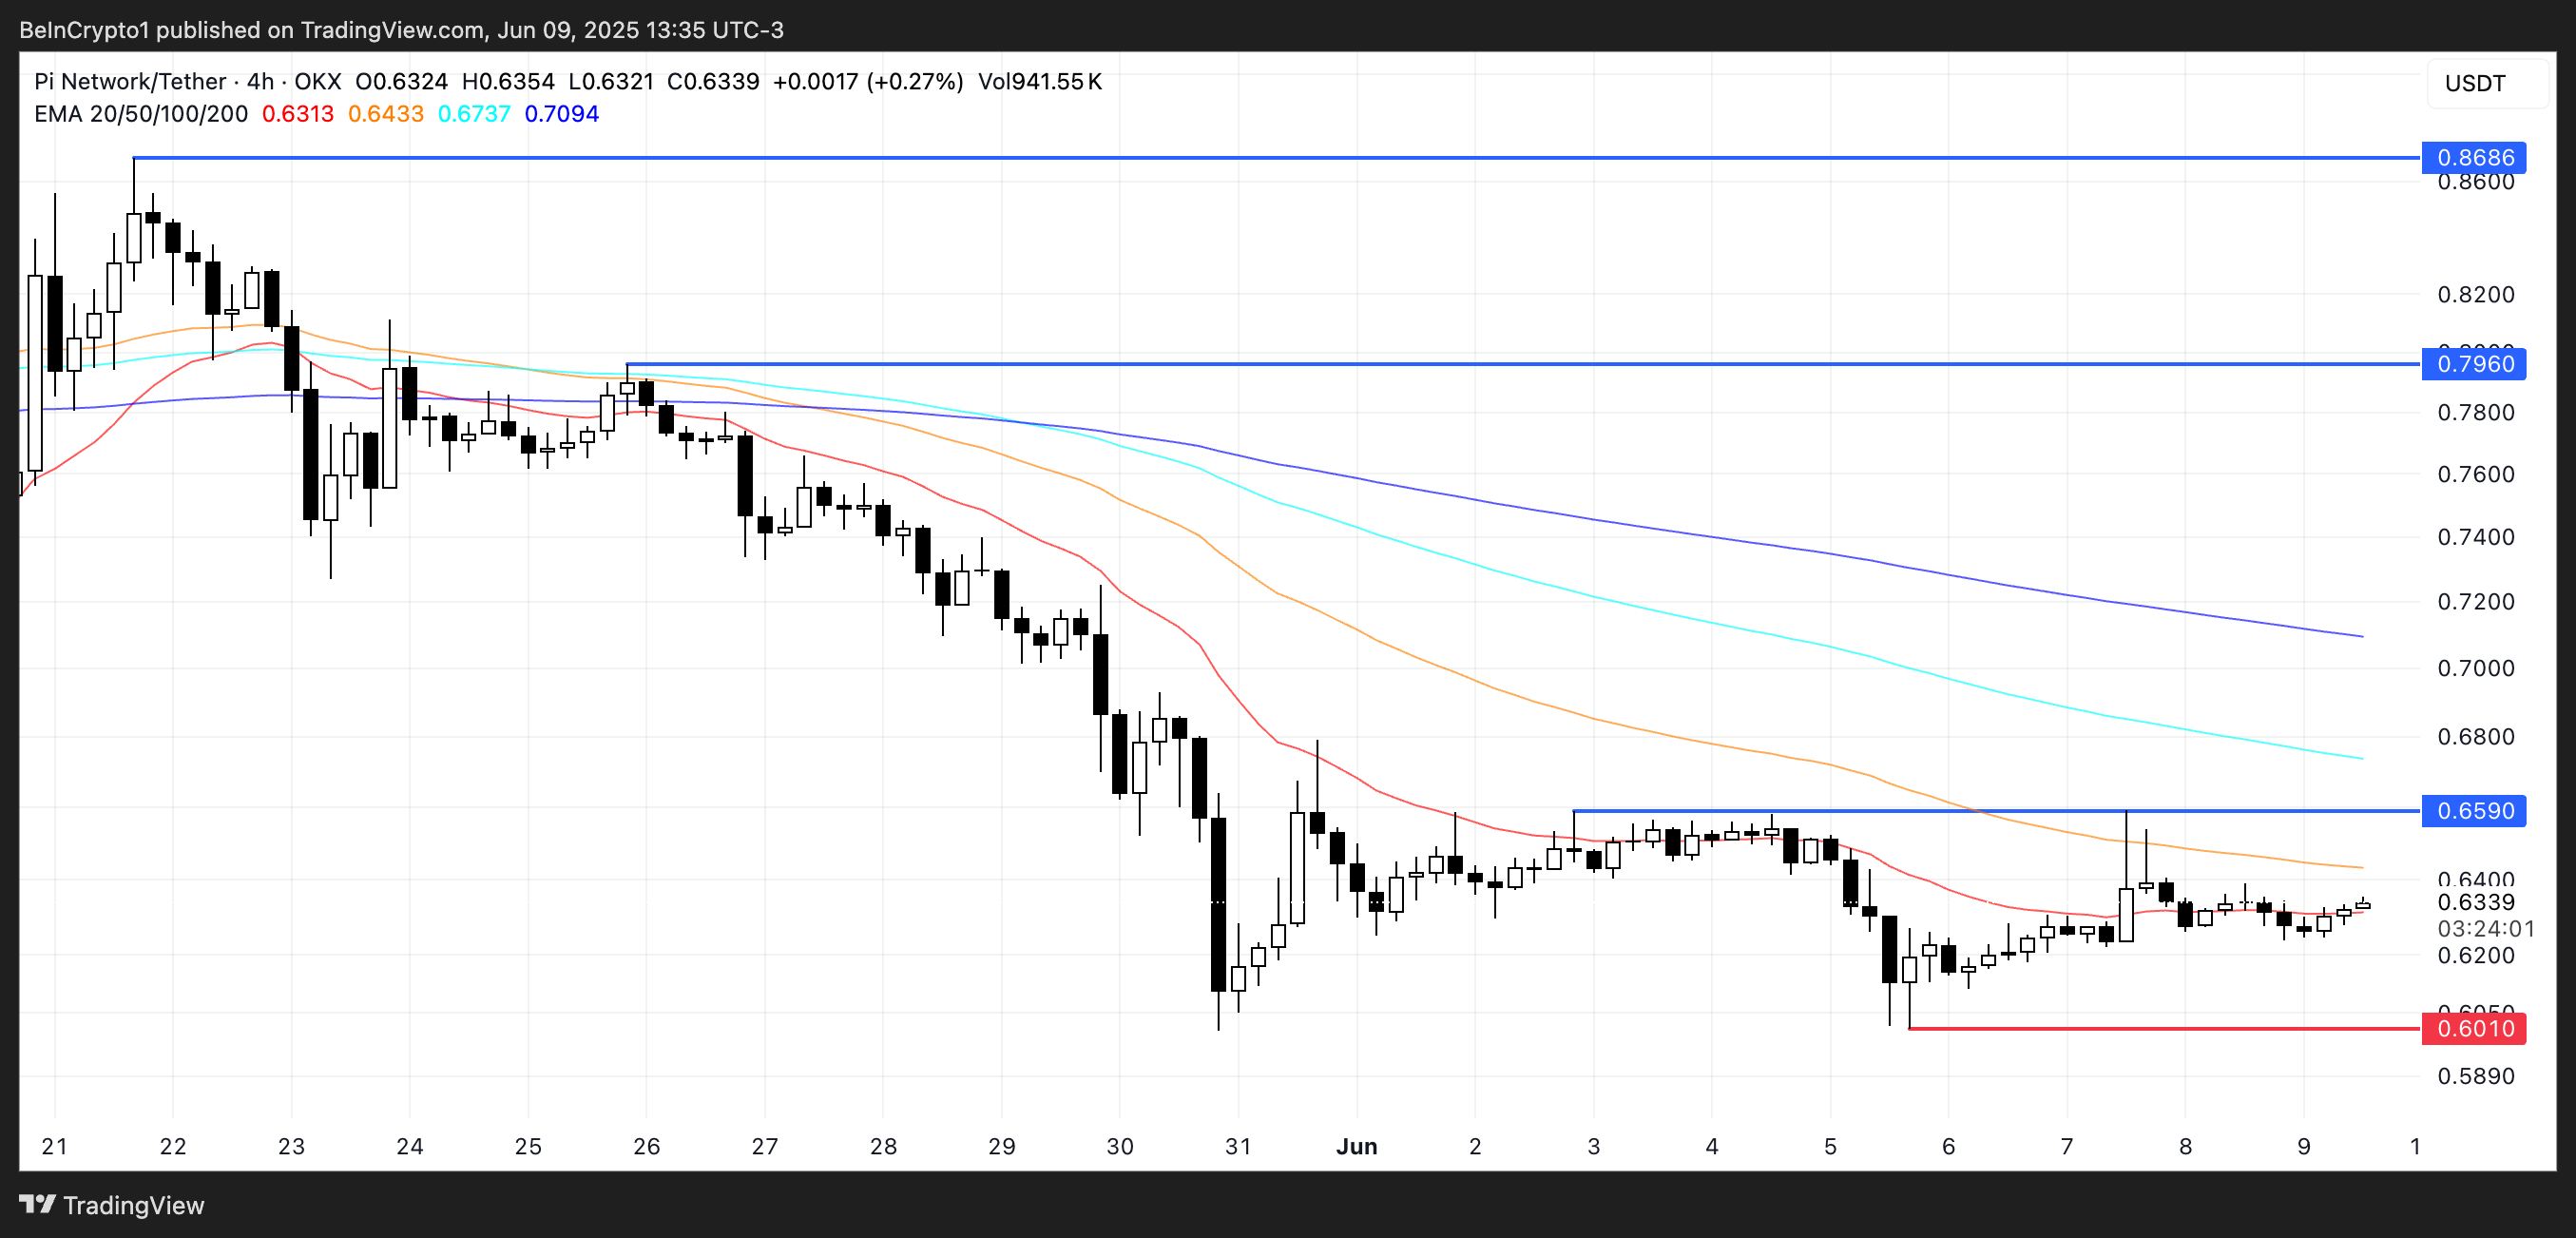
However, if buying pressure strengthens, PI could test resistance at the next significant EMA zone.
A successful breakout above that level, backed by strong momentum, could open the door for a broader recovery.
In a bullish scenario, PI may climb toward higher resistance targets, offering a potential upside of over 35%.
The post Pi Network Indicators are Still Bearish – Is There Any Chance for PI Recovery? appeared first on BeInCrypto.