
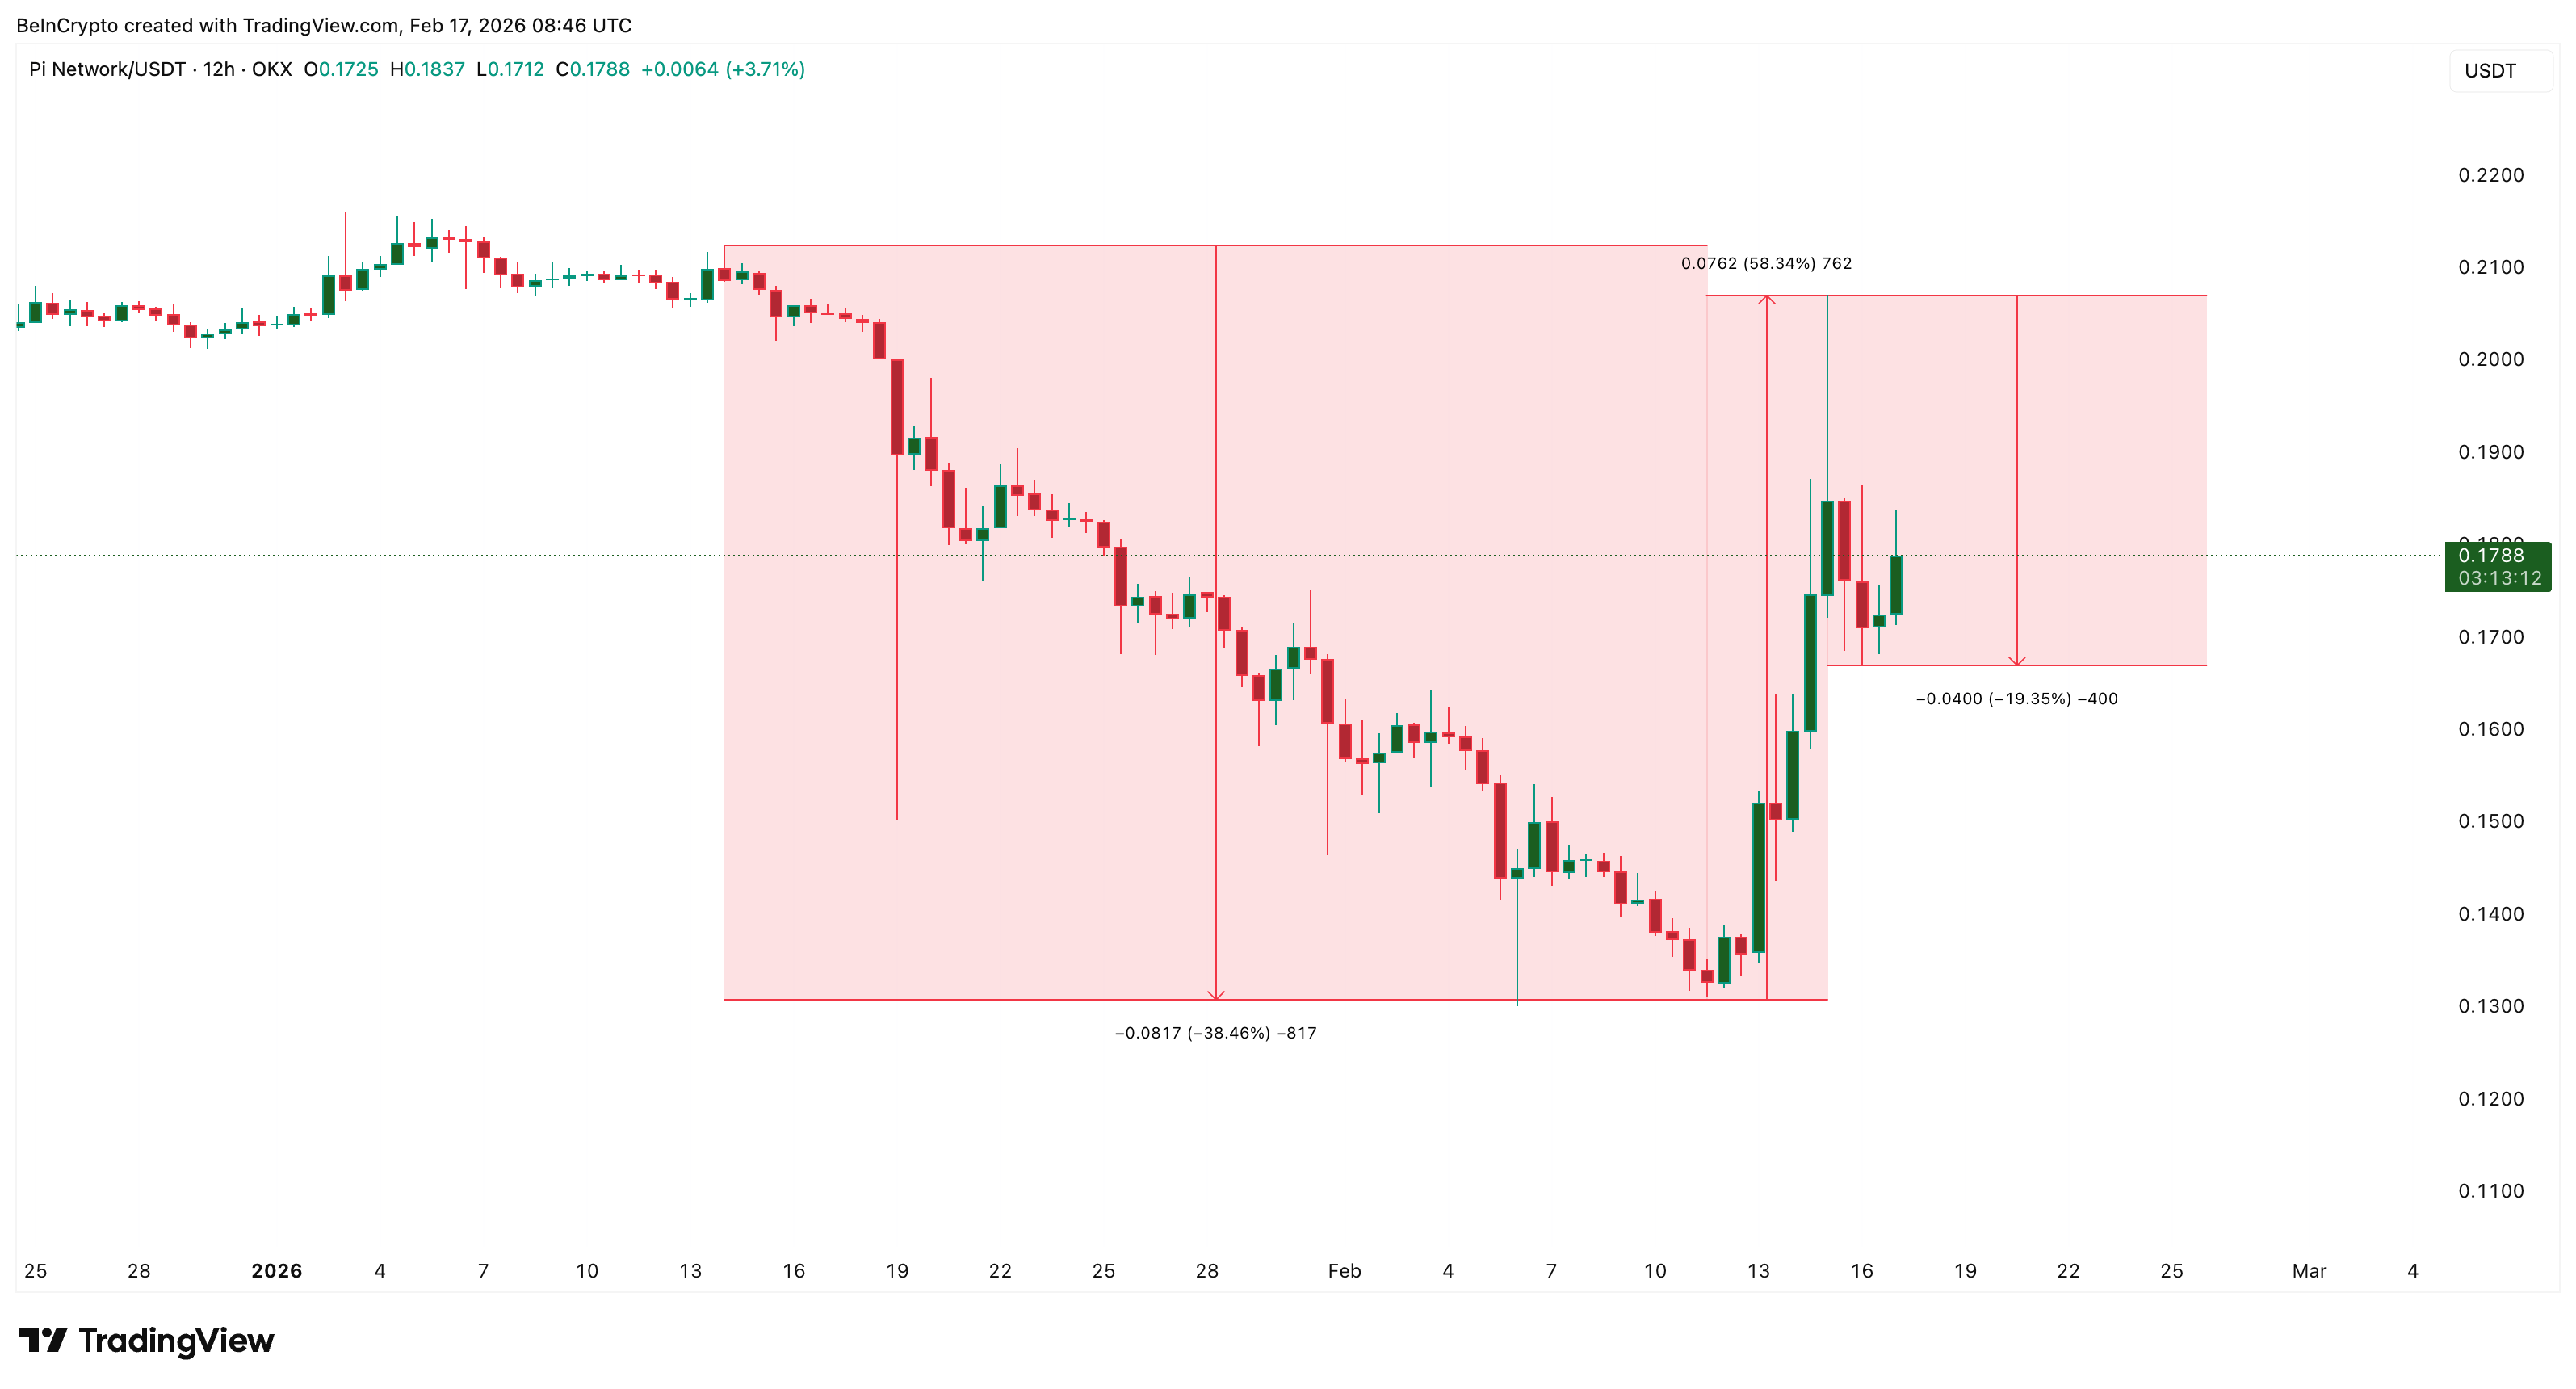
Pi Coin price has gone through a sharp roller-coaster-like move over the past month. Between Jan. 14 and Feb. 11, Pi Coin fell nearly 38% as sentiment collapsed and sellers dominated. But the trend reversed quickly. Since Feb. 11, Pi Coin surged as much as 58% before correcting again.
Now, sentiment is improving once more for the Pi Network’s native token, and charts show this correction may not be a reversal. Instead, it could be preparation for the next breakout. Momentum, money flow, and price structure now explain why a much larger 60% move may still be possible.
Sentiment Collapse and Recovery Explain Pi Coin’s Roller-Coaster Move
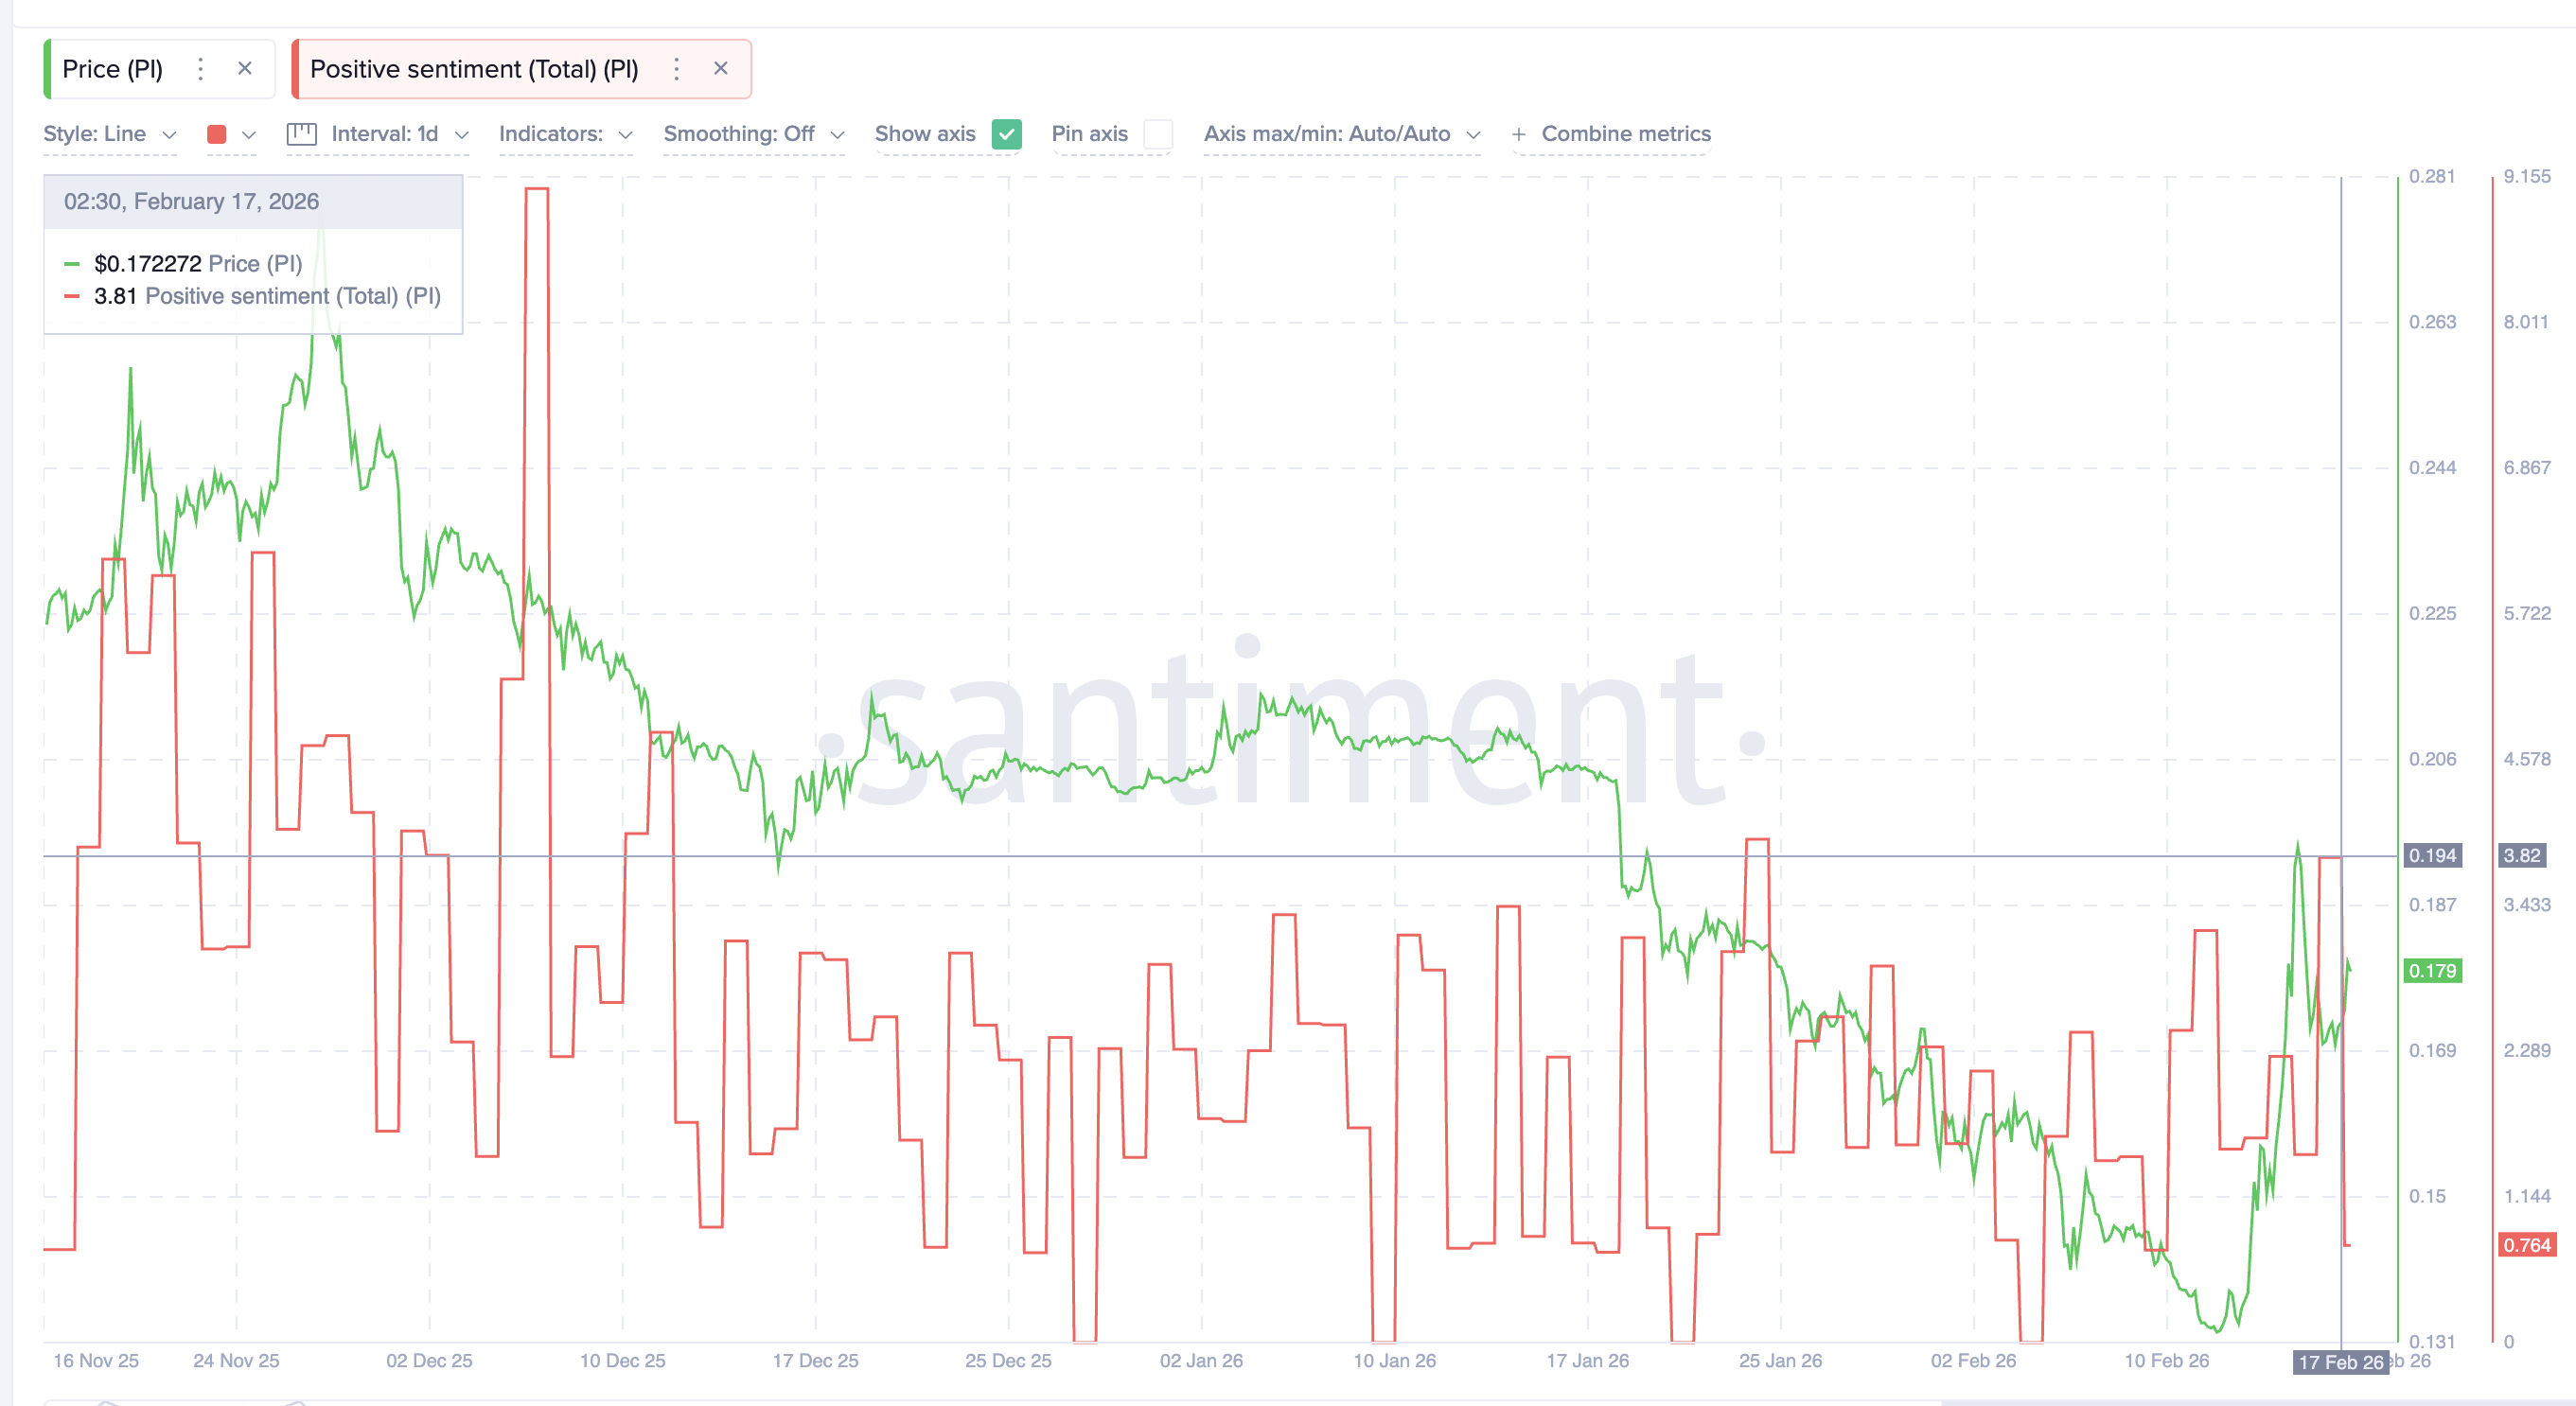
Investor sentiment played a key role in Pi Coin’s recent volatility. Positive sentiment, which measures how optimistic investors feel based on social and market data, dropped sharply between December and early February. The sentiment score fell from 9.06 in early December to nearly zero by Feb. 4.
Want more token insights like this? Sign up for Editor Harsh Notariya’s Daily Crypto Newsletter here.
This collapse aligned with Pi Coin’s earlier range-bound move and the 38% price decline post Jan.14.
However, sentiment began improving again after Feb. 4. By Feb. 17, the score recovered to 3.82, aligning with the sharp price surge between Feb. 11 and Feb. 15 (over 58%). While still below earlier highs, this sentiment rebound, both before and after the rally, shows confidence is slowly returning.
This shift helps explain why Pi Coin quickly reversed its downtrend and began recovering. But the recovery itself was not random. It followed a precise technical breakout.
Breakout Pattern Completed, But Dip Buyers Still Active?
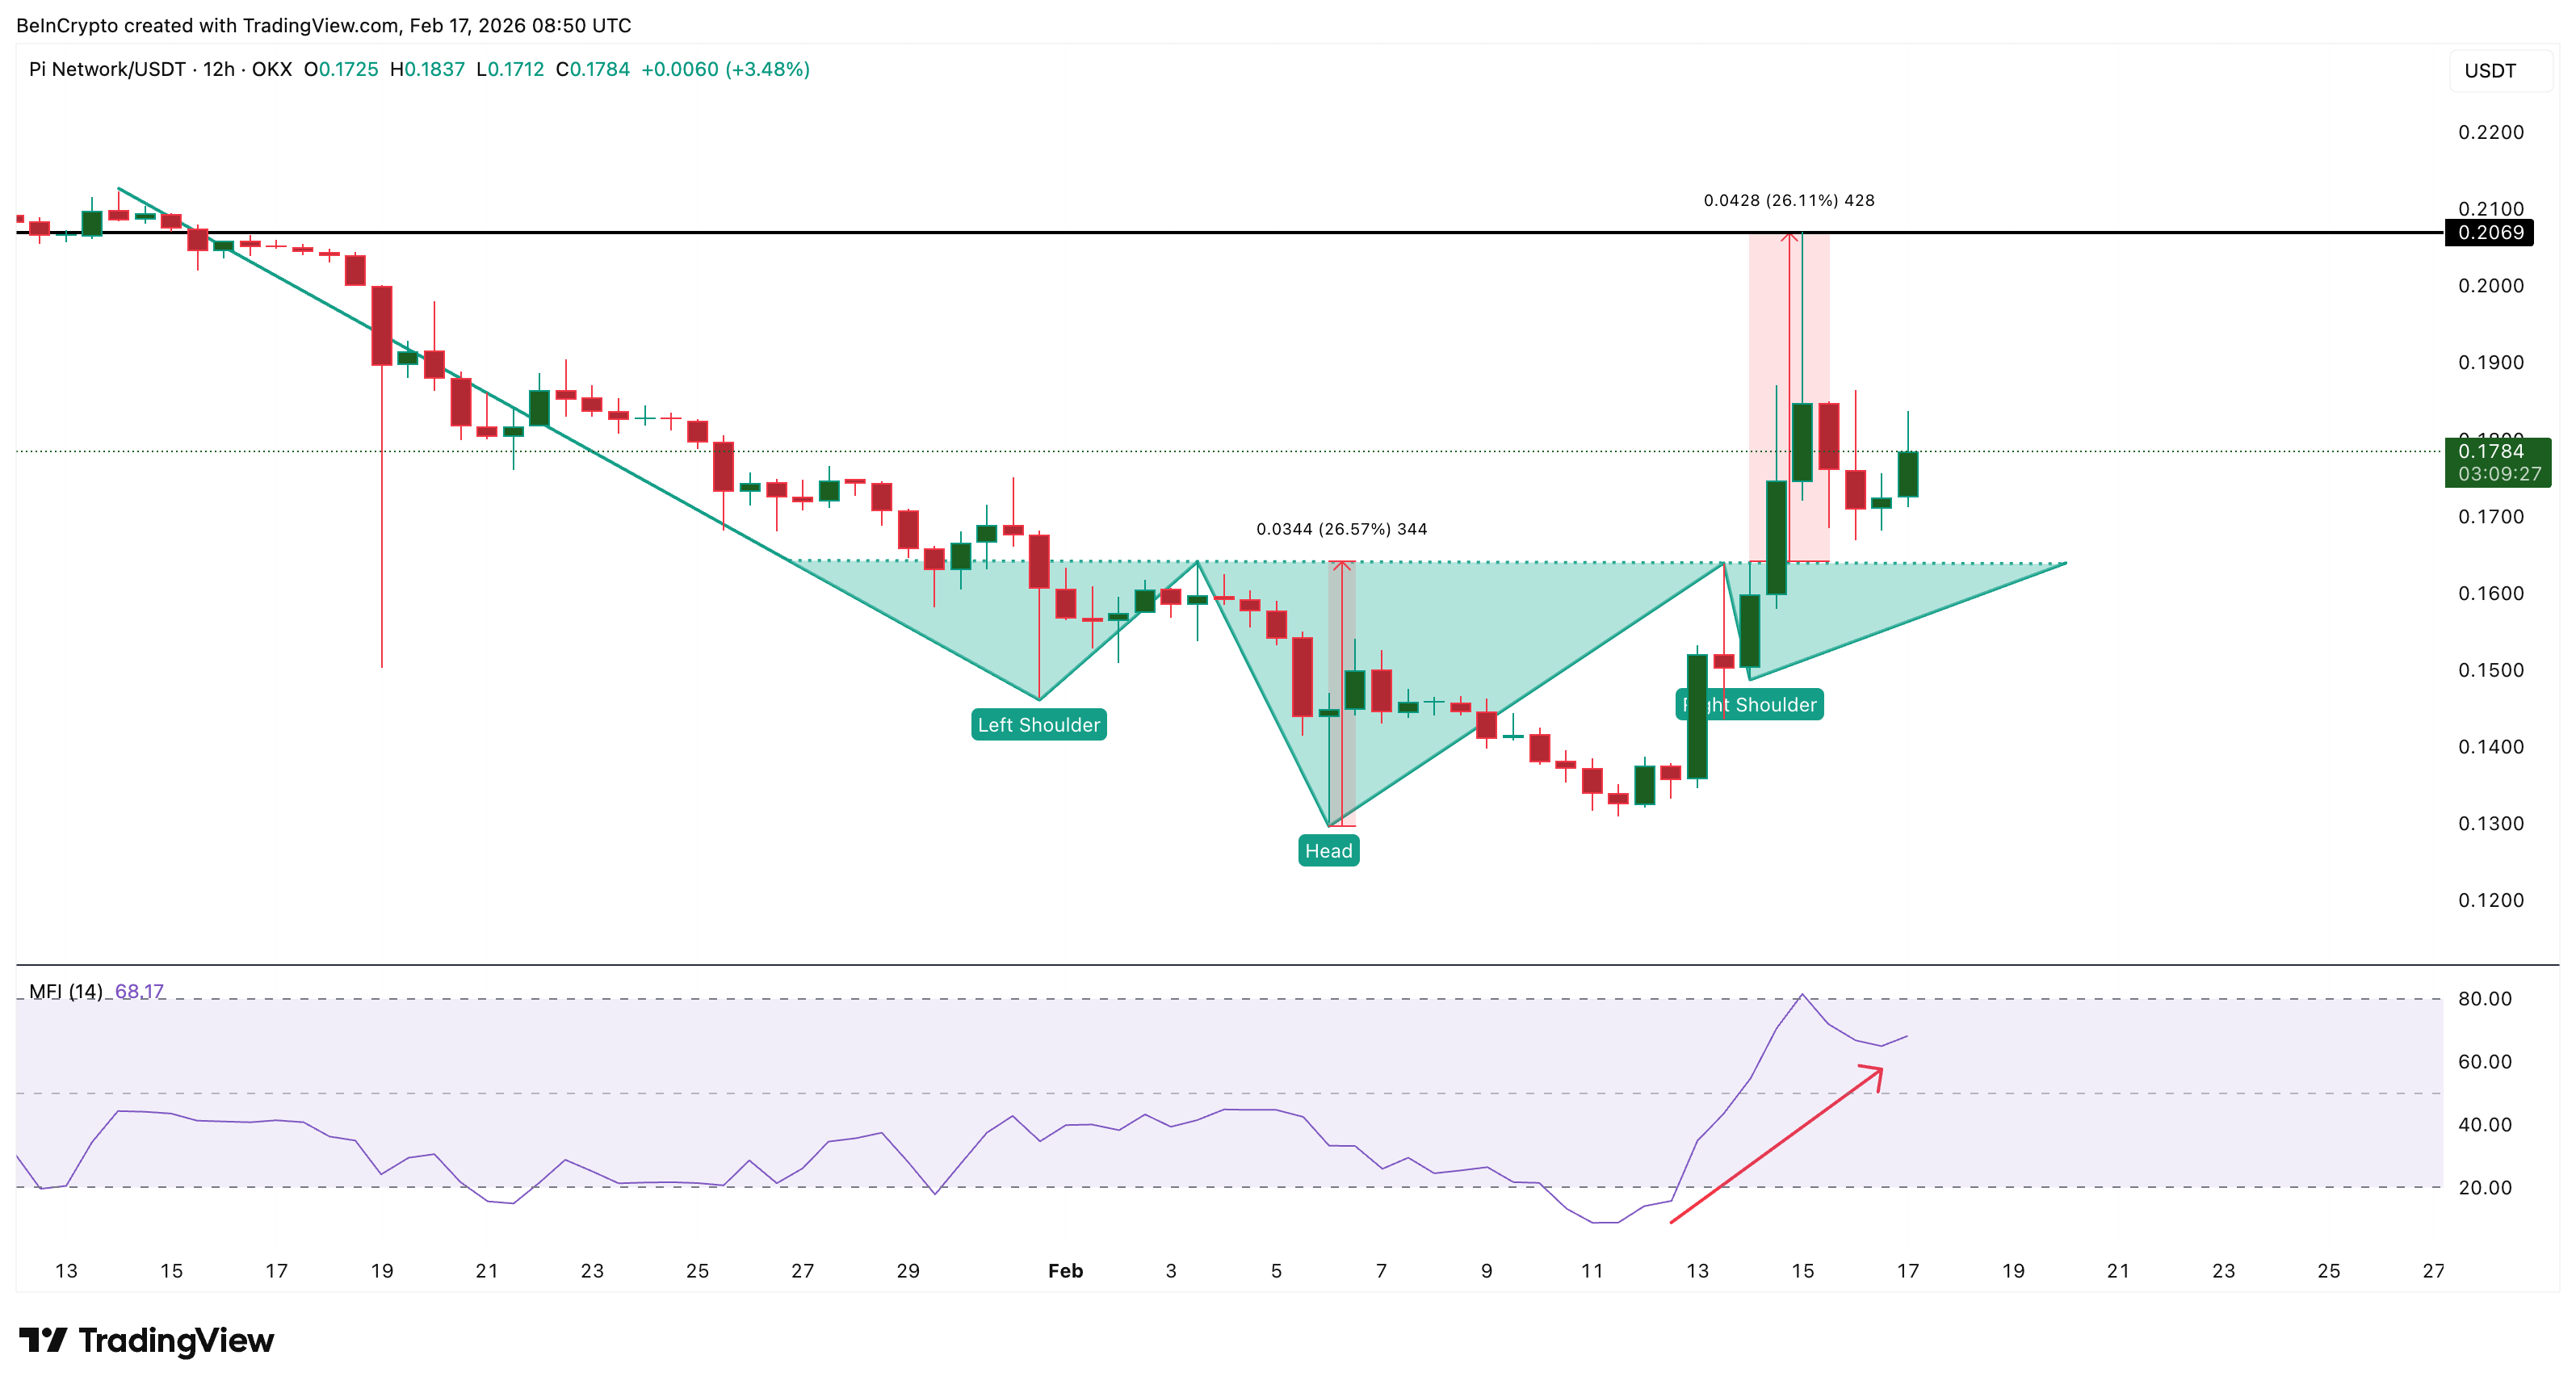
Pi Coin formed an inverse head-and-shoulders pattern, a bullish structure that signals a trend reversal after a decline. This pattern completed on Feb. 14 and pushed Pi Coin up roughly 26% toward its $0.206 level.
This level acted as the breakout target, and once reached, many traders took profits. This explains the large upper wick and the sharp pullback that followed. However, the Money Flow Index (MFI) tells a deeper story. The MFI measures buying and selling pressure by combining price and volume. When MFI forms higher lows, it possibly indicates that buyers continue to enter on dips.
Despite the correction, PI’s MFI stayed elevated, close enough to its recent local peak. This confirms dip buyers remained active and present even during the pullback.
This behavior often appears when investors position for another move higher. That raises the next question. Why are buyers still accumulating after the breakout target already completed? The answer appears in Pi Coin’s current price structure.
Bull Flag and EMA Crossover Show Next Breakout Structure Forming
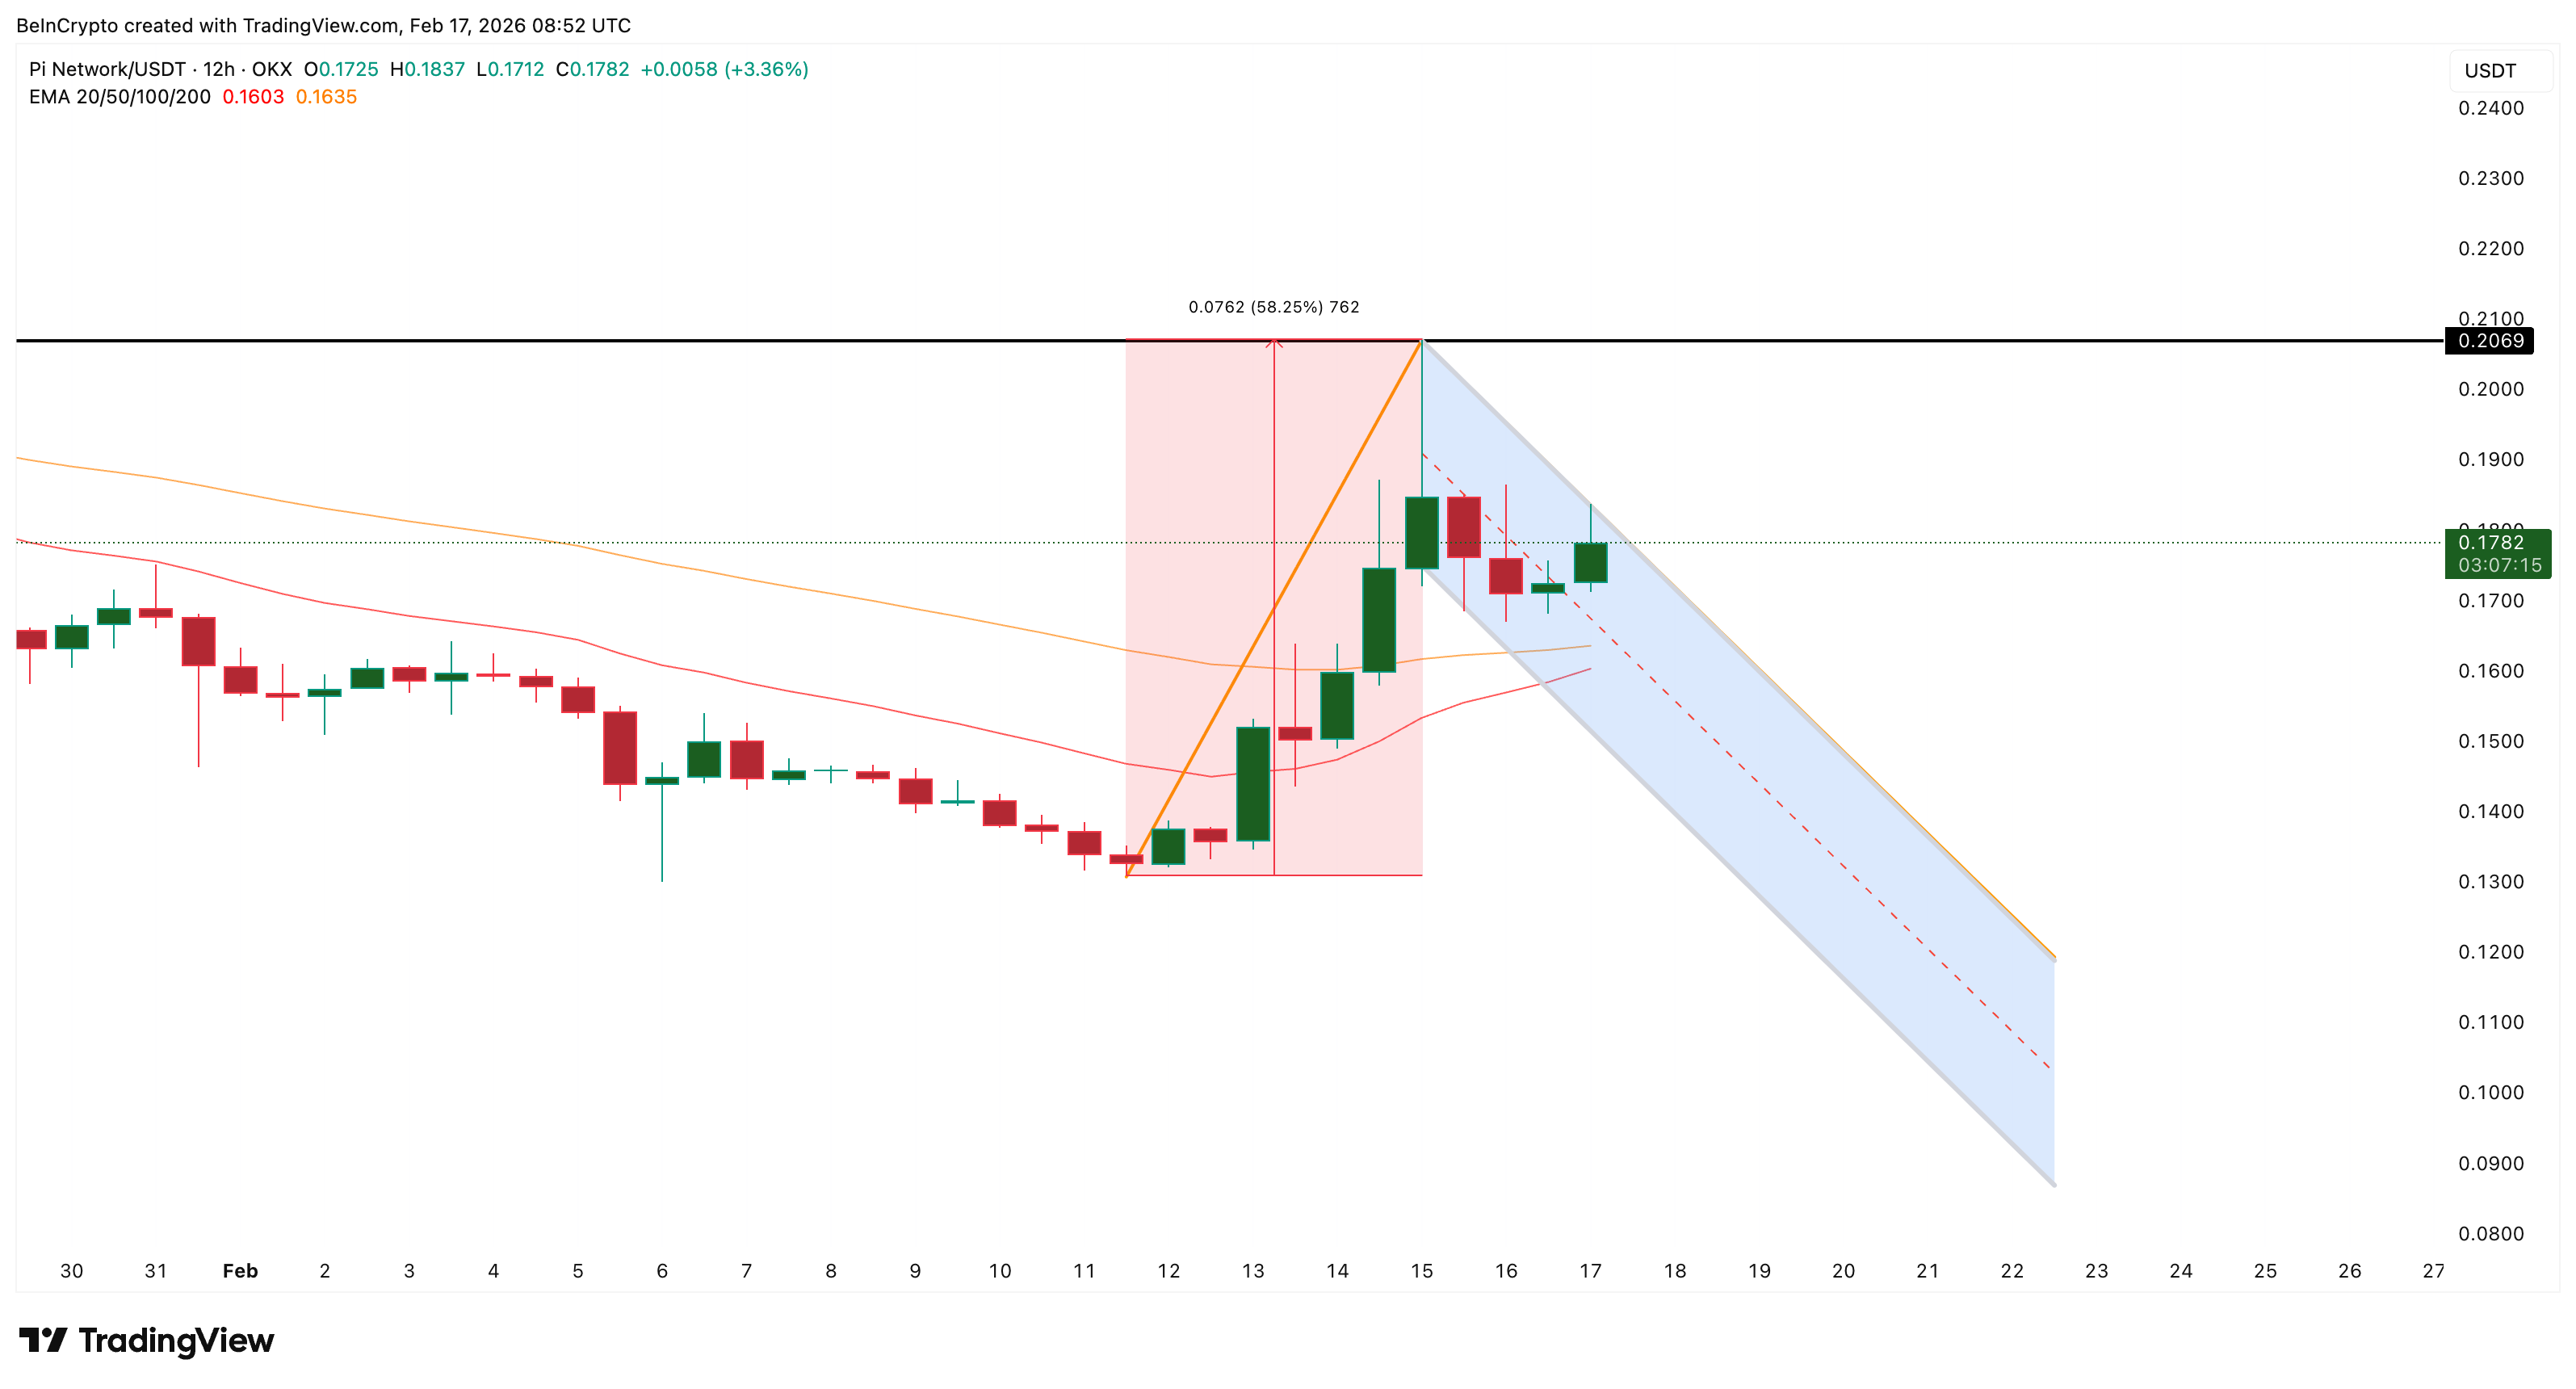
After completing its first breakout, Pi Coin entered consolidation, a 19% dip from $0.206. This consolidation is forming a bull flag pattern. A bull flag is a continuation pattern where price pauses briefly before starting another rally.
At the same time, Pi Coin’s Exponential Moving Averages (EMAs) are signaling growing strength. The 20-period EMA is now approaching a crossover above the 50-period EMA, a potential bullish crossover. The EMA measures the average price over time, and when shorter-term averages cross above longer-term averages, it signals strengthening momentum.
This alignment explains why dip buyers continue entering.
However, timing is critical. If consolidation continues too long, the pattern could weaken. Bull flags require relatively quick breakouts to remain valid. This urgency also explains why buying pressure has remained steady. All of this now brings attention to Pi Coin’s key breakout levels.
Pi Coin Price Targets 60% Move if Key Breakout Level Clears
The immediate resistance level sits at $0.184. Pi Coin has tested this level multiple times but has not yet confirmed a breakout.
If Pi Coin closes above $0.184, the next targets are $0.204 and $0.242. The full bull flag projection points toward $0.290, representing a potential 60% rally from the breakout level. However, downside risk remains.
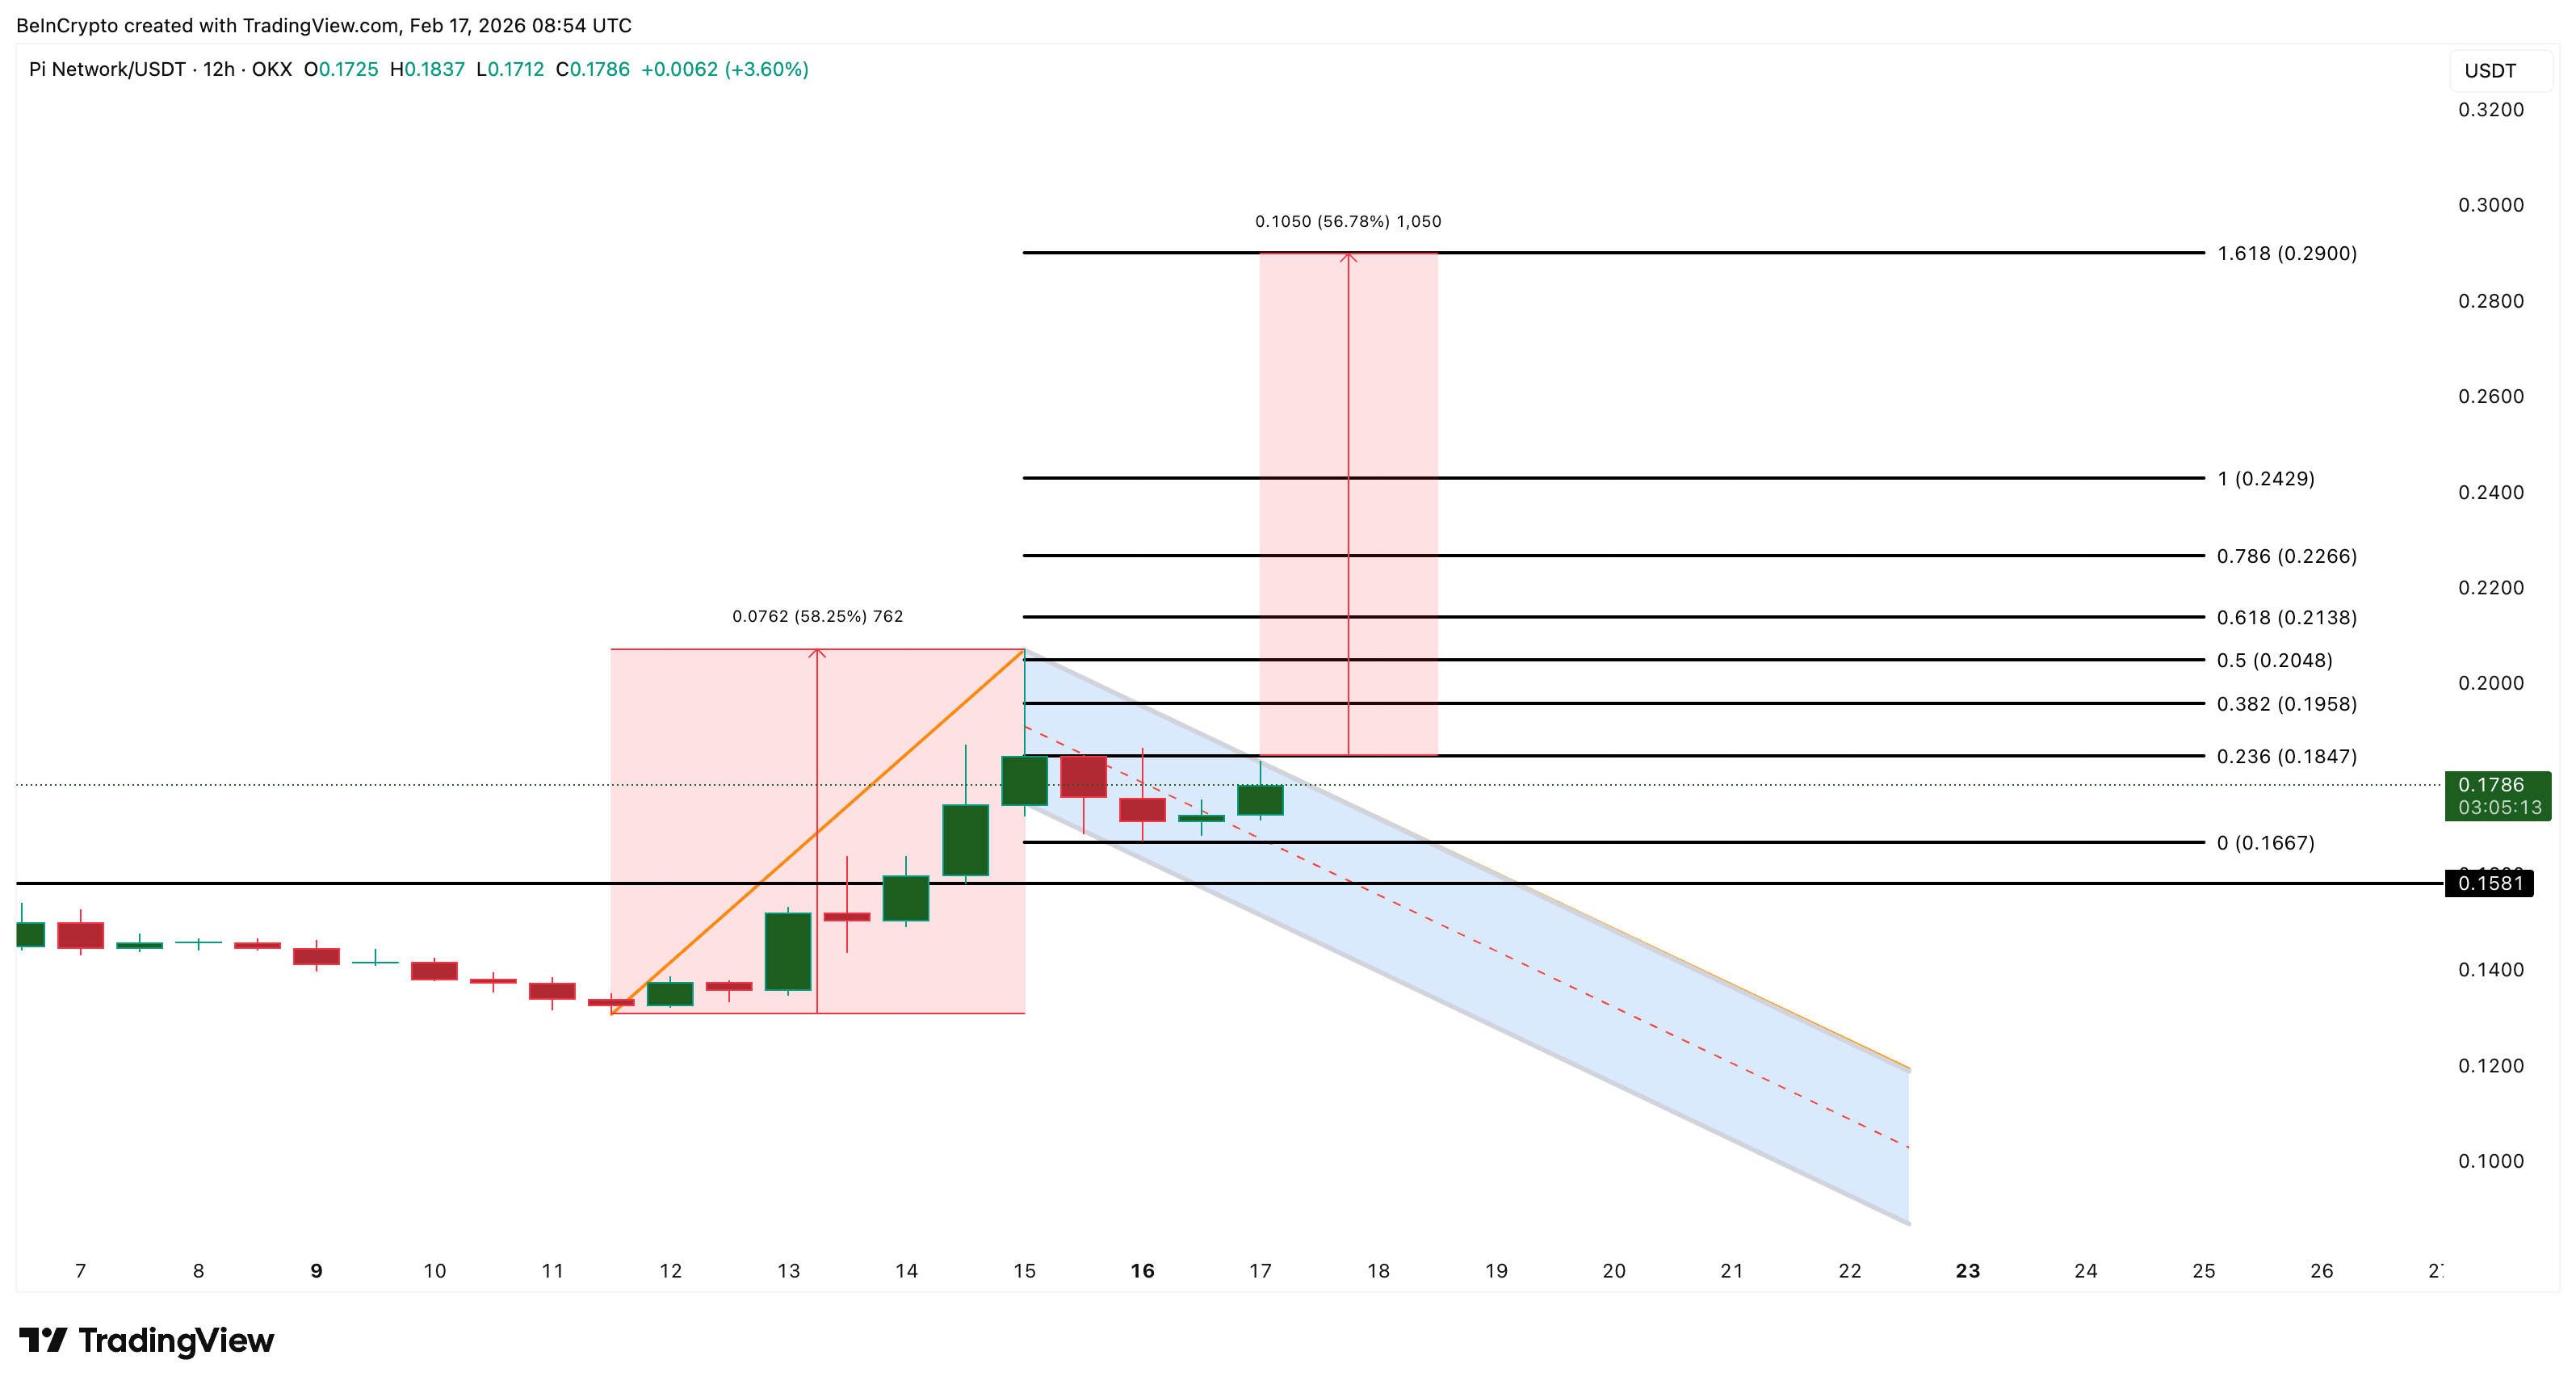
If Pi Coin falls below $0.158, the bull flag pattern would be invalidated. Extended sideways movement could also weaken the setup if consolidation becomes too large relative to the original breakout move. For now, the structure remains intact.
Pi Coin has already completed one breakout. Sentiment is improving. Money flow shows that dip buyers remain active, and the price structure is preparing for another potential breakout. The next confirmed move above resistance will determine whether Pi Coin can complete its larger 60% rally setup.
The post Pi Coin Price Hits Breakout Target as Sentiment Improves — Is Another 60% Move Coming? appeared first on BeInCrypto.