
Pi Coin has struggled since late November. After peaking near the end of the month, the price has dropped roughly 28%, erasing most of its earlier gains. Over the past seven days alone, Pi Coin is down about 8.6%, and over the past three months, losses now exceed 40%.
Despite that weakness, the latest chart data shows something new forming beneath the surface. Momentum pressure is starting to shift, raising the question of whether the correction may be nearing a pause. Will the pause lead to a rebound or a complete reversal? Time to find out!
Momentum Pressure Is Easing, But Buyers Are Still Hesitant
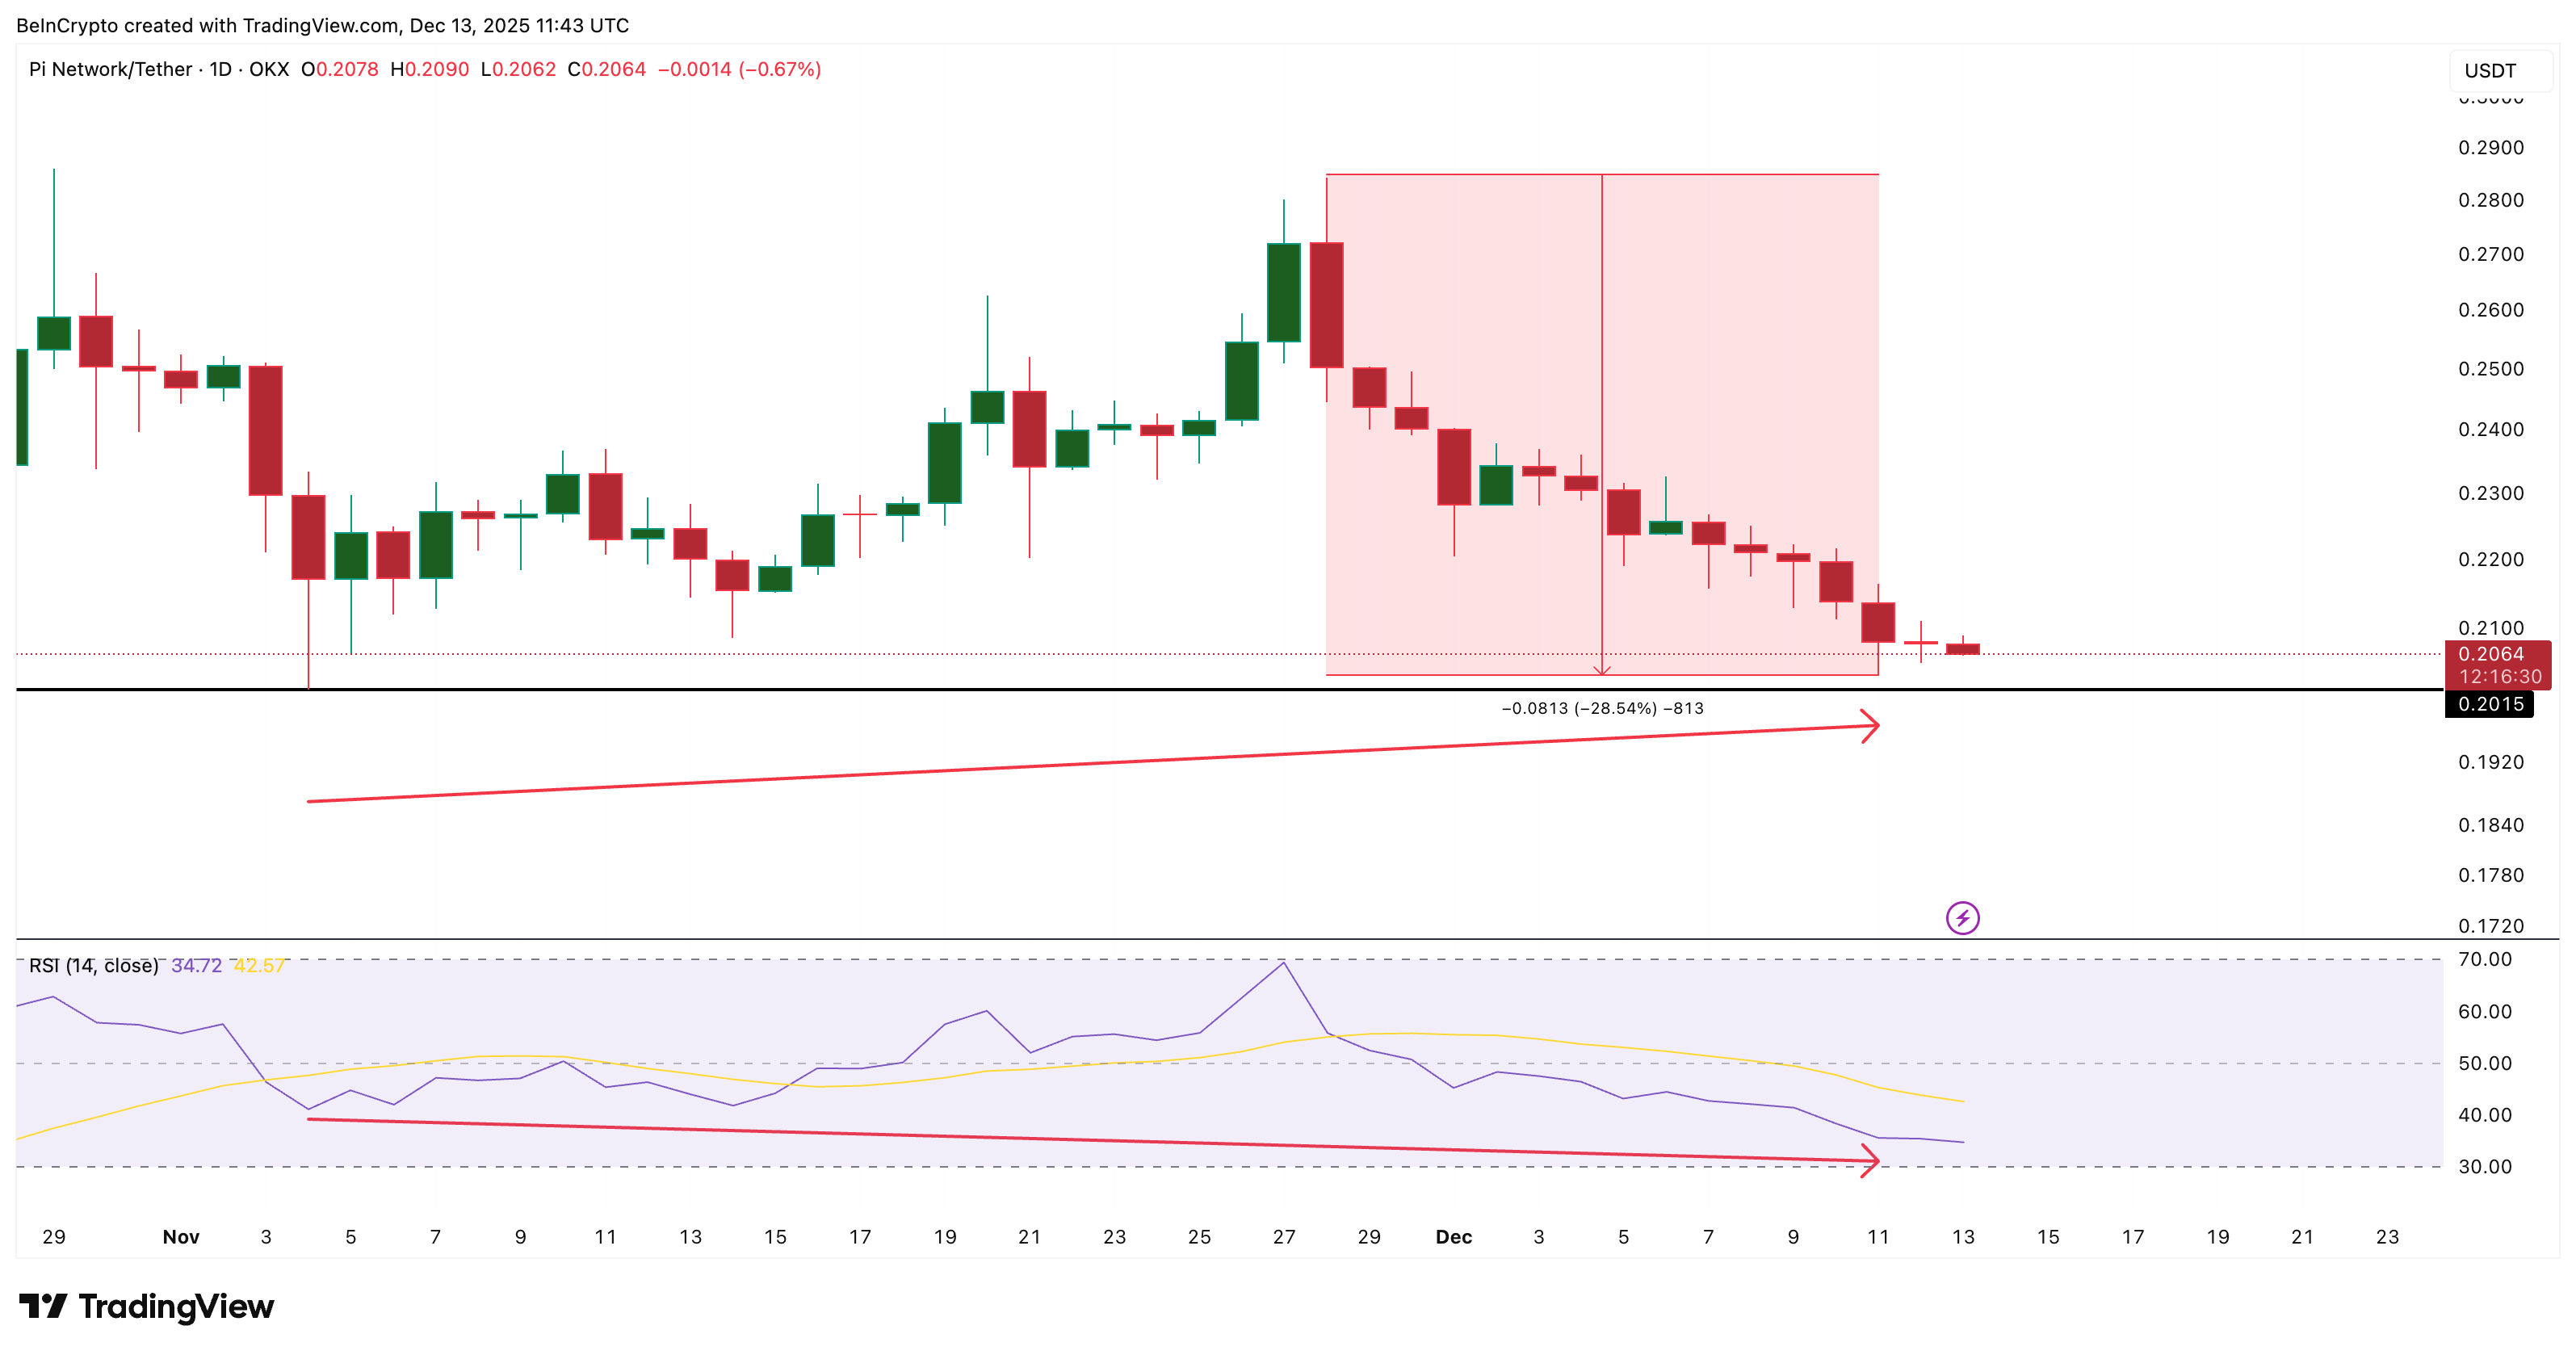
On the daily chart, Pi Coin has formed a hidden bullish divergence between November 4 and December 11. During this period, price made a higher low while the Relative Strength Index made a lower low. RSI measures momentum by tracking the speed of buying and selling. When price holds higher levels while momentum weakens, it often signals that selling pressure is starting to fade.
Want more token insights like this? Sign up for Editor Harsh Notariya’s Daily Crypto Newsletter here.
This type of divergence usually appears near the end of sharp dips. It does not confirm a reversal by itself, but it often precedes rebound attempts when sellers begin to lose control.
However, momentum alone is not enough. The Chaikin Money Flow, which tracks whether large buyers or sellers are dominating volume, is still flashing caution. CMF remains close to testing its descending trend line (connecting lower lows) and is also trading below the zero line. This shows that big money flows have not turned supportive towards Pi Coin, yet.
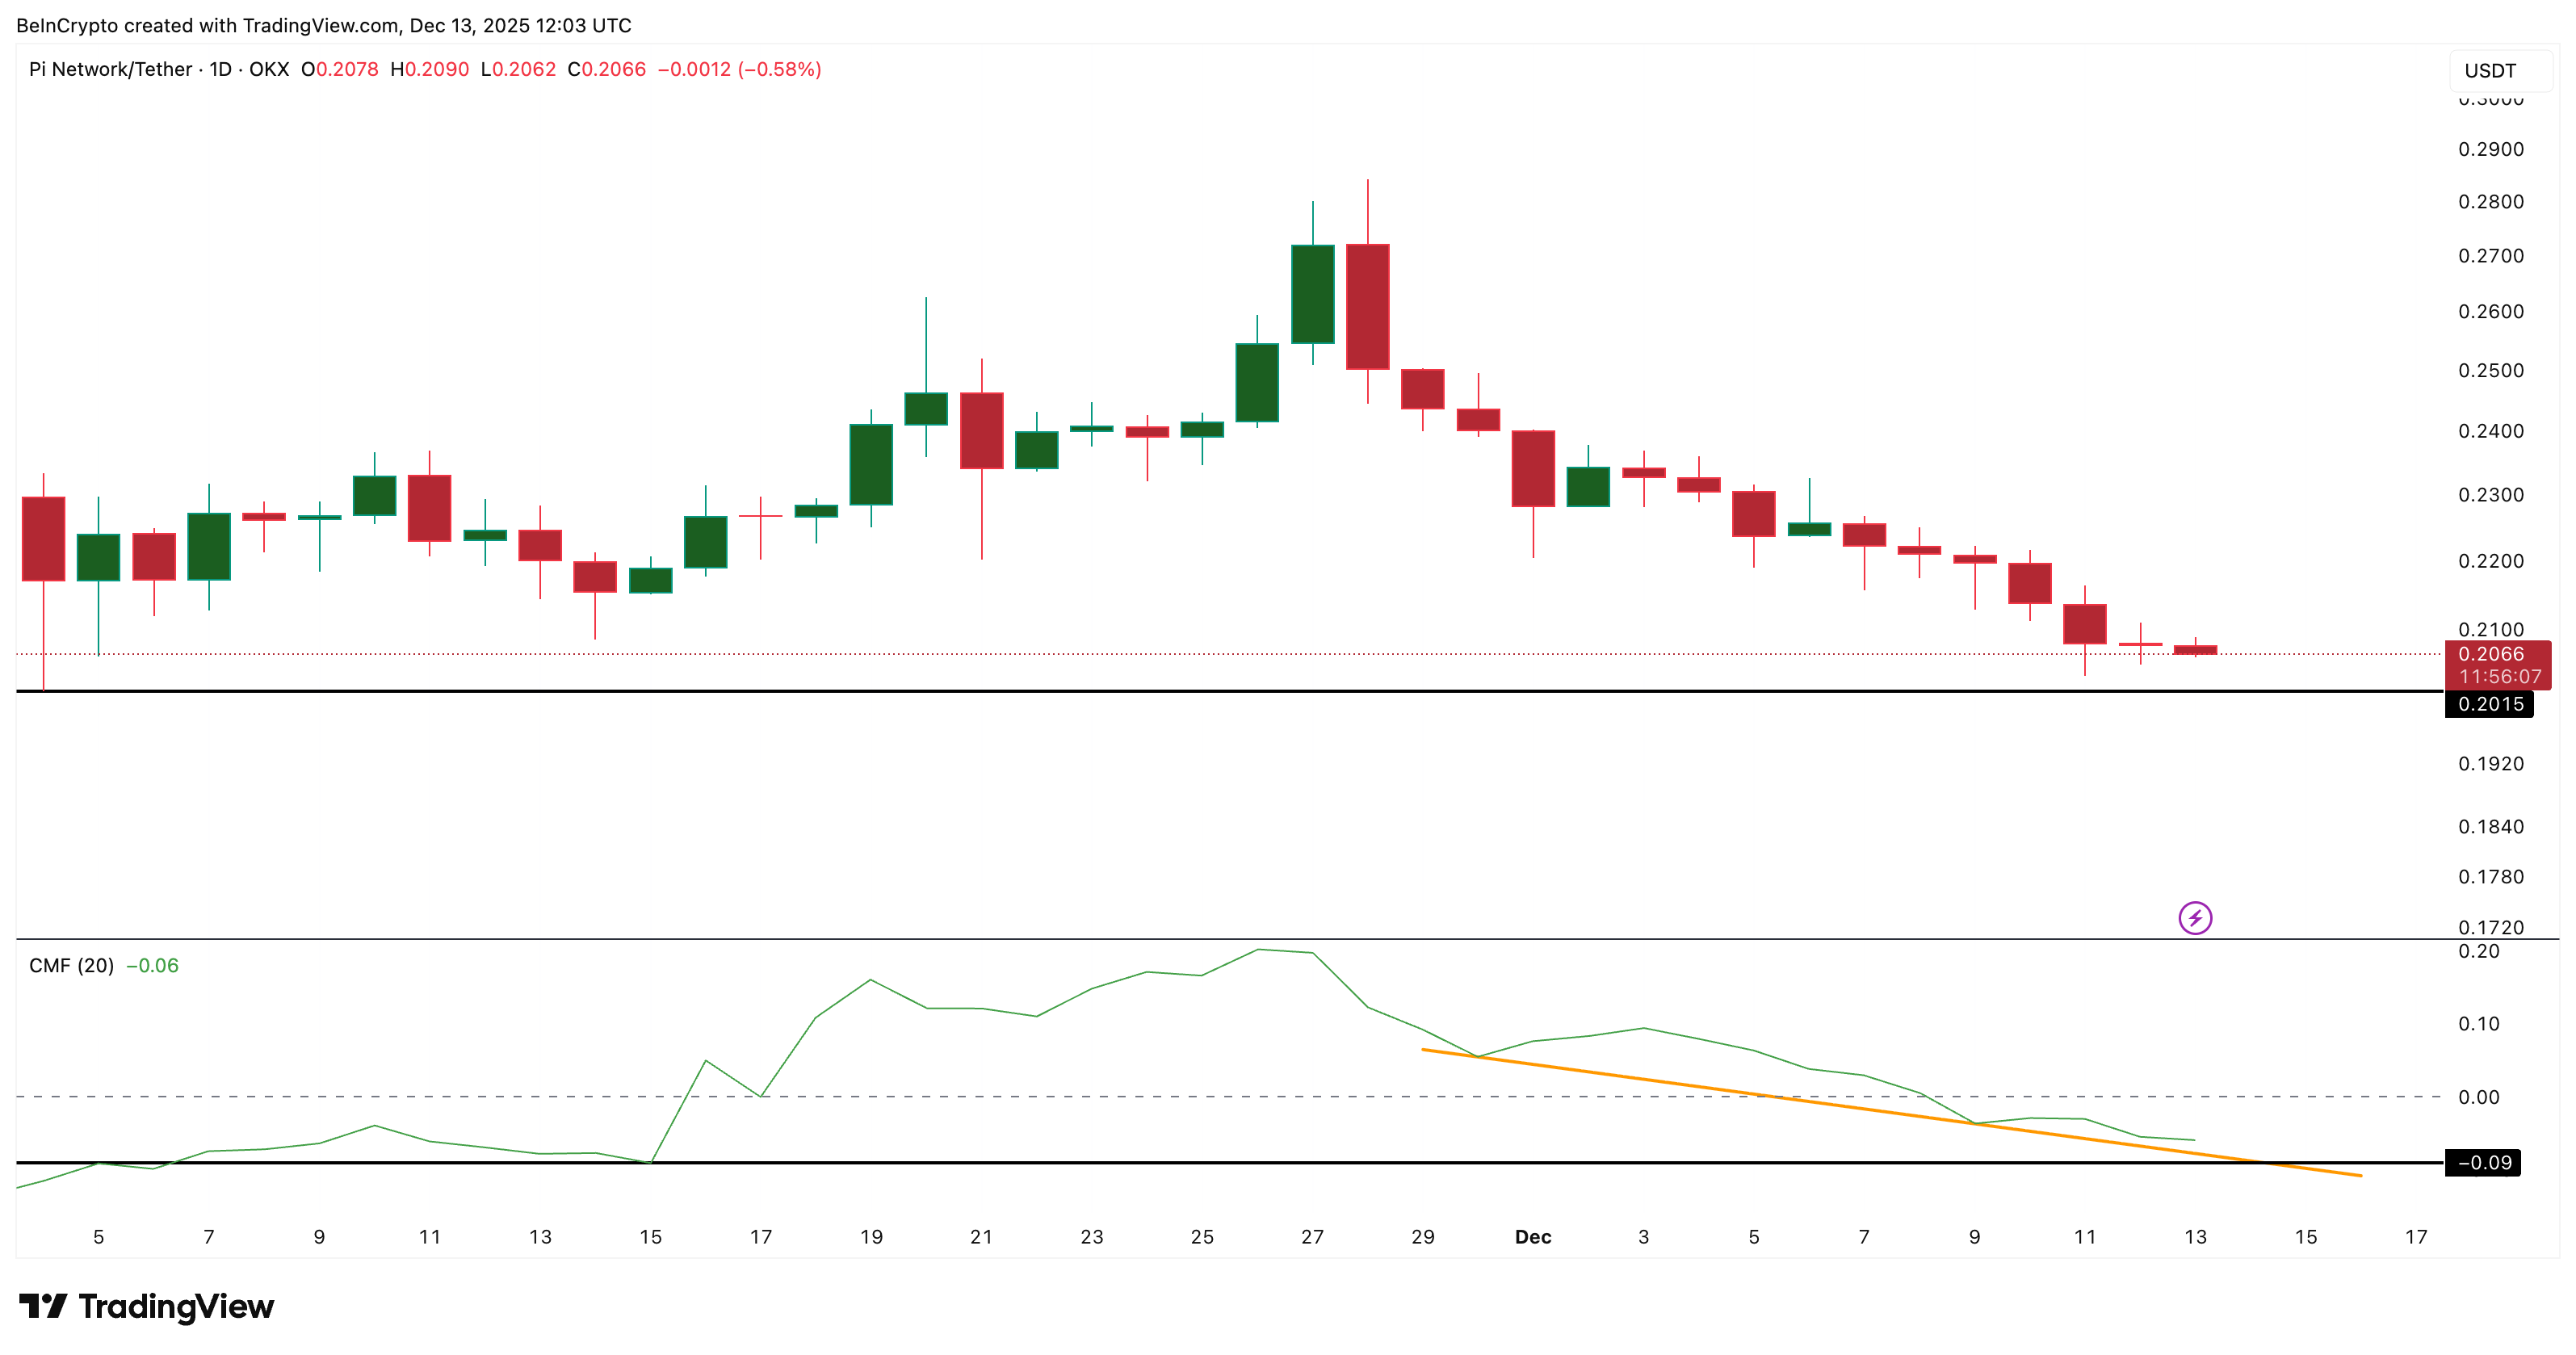
In simple terms, selling pressure looks weaker, but the big buyers are not fully committed. That keeps the rebound setup fragile. Until money flow improves, upside attempts are likely to face resistance. And if the CMF breaks below the trendline, the rebound (not reversal) setup for the Pi Network coin might get invalidated, completely.
Pi Coin Price Levels That Decide What’s Next
The PI price chart now sits at a decision point. For the rebound structure to gain traction, Pi Coin needs to reclaim the $0.222 area. A sustained move above this level would mark roughly a 7% advance and signal that buyers are willing to defend higher prices again. If that happens, the price could extend toward $0.244 and possibly $0.253, provided broader market conditions stabilize.
Only a price move above $0.284 (late November high) could signal a reversal attempt. That point seems to be far off now.
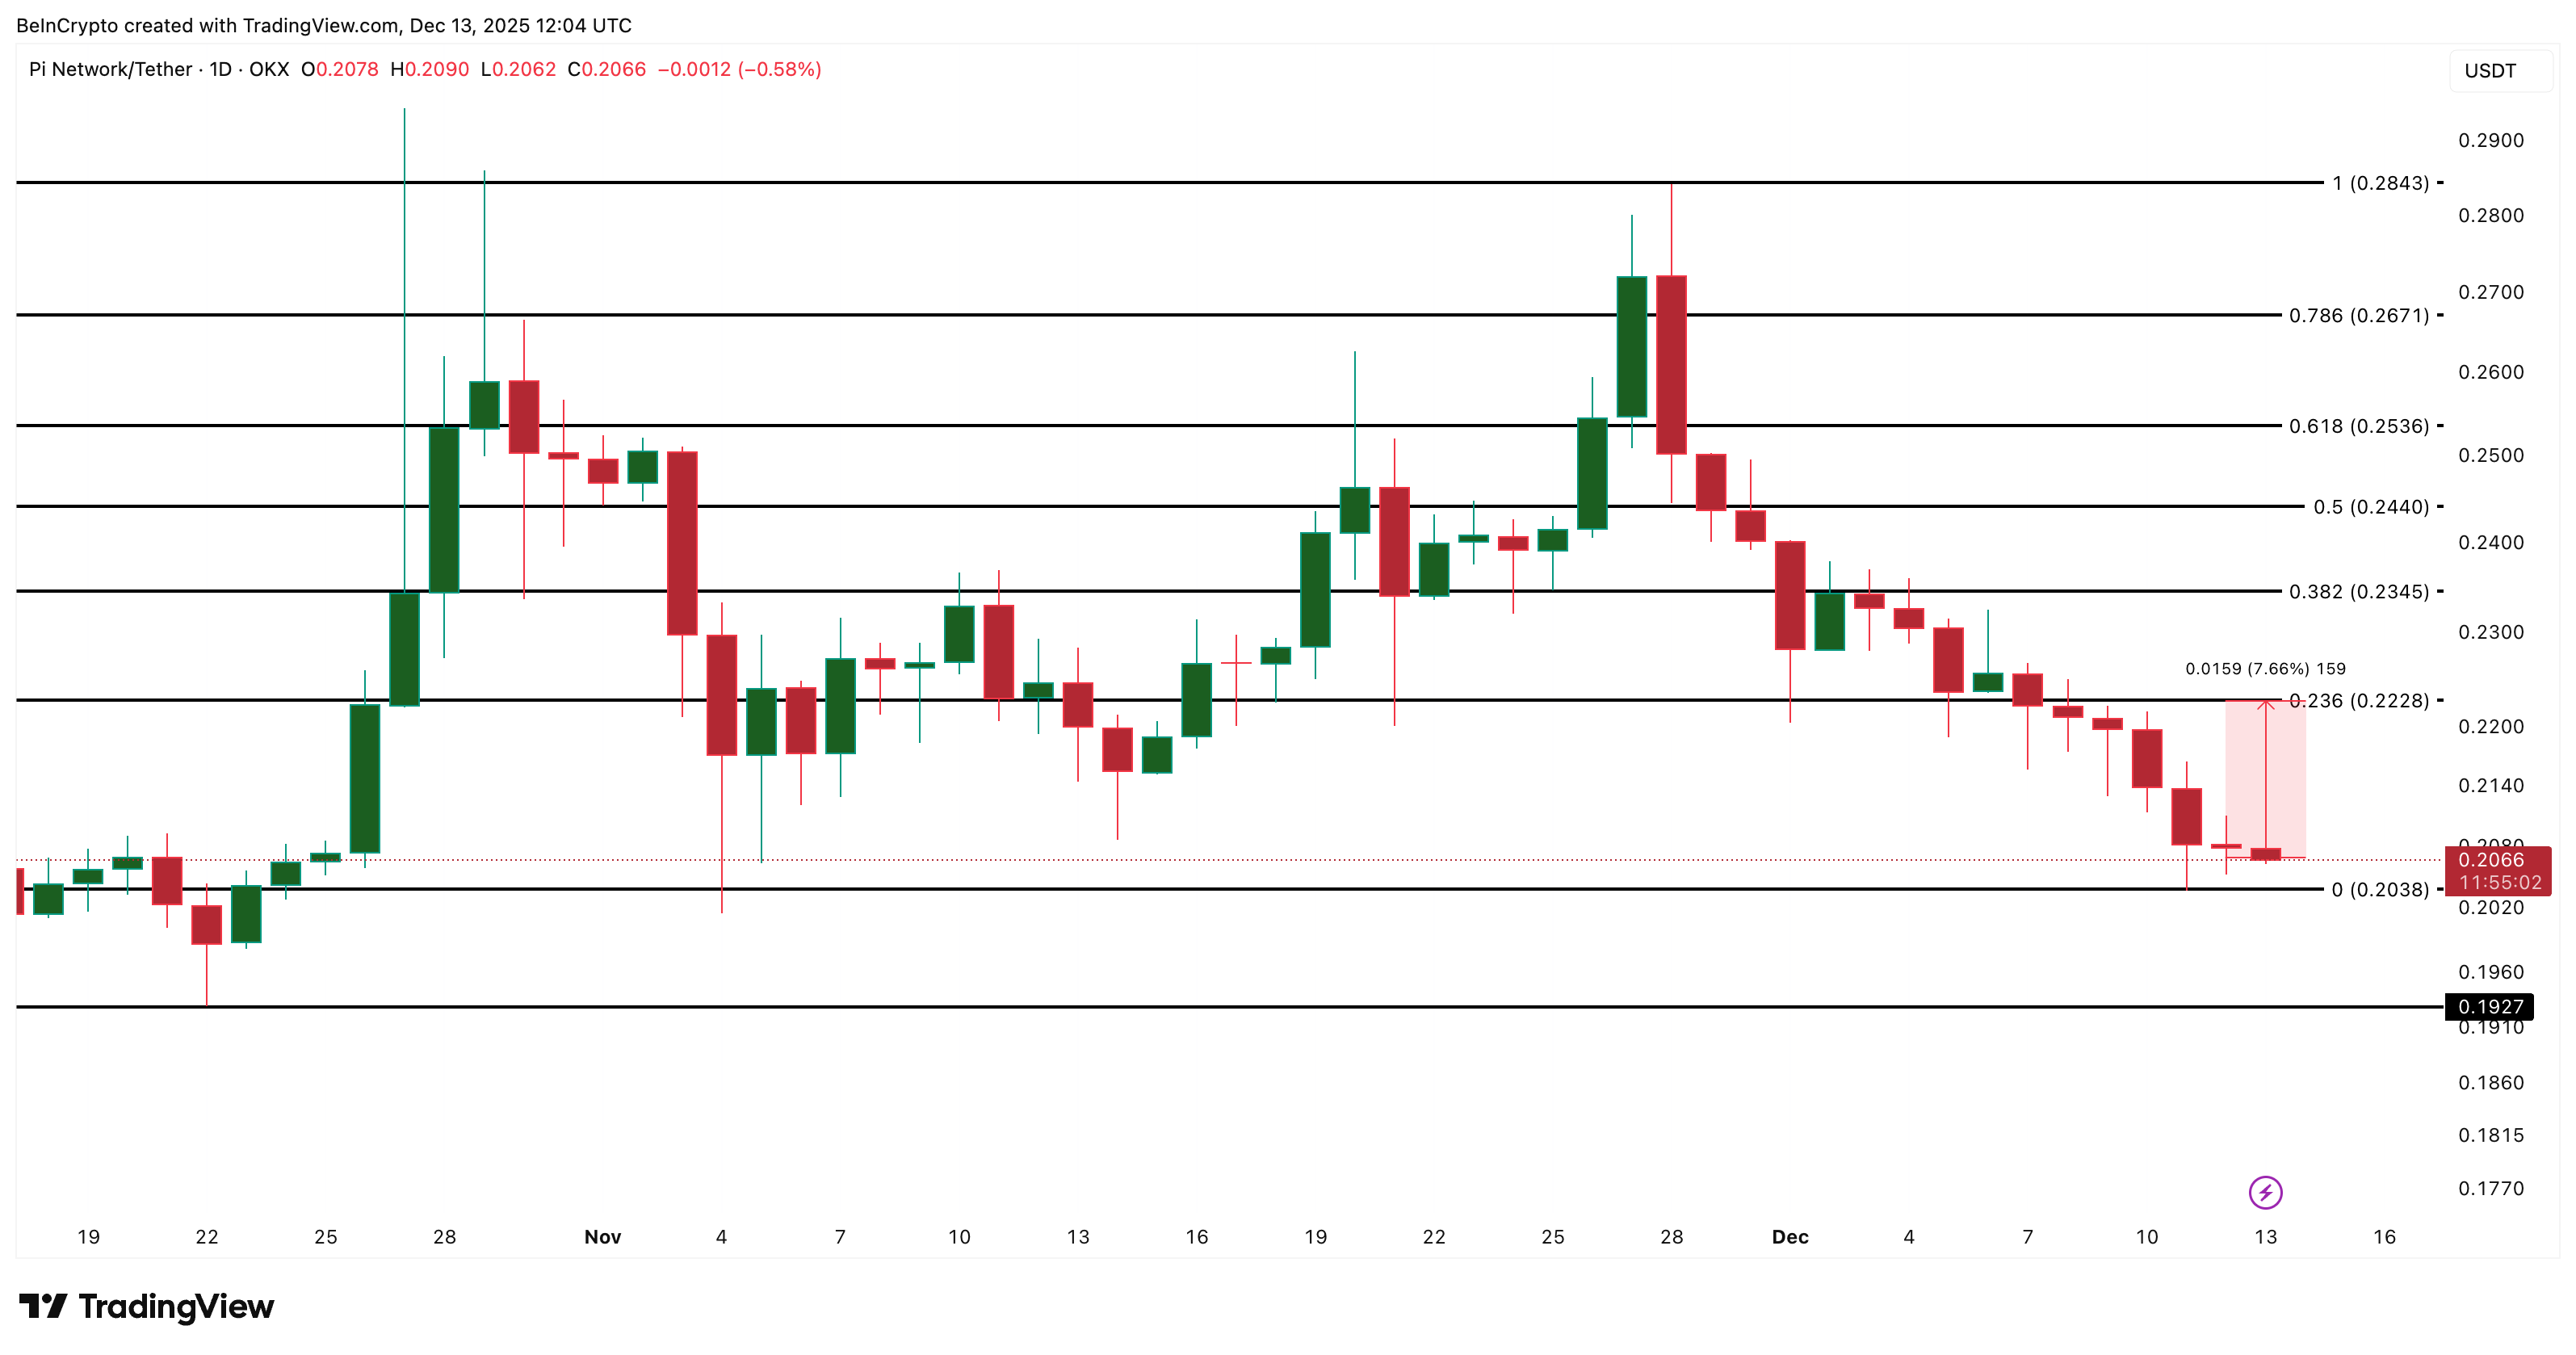
Support remains just below current levels. The $0.203 zone is critical. A daily close below $0.203 would weaken the rebound case significantly and expose the downside again. If that level fails, Pi Coin could retest lower areas and push the correction into a new leg.
The rebound setup only strengthens if the price moves higher while the CMF begins to rise toward zero. Without that confirmation, upside attempts risk stalling quickly.
The post Pi Coin Price Falls 28% From November Highs — Do Charts Now Hint At Reversal? appeared first on BeInCrypto.