
Pi Coin (PI) trades near $0.205 and is flat over the past 24 hours. The Pi Coin price has moved in a tight range for most of December, up just 0.2% in seven days and still down more than 17% in a month.
The broader trend remains weak, so attention shifts to lower timeframes. A short-term breakout setup has formed, but buyers need more than a breakout to confirm strength.
Short-Term Breakout Setup Needs Confirmation
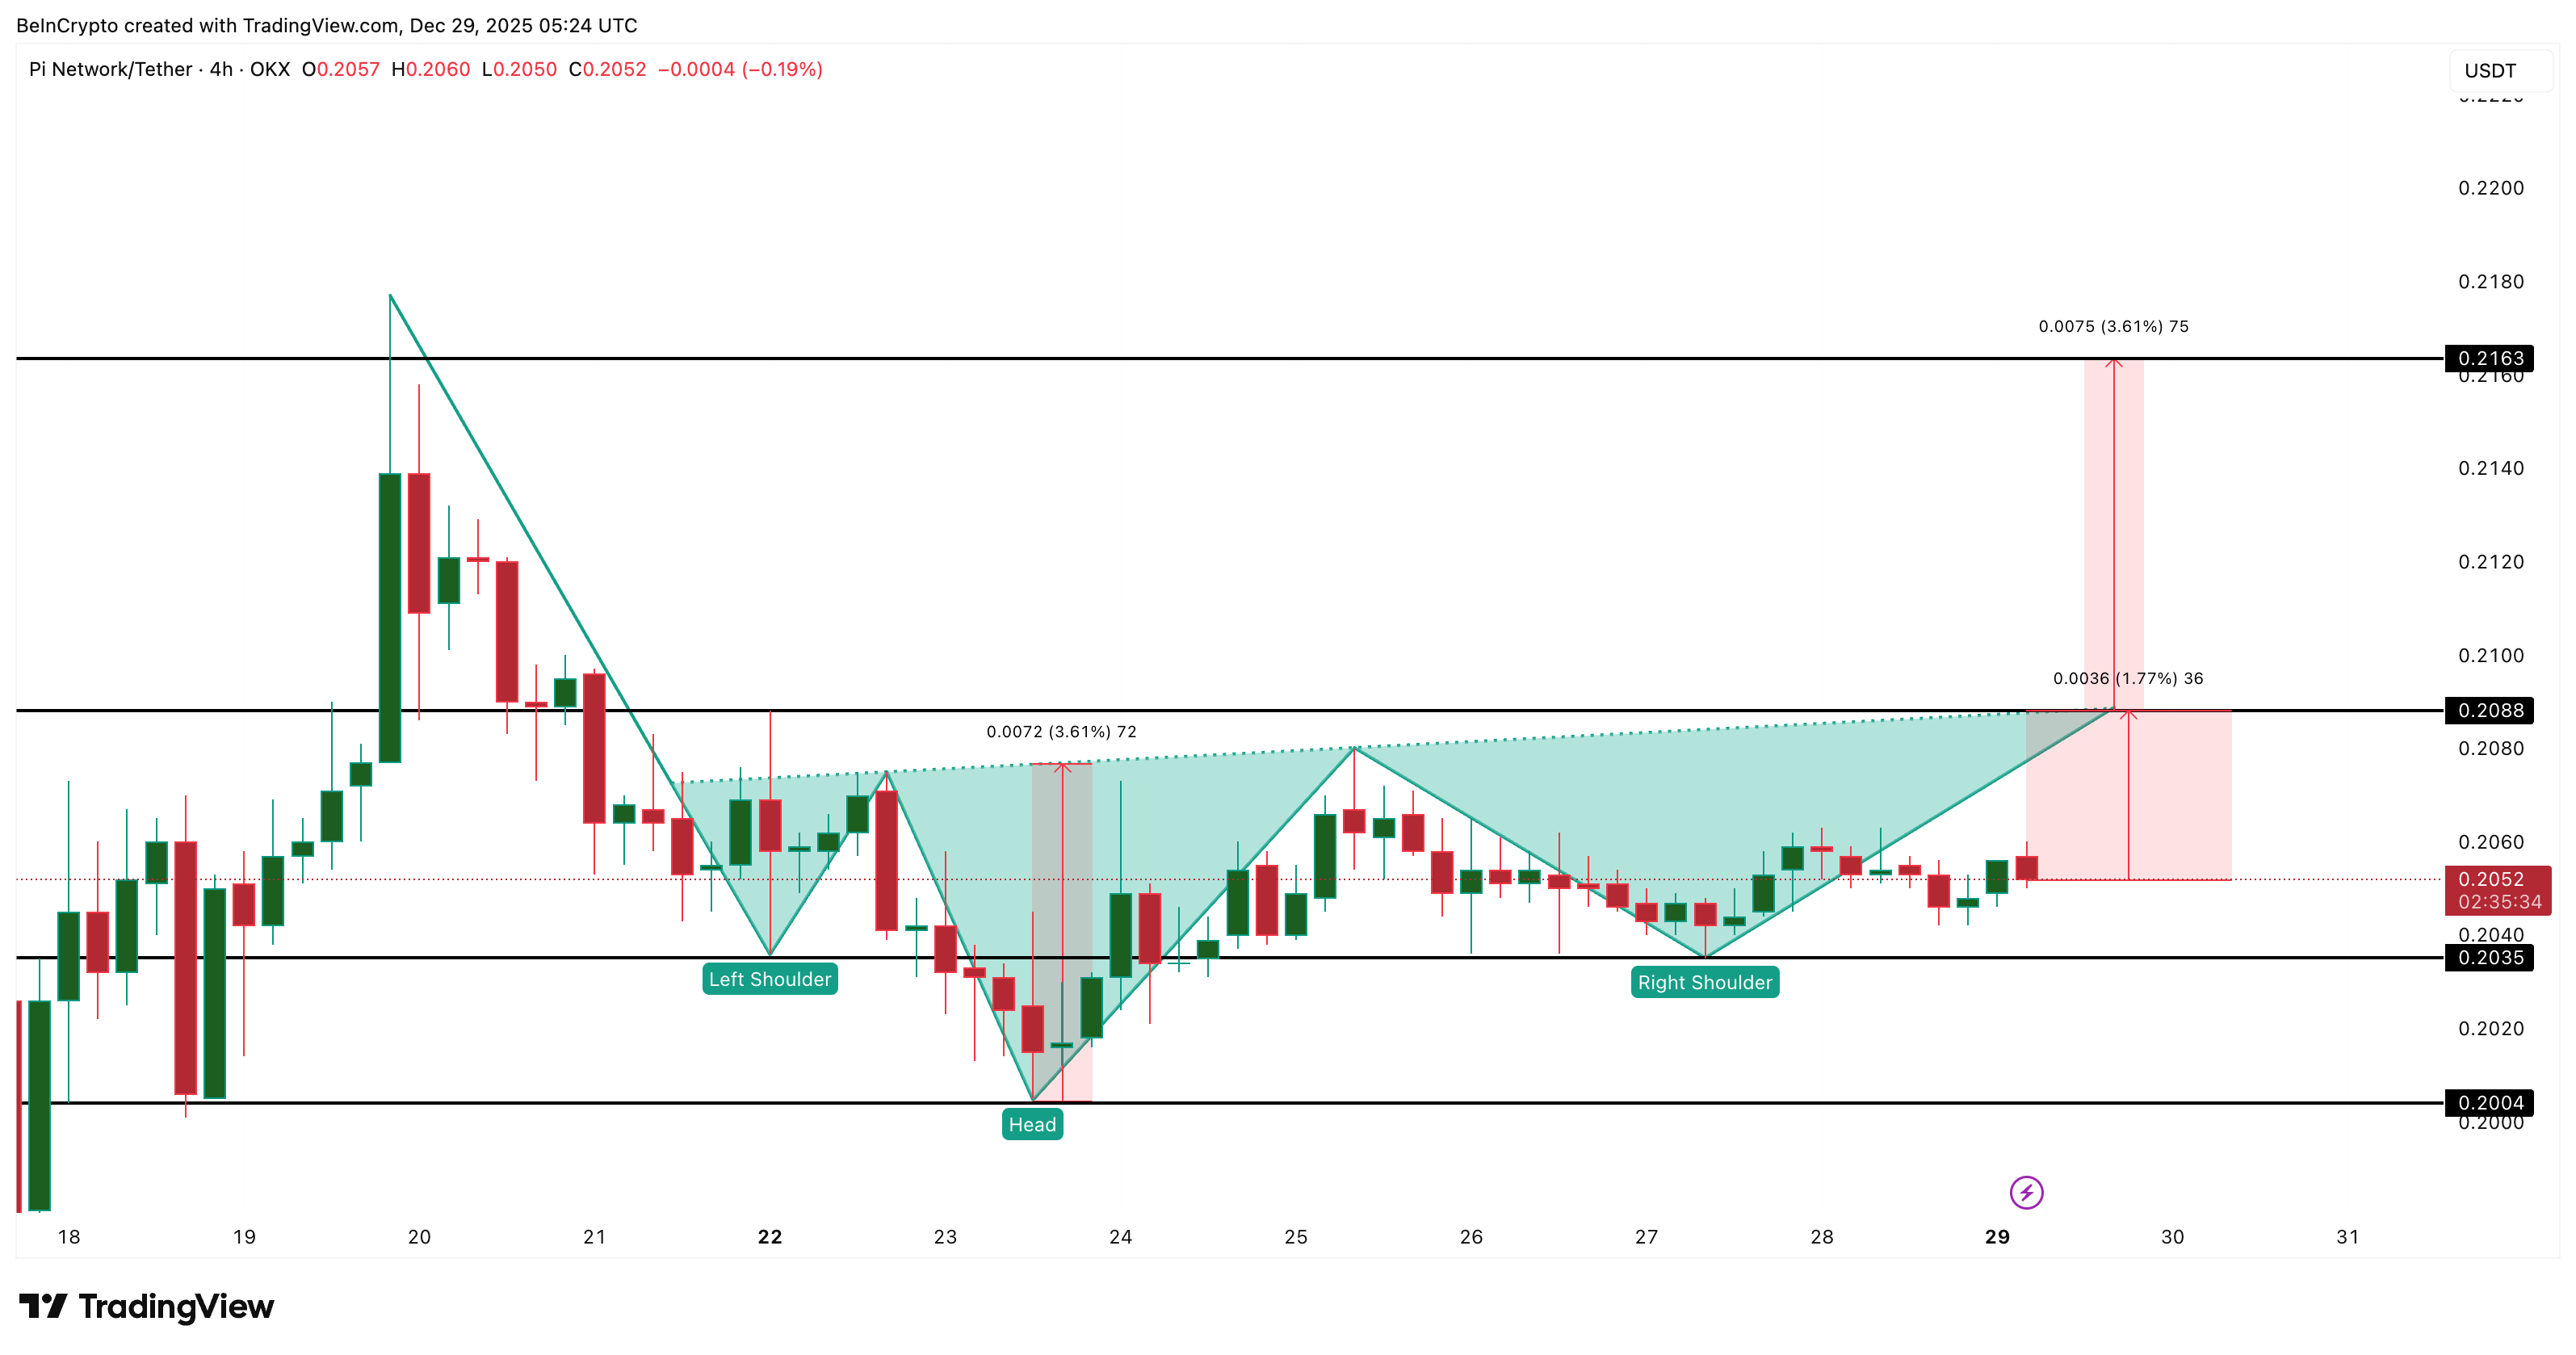
On the four-hour chart, PI is attempting to form an inverse head-and-shoulders pattern, a structure that often appears near potential bottoms. The neckline sits near $0.208. A four-hour close above that level opens room toward $0.216, a mere 3.5% rise. But that probable breakout is only the first step.
Support sits at $0.203. Losing that weakens the pattern. Below $0.200, the short-term setup fails, and momentum turns back to the downside.
Want more token insights like this? Sign up for Editor Harsh Notariya’s Daily Crypto Newsletter here.
There is a reason this breakout attempt matters. The Chaikin Money Flow (CMF), which tracks capital flow through price and volume, has finally broken its descending trendline. If CMF can hold above zero on the four-hour chart, it supports the idea that fresh demand is entering the market. If CMF falls back under zero, the breakout loses credibility.
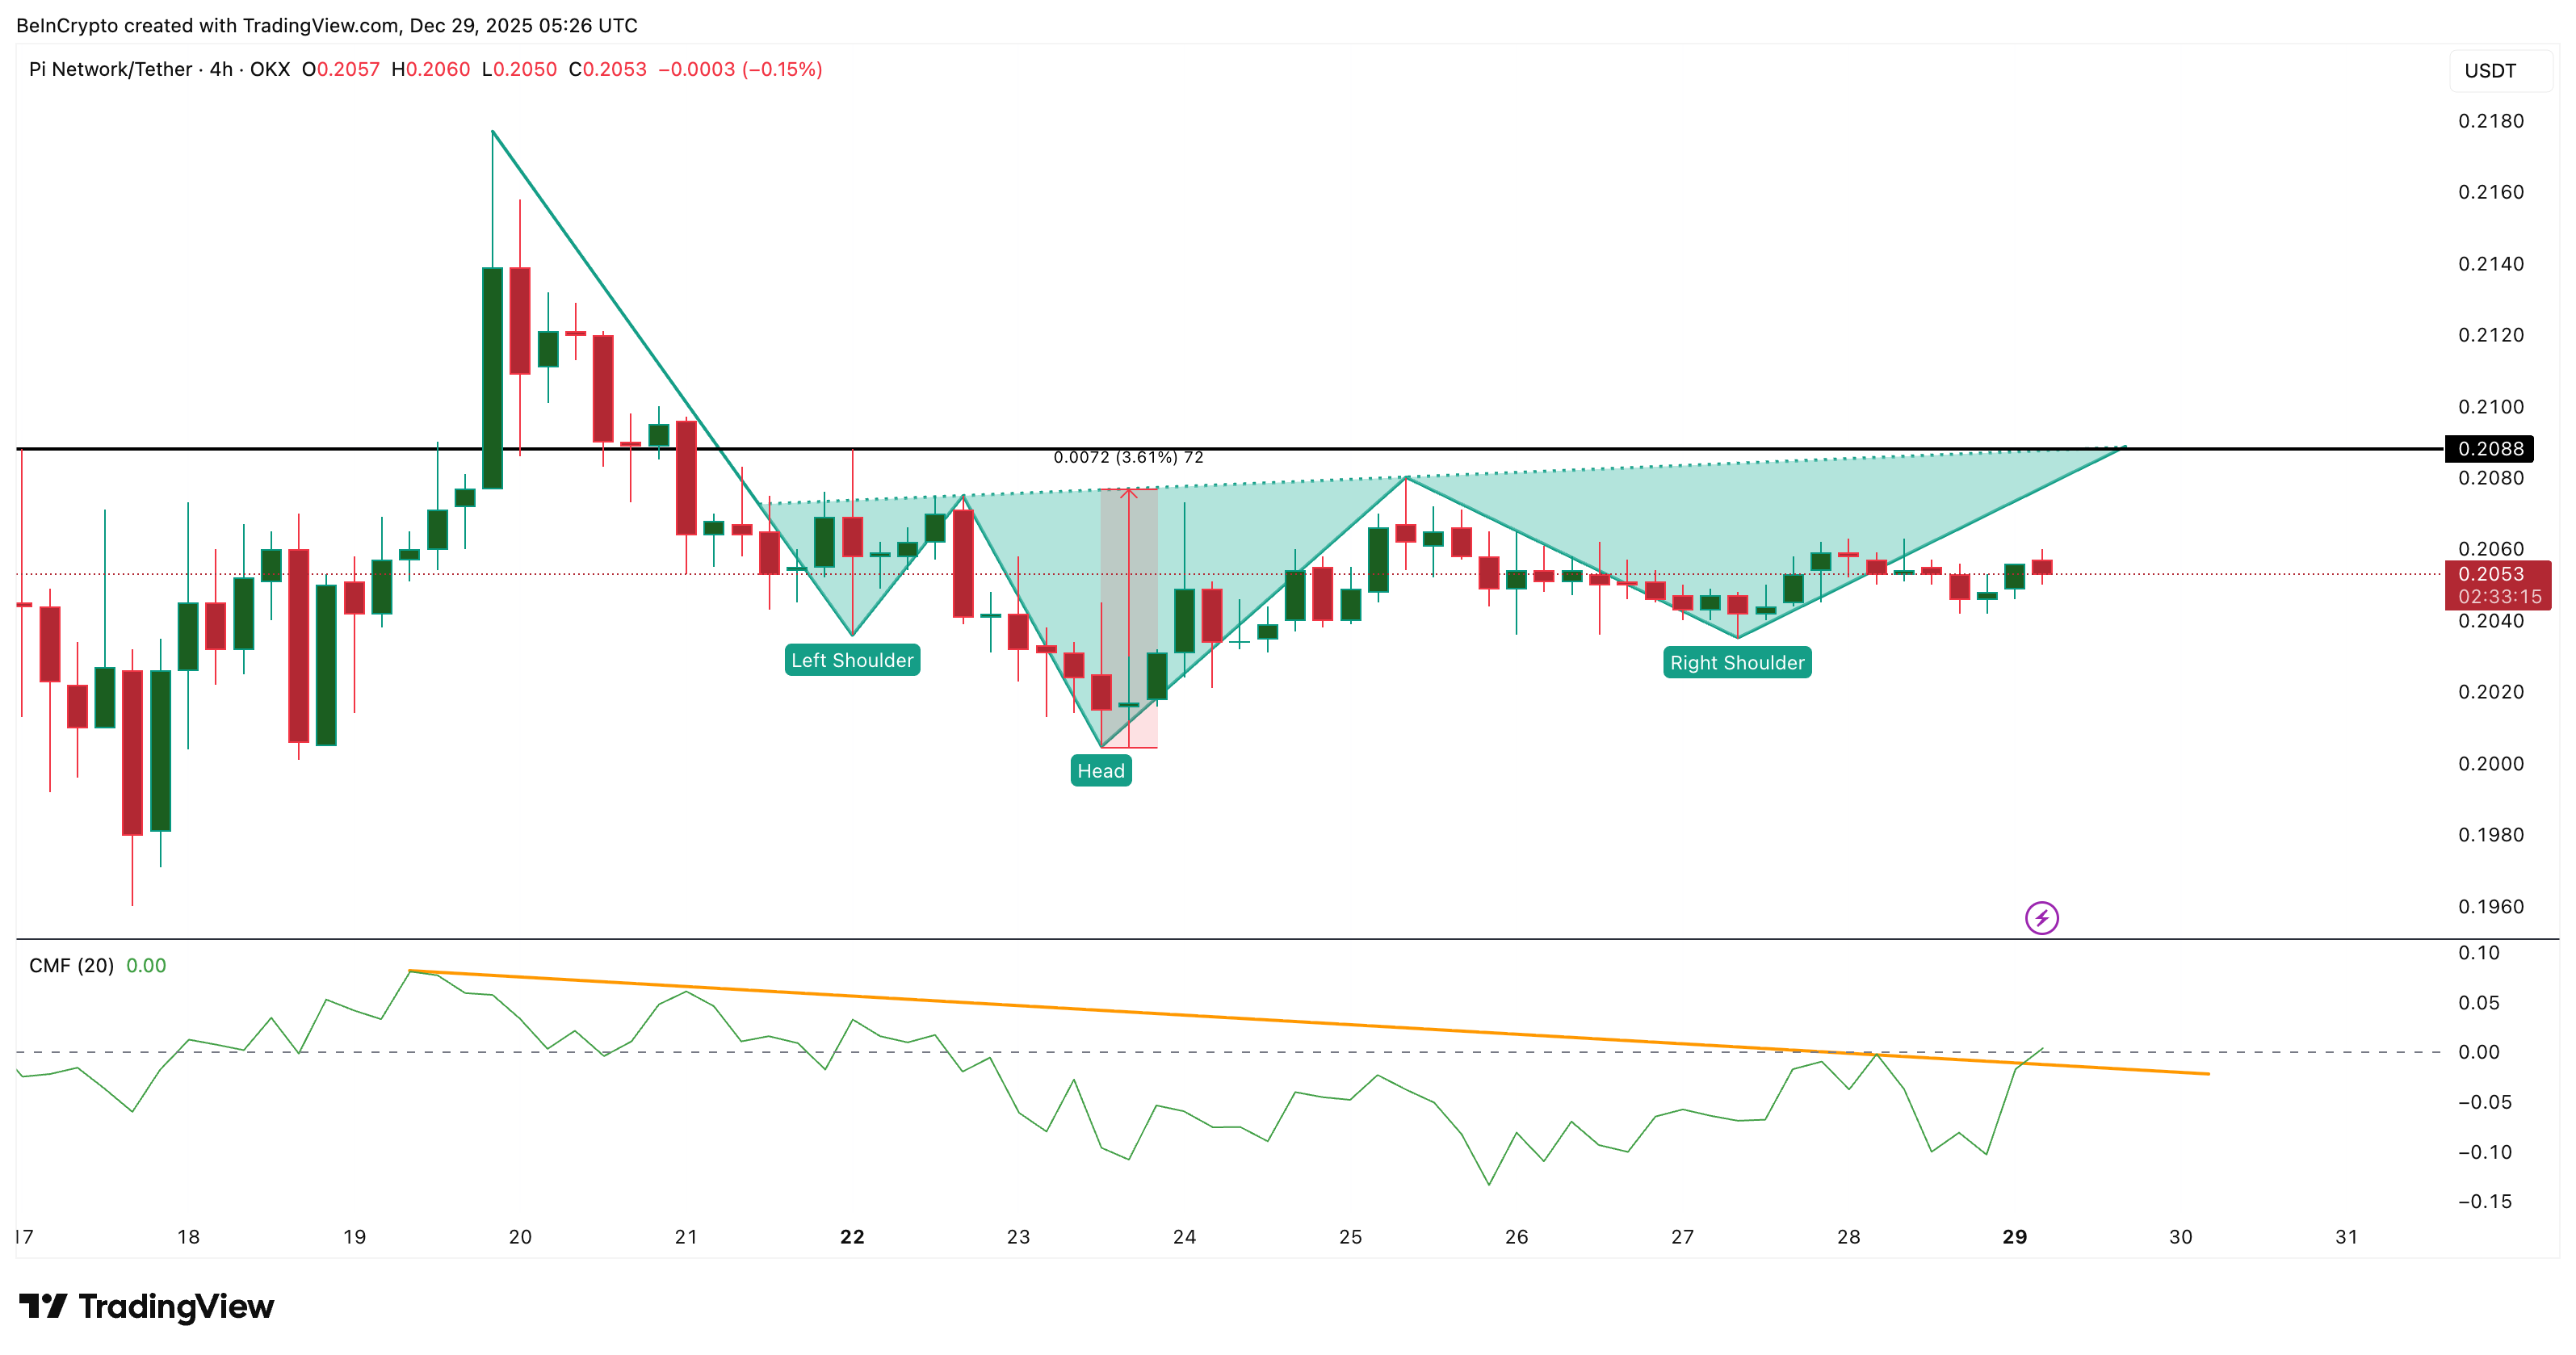
Right now, PI is in a trigger zone, not a confirmed recovery. For more insights on the breakout-led recovery theory, we need to check the daily chart indicators.
Dip Buying Shows Up on the Daily Chart, But Pi Coin Price Range Still Holds
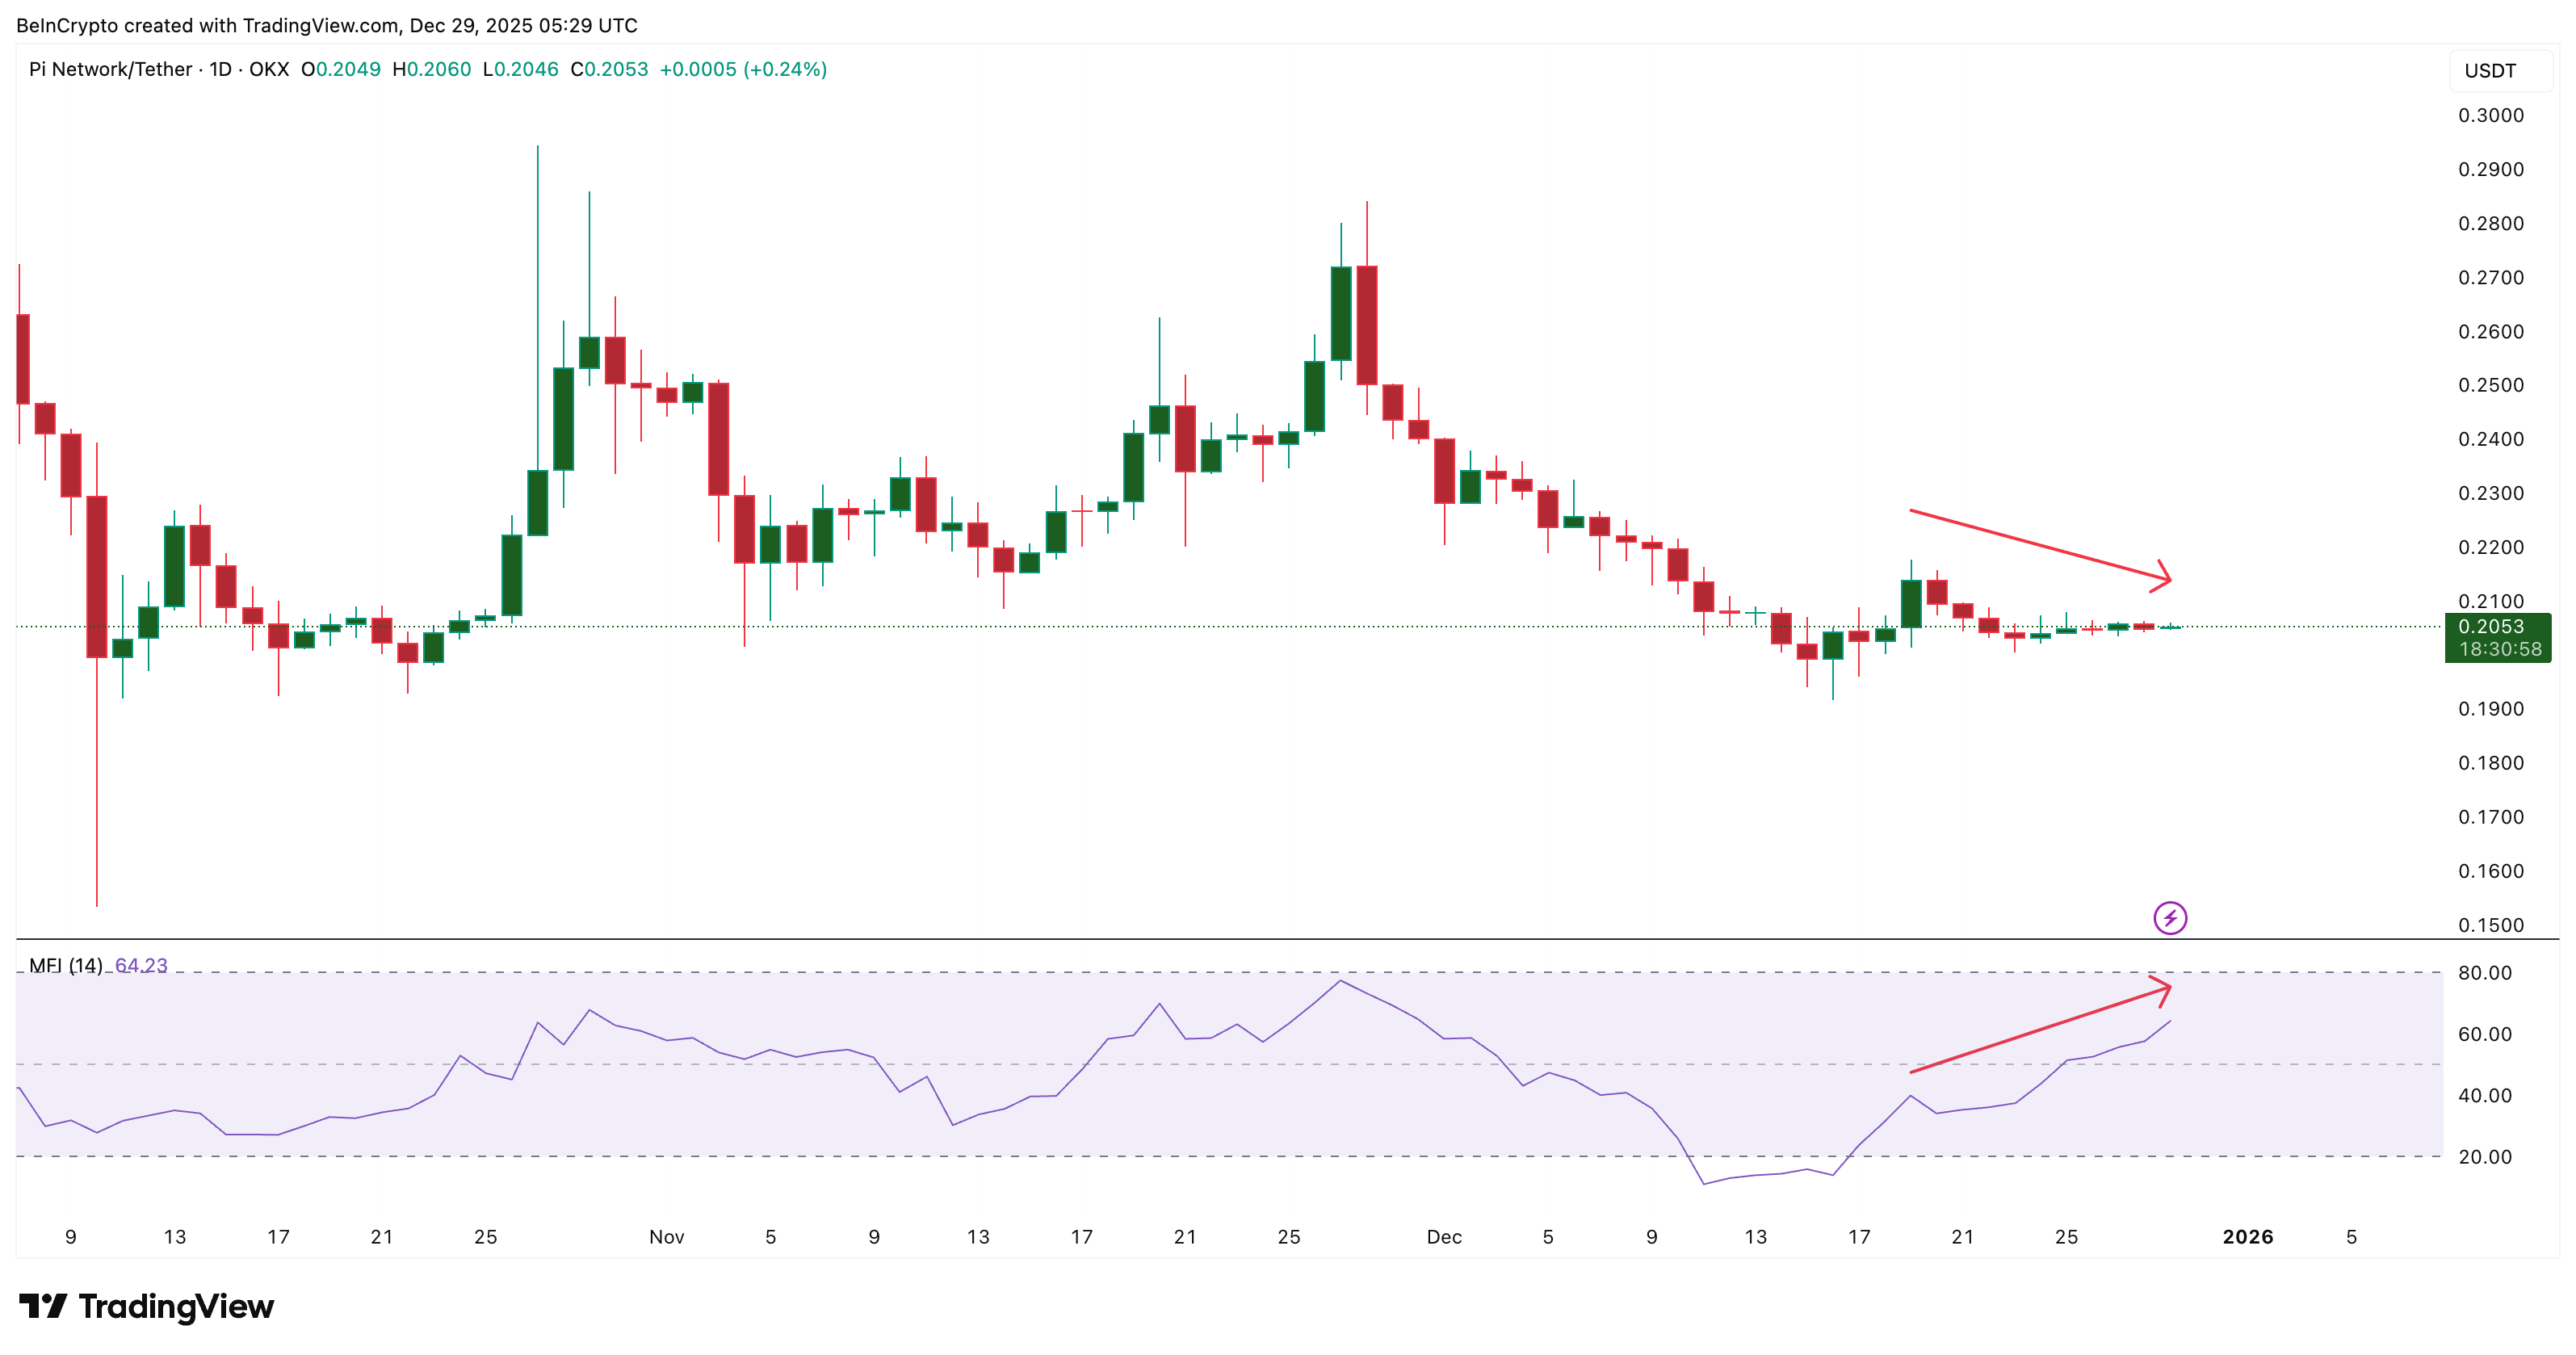
On the daily timeframe, the PI price backdrop is still neutral to bearish.
Between December 19 and December 29, PI price trended lower, while the Money Flow Index (MFI), a potential dip-buying metric, reached a higher high. This is a small bullish divergence, which suggests buyers are stepping in on dips. MFI is rising, which supports bounce attempts, but it does not confirm a trend change by itself.
The daily range is still defined by resistance at $0.213 and support at $0.191.
A daily move above $0.213 would be the first strong sign that buyers are ready to challenge the broader trend. That level matters more than the simple four-hour breakout because it overlaps with range resistance held since early December.
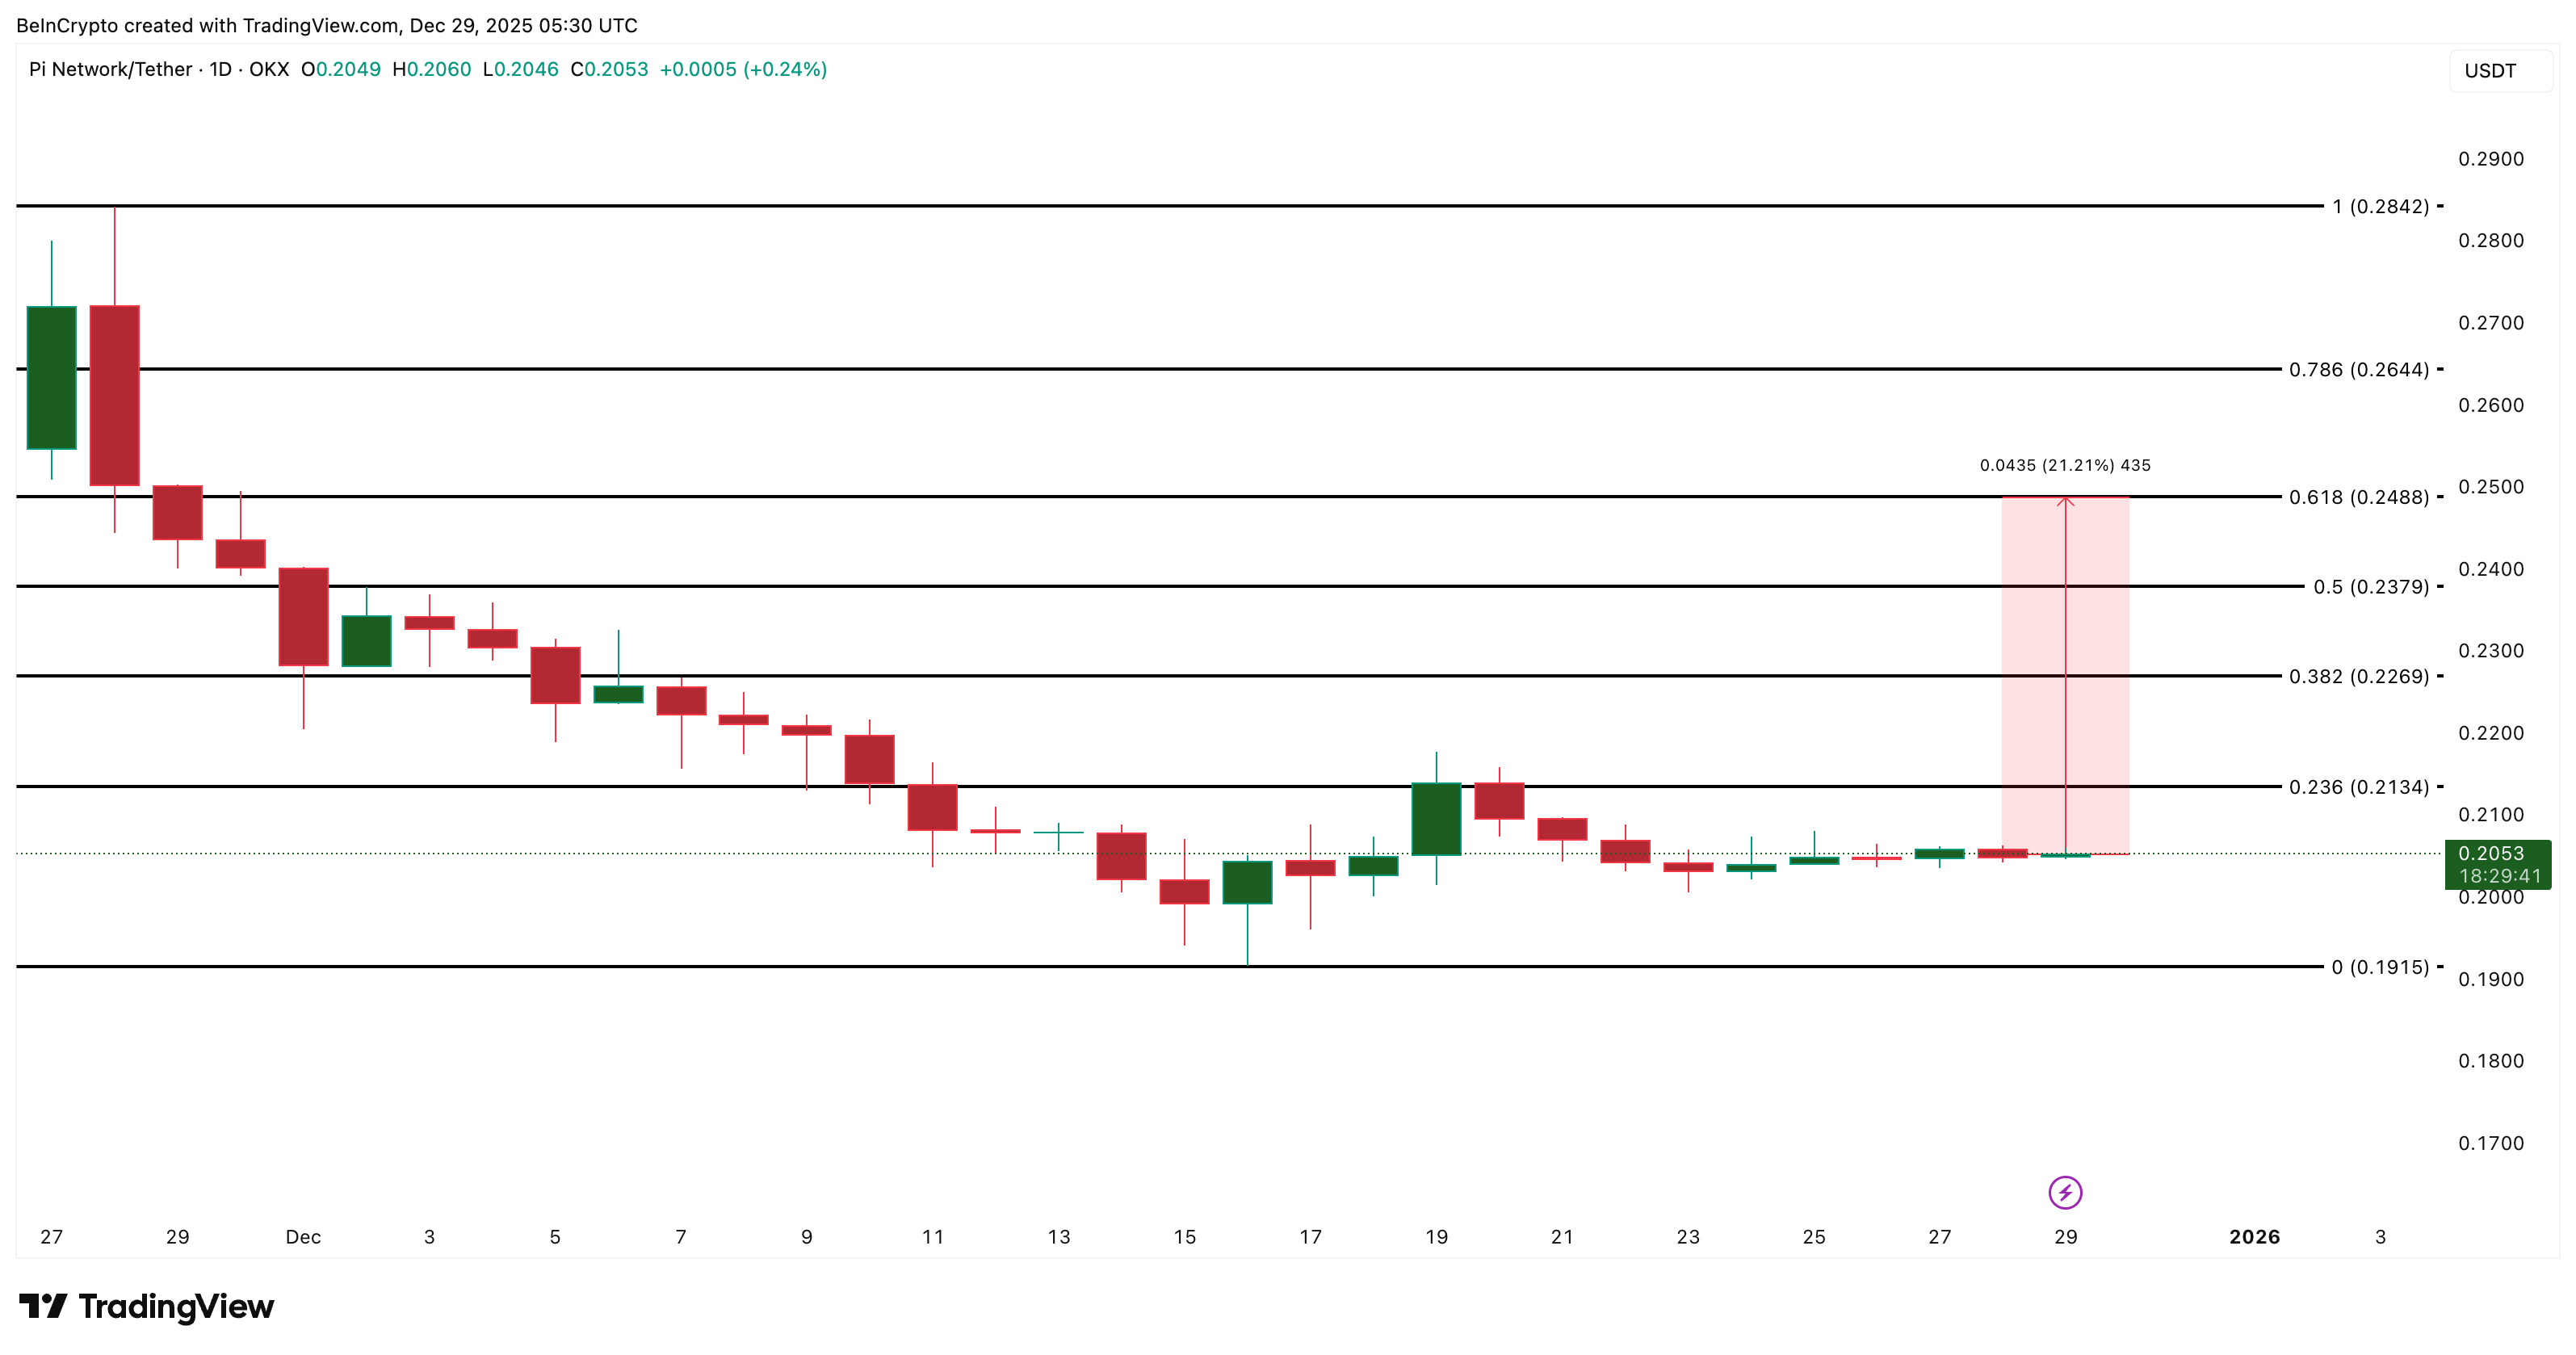
If PI clears $0.216 per the 4-hour breakout scenario, it would automatically speed past the first critical daily resistance level of $0.213. This makes $0.216 level (the breakout target per 4-hour chart) the most critical one in the short term.
It can then attempt a move toward $0.248, a level it has failed to reclaim since November 29. That is where bullish momentum starts to mean something.
Below $0.191, all setups break down (even the 4-hour breakout setup), and the market resets to bearish control.
The post Pi Coin Price Breakout Alone Won’t Turn It Bullish — This Level Matters More appeared first on BeInCrypto.