
Mantle’s native token, MNT, is today’s top gainer. Its value has climbed 4% in the past 24 hours, extending a strong weekly rally that has seen its price surge nearly 30% over the last seven days.
The rally comes as the network’s stablecoin supply climbs, signaling an influx of liquidity into the Mantle ecosystem.
Stablecoin Inflow and Bullish Indicators Signal More Upside
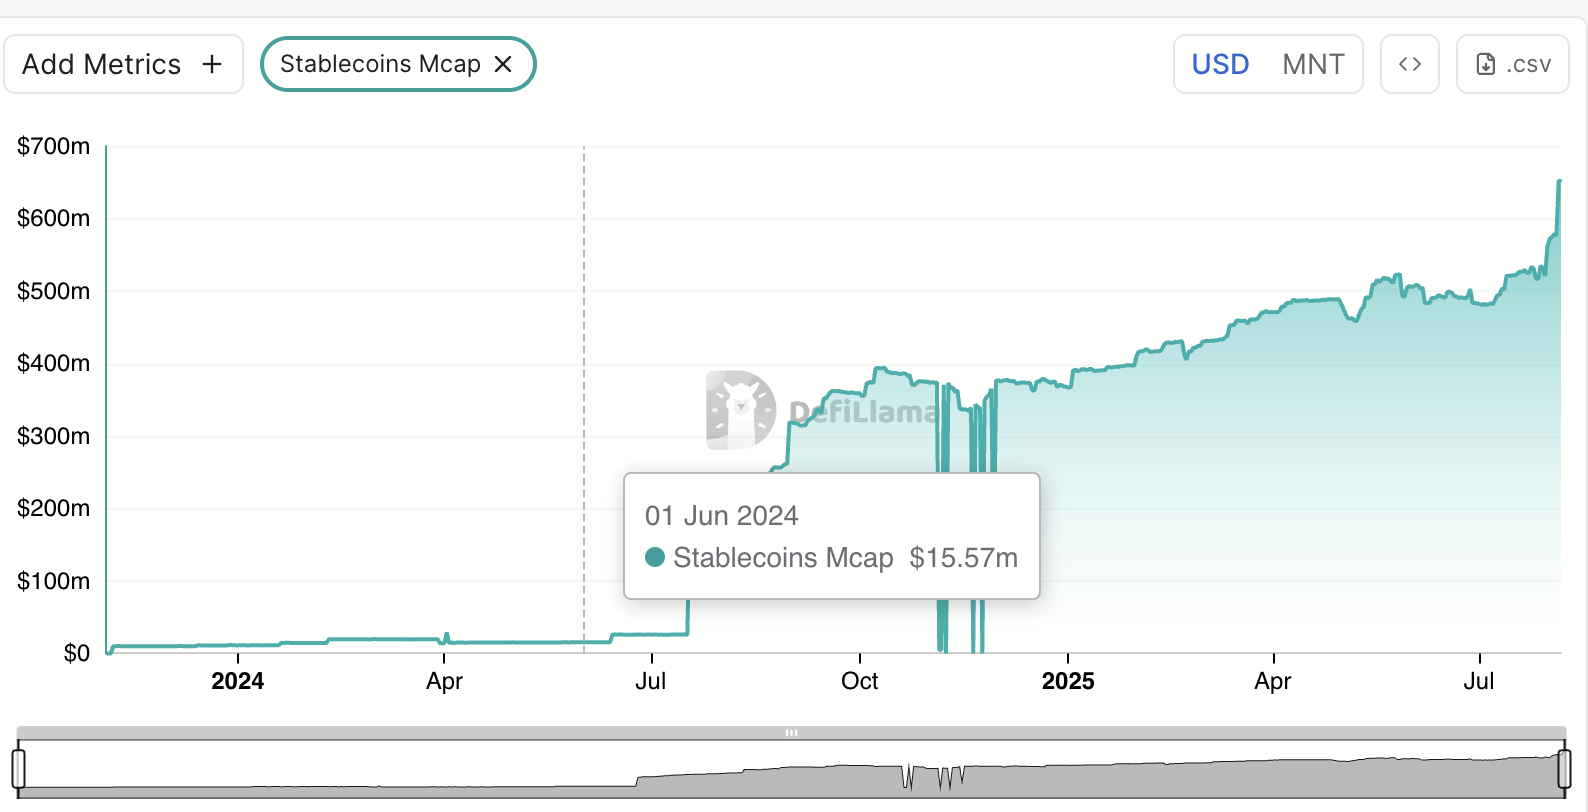
Over the past week, liquidity inflow into the Mantle network has soared. According to data from DeFiLlama, the network’s stablecoin market capitalization has risen by 23% in the past seven days, reaching an all-time high of $654 million on Tuesday.
For token TA and market updates: Want more token insights like this? Sign up for Editor Harsh Notariya’s Daily Crypto Newsletter here.
Higher stablecoin liquidity means traders have more immediate buying power. When market sentiment is positive, this can amplify demand and drive an asset’s price momentum.
This has been the case for MNT, whose seven-day price rally has been driven by the surge in liquidity on the network amid the broader market’s lackluster performance.
Readings from the MNT/USD daily chart paint an equally optimistic picture. For example, MNT’s Directional Movement Index shows its positive directional index (blue; +DI) resting above the negative directional index (orange; -DI) at press time, highlighting the strength of the buy-side pressure.
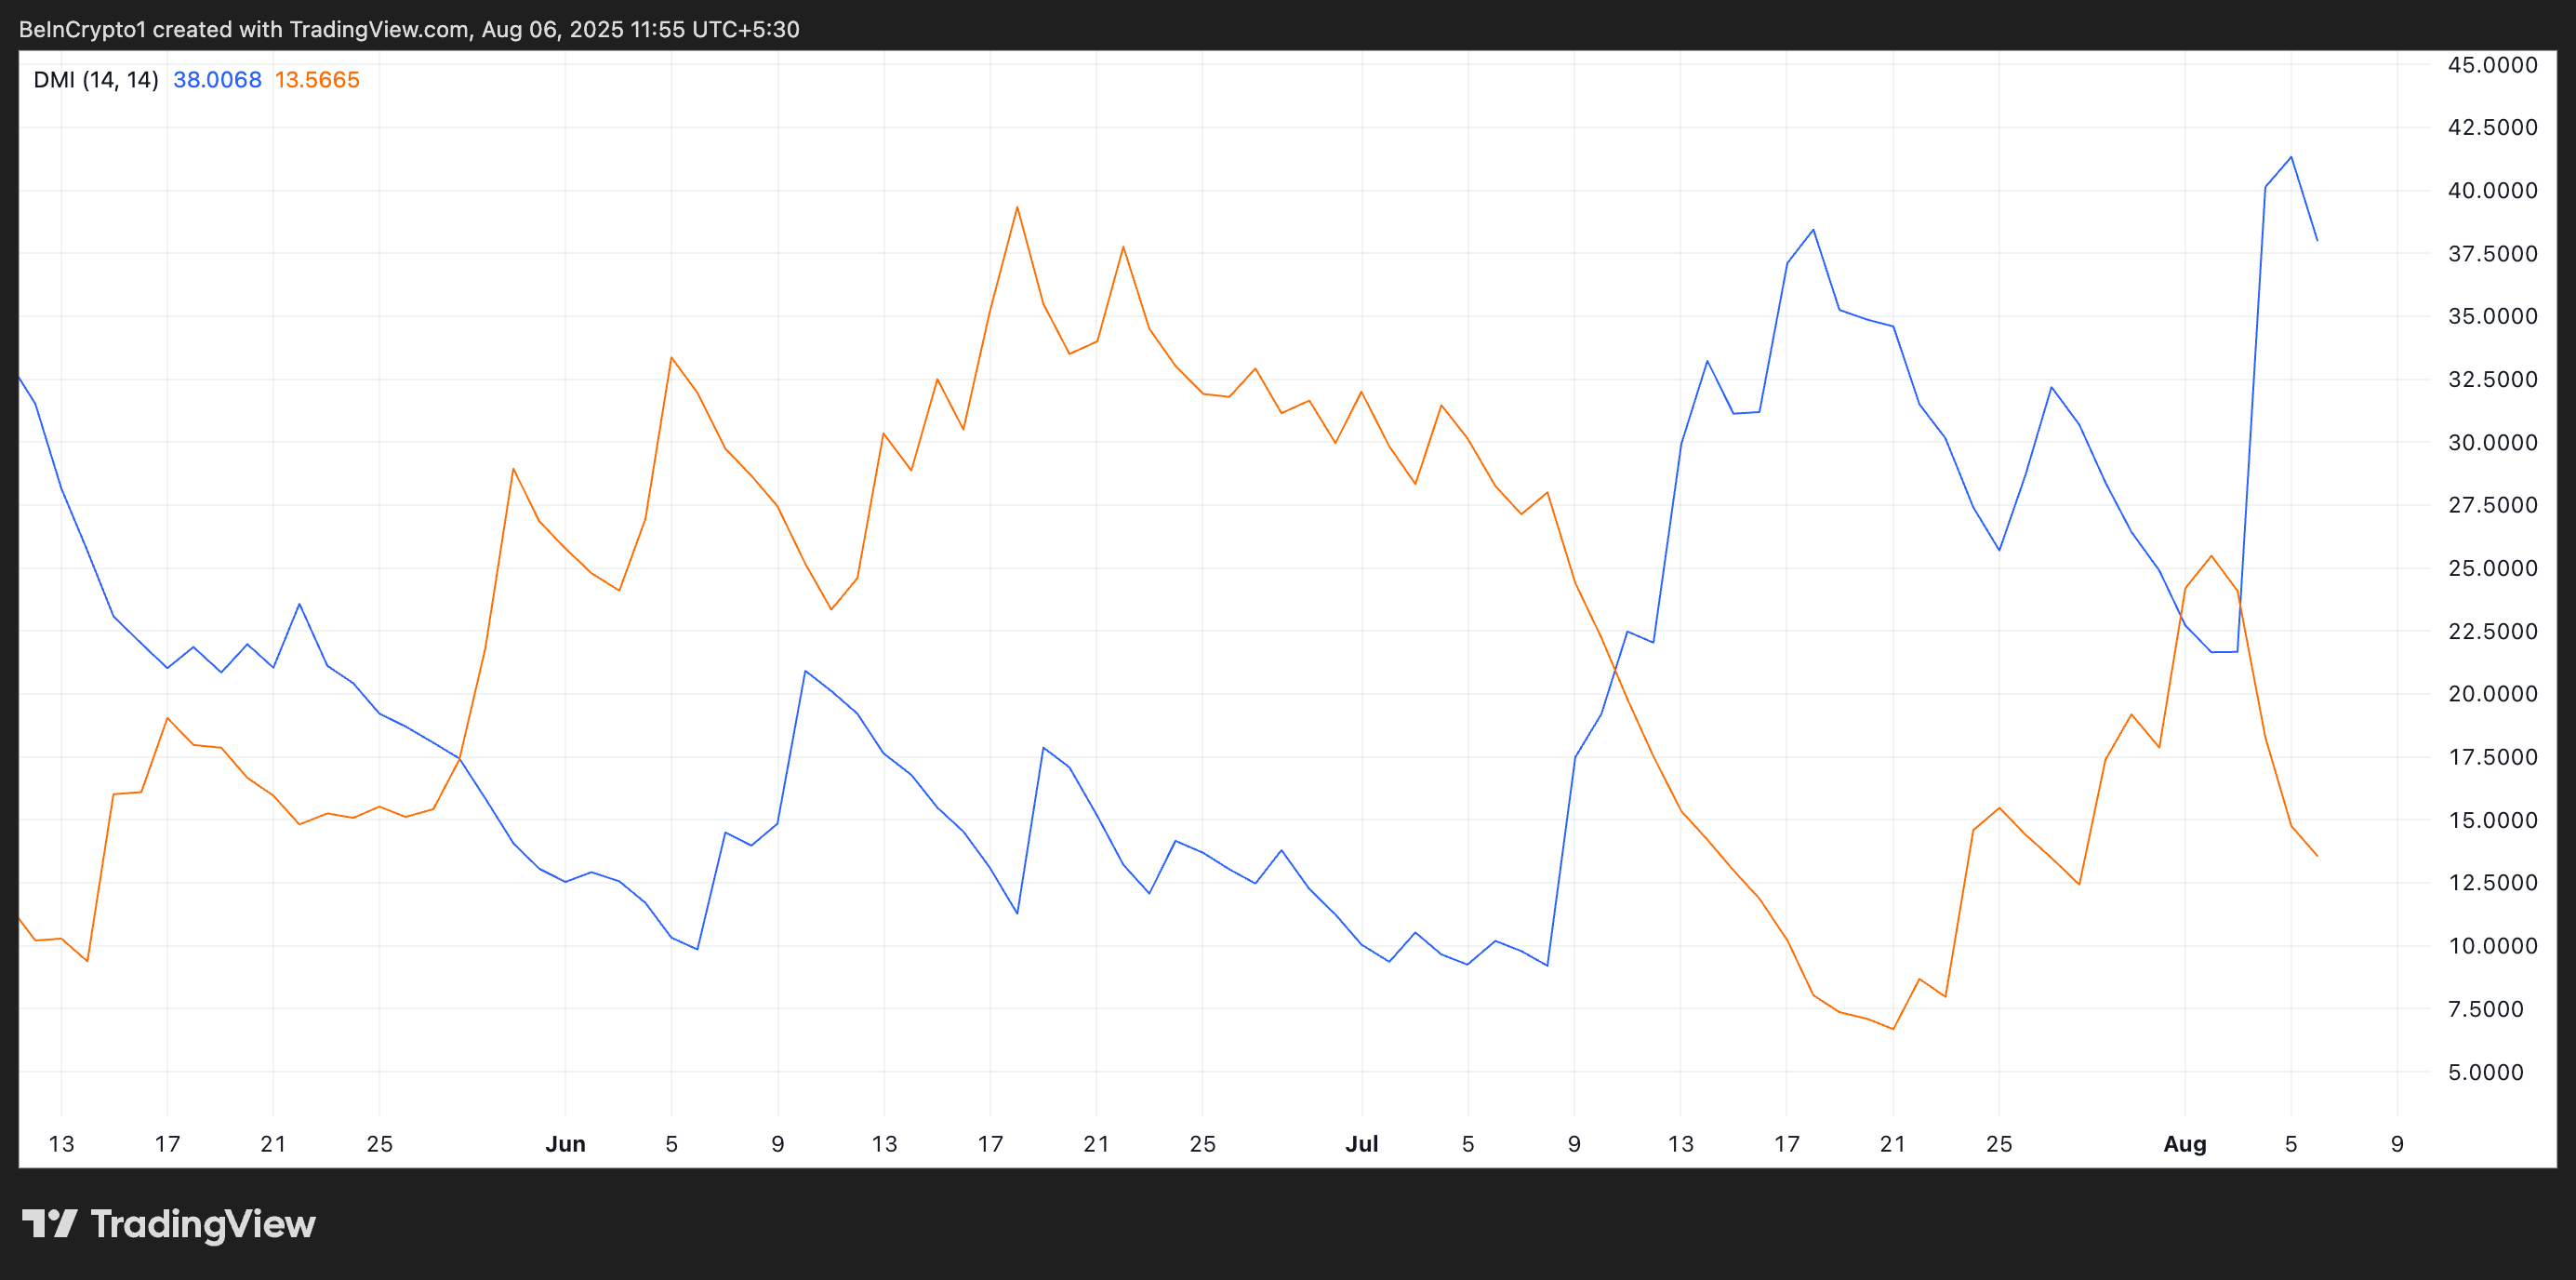
The DMI indicator gauges the strength and direction of a trend by analyzing recent highs and lows.
MNT’s DMI setup indicates that buying pressure outpaces selling activity, keeping the current uptrend intact. As long as the +DI stays above the -DI and the gap between them widens or holds steady, the bullish momentum behind MNT’s rally will likely persist.
Furthermore, MNT’s Aroon Up indicator, which currently reads 92.86%, supports this bullish outlook. The Aroon indicator is a technical analysis tool used to identify trend direction and strength by measuring the time elapsed since the most recent highs or lows.
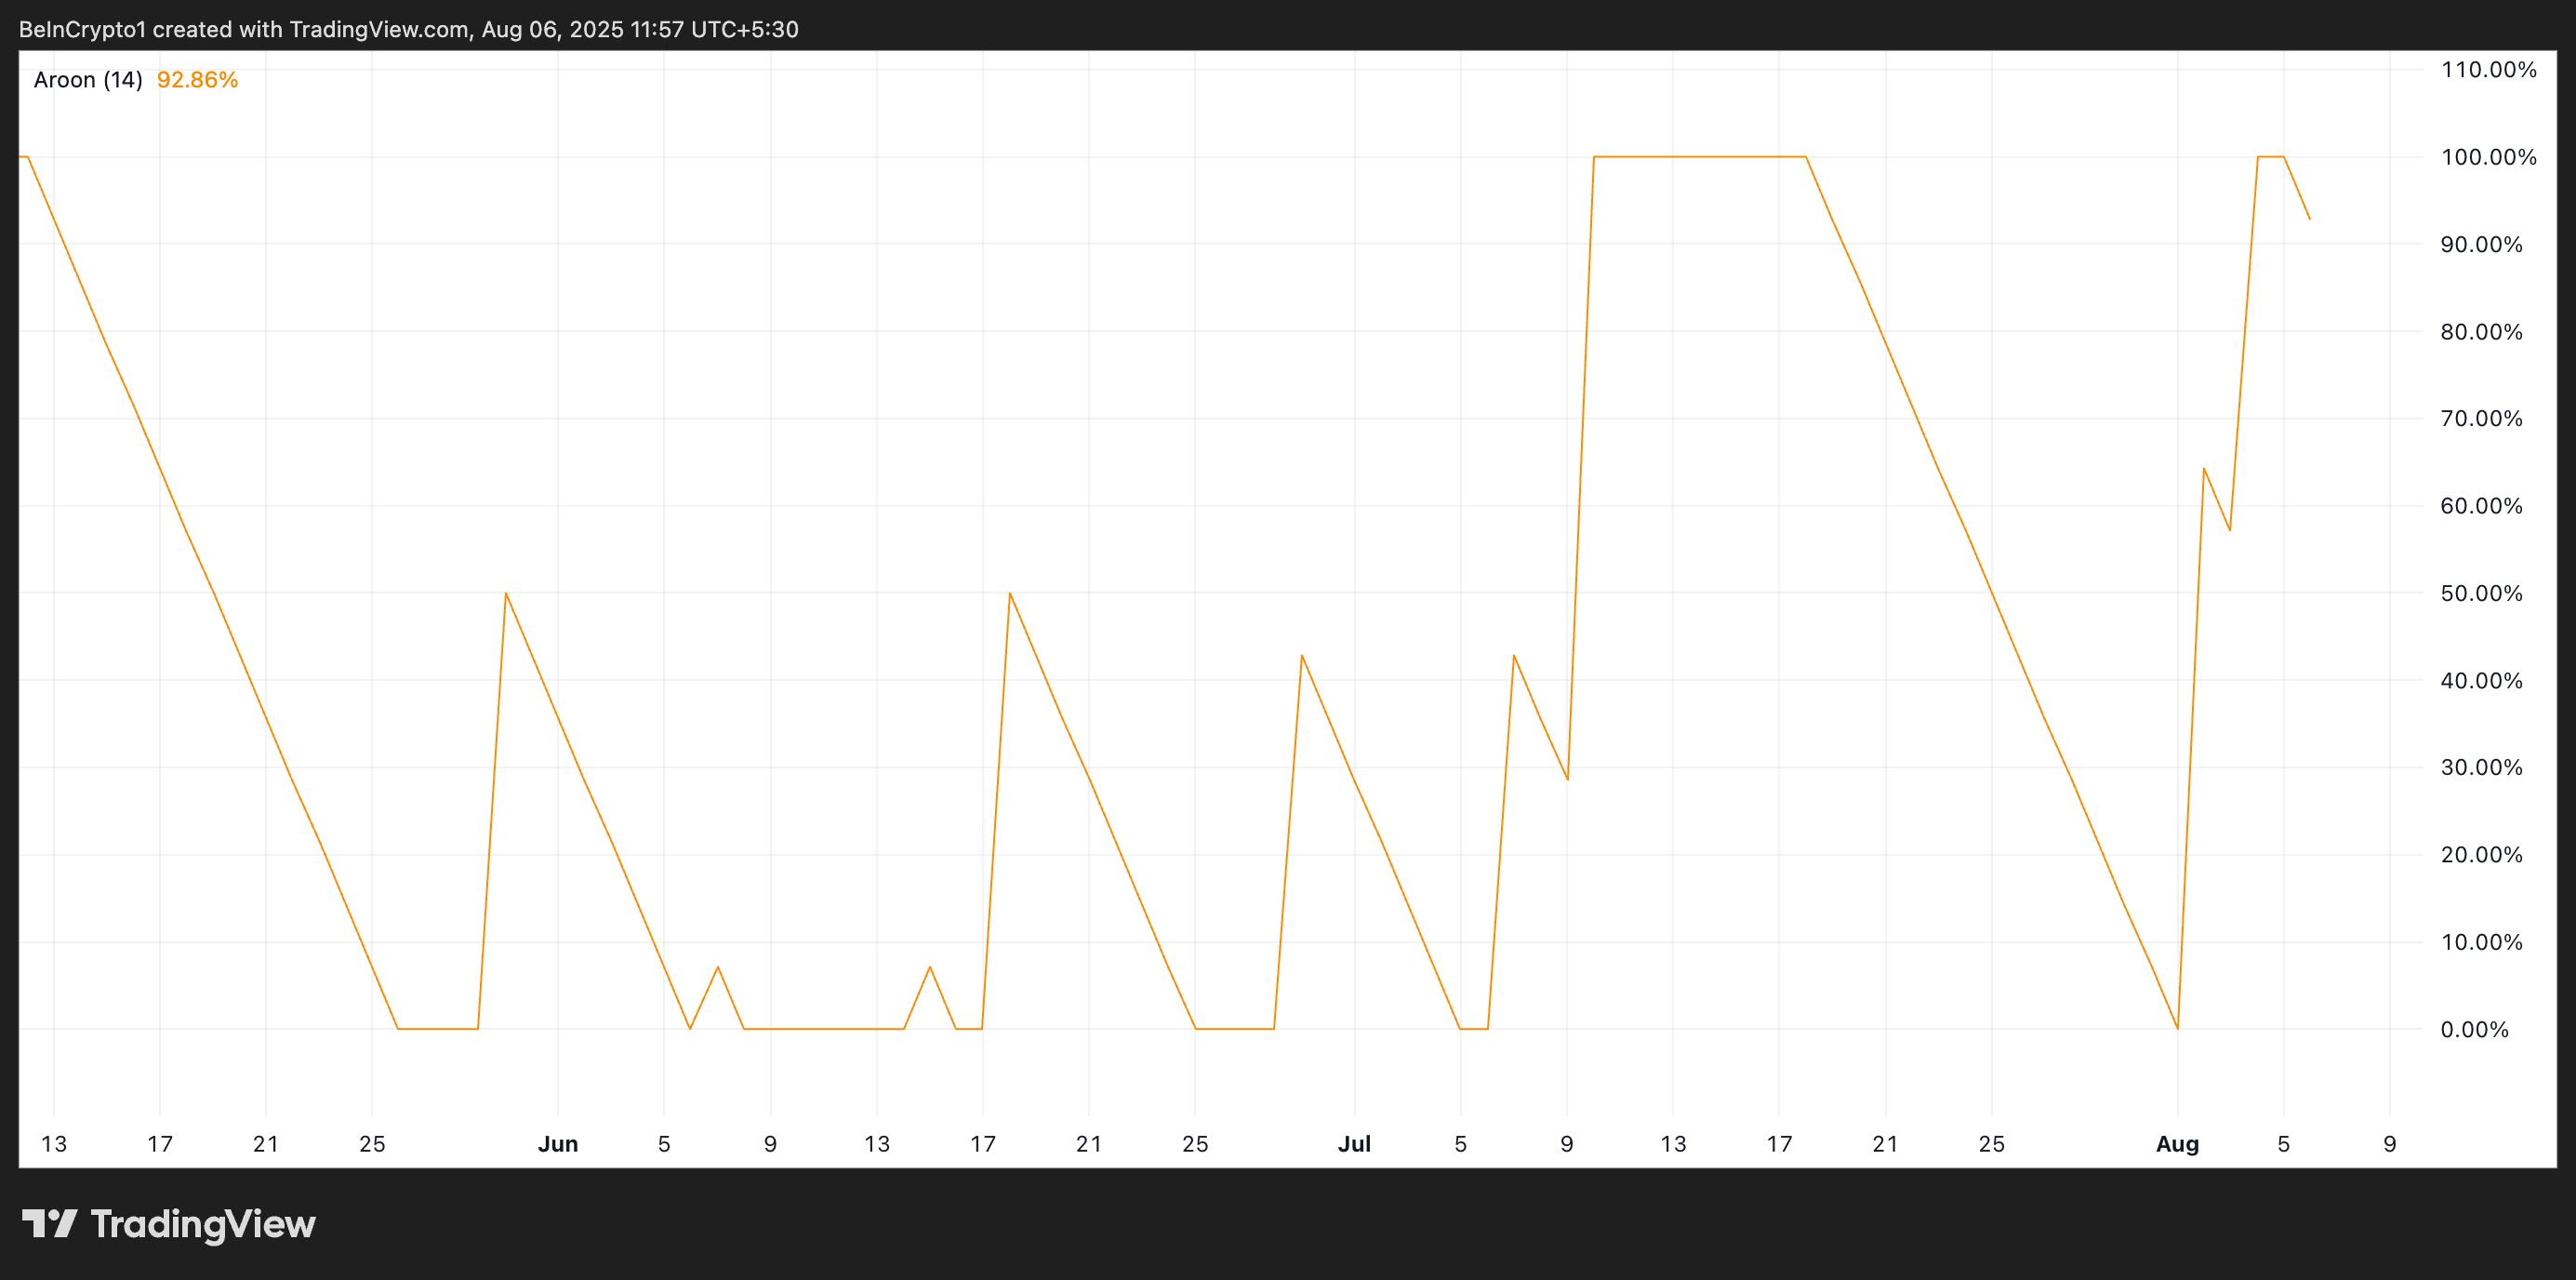
When the Aroon Up line is at or close to 100%, it suggests that recent price action has consistently hit new highs, indicating strong bullish momentum. This is true of MNT, whose price has rocketed to a five-month high over the past three days.
MNT Battles to Cement $0.86 as Rally Base
MNT’s 4% uptick has pushed its price above the key resistance at $0.86. MNT could extend its rally to $0.99 if this level strengthens as a support floor.
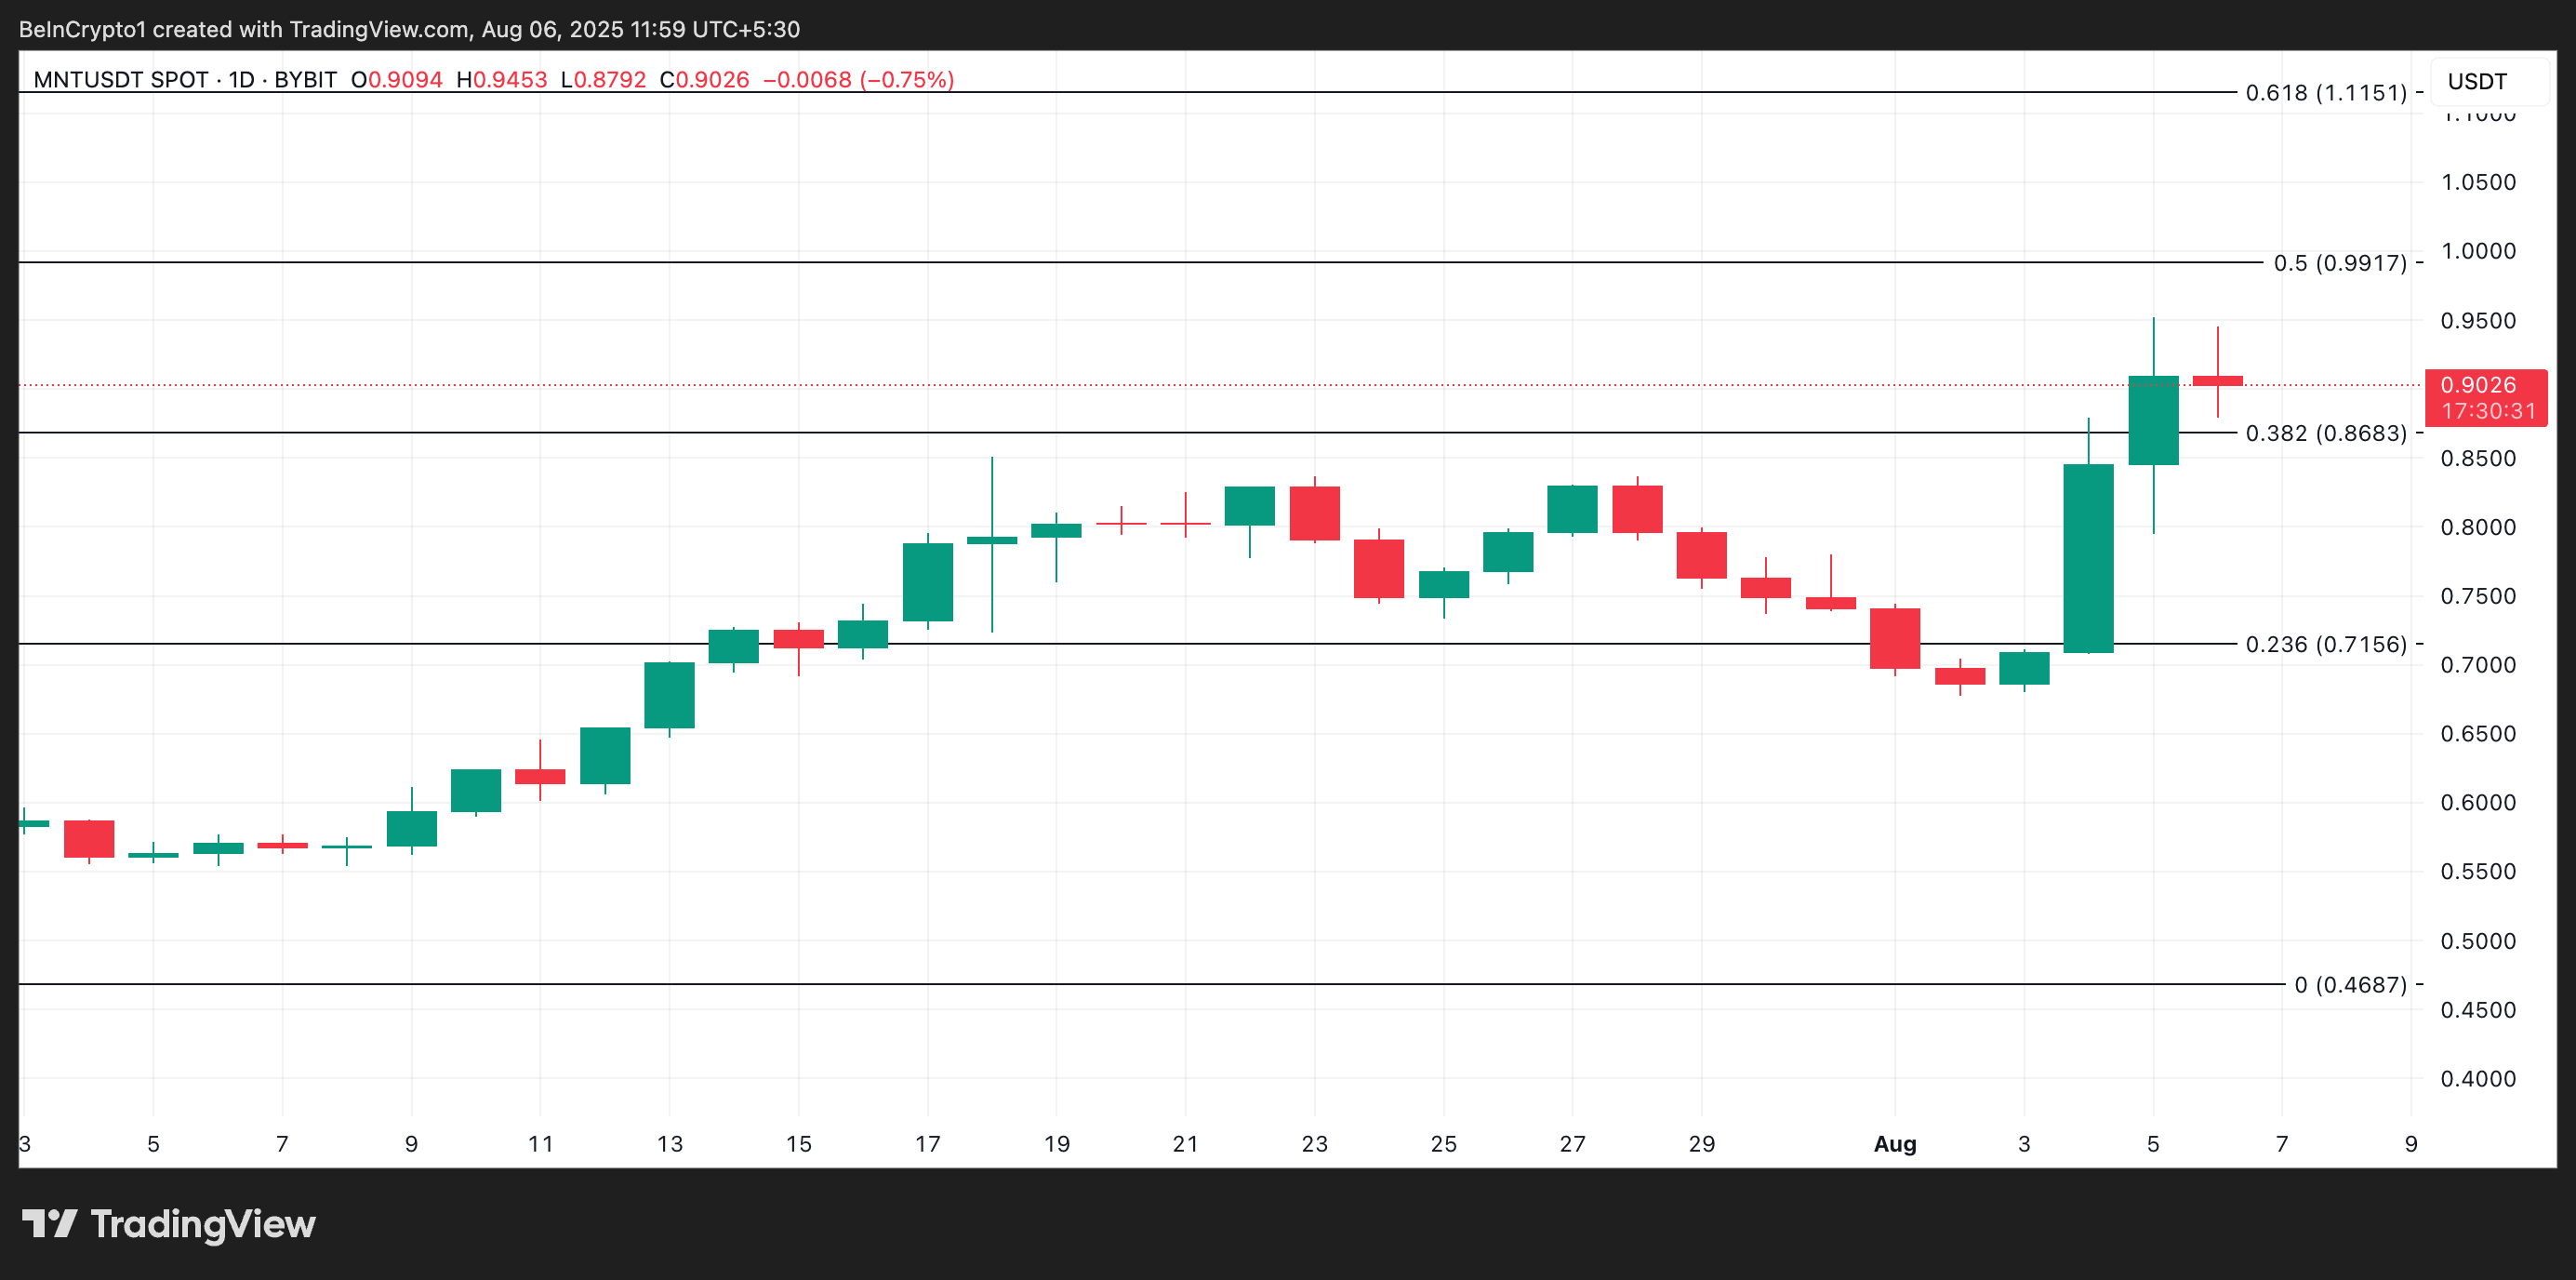
On the other hand, if profit-taking resumes, MNT could lose strength and attempt to test the new $0.86 support. Should it fail to hold, the token’s price could fall to $0.71.
The post MNT Explodes as Stablecoin Liquidity Hits All-Time High on Mantle appeared first on BeInCrypto.