Hyperliquid (HYPE) price trades near $38 after surging roughly 70% from late February to a peak of $43 on March 18, and the consolidation that followed appears to be forming a bull flag on the daily chart.
Meanwhile, data from BeInCrypto’s Dune dashboard shows Hyperliquid is the only major perpetual DEX to grow its market share in 2026. That fundamental strength has not yet translated into a breakout, but spot buyers and derivatives positioning suggest the consolidation may not last much longer.
The Only Perp DEX Growing Its Share, and Spot Buyers Notice
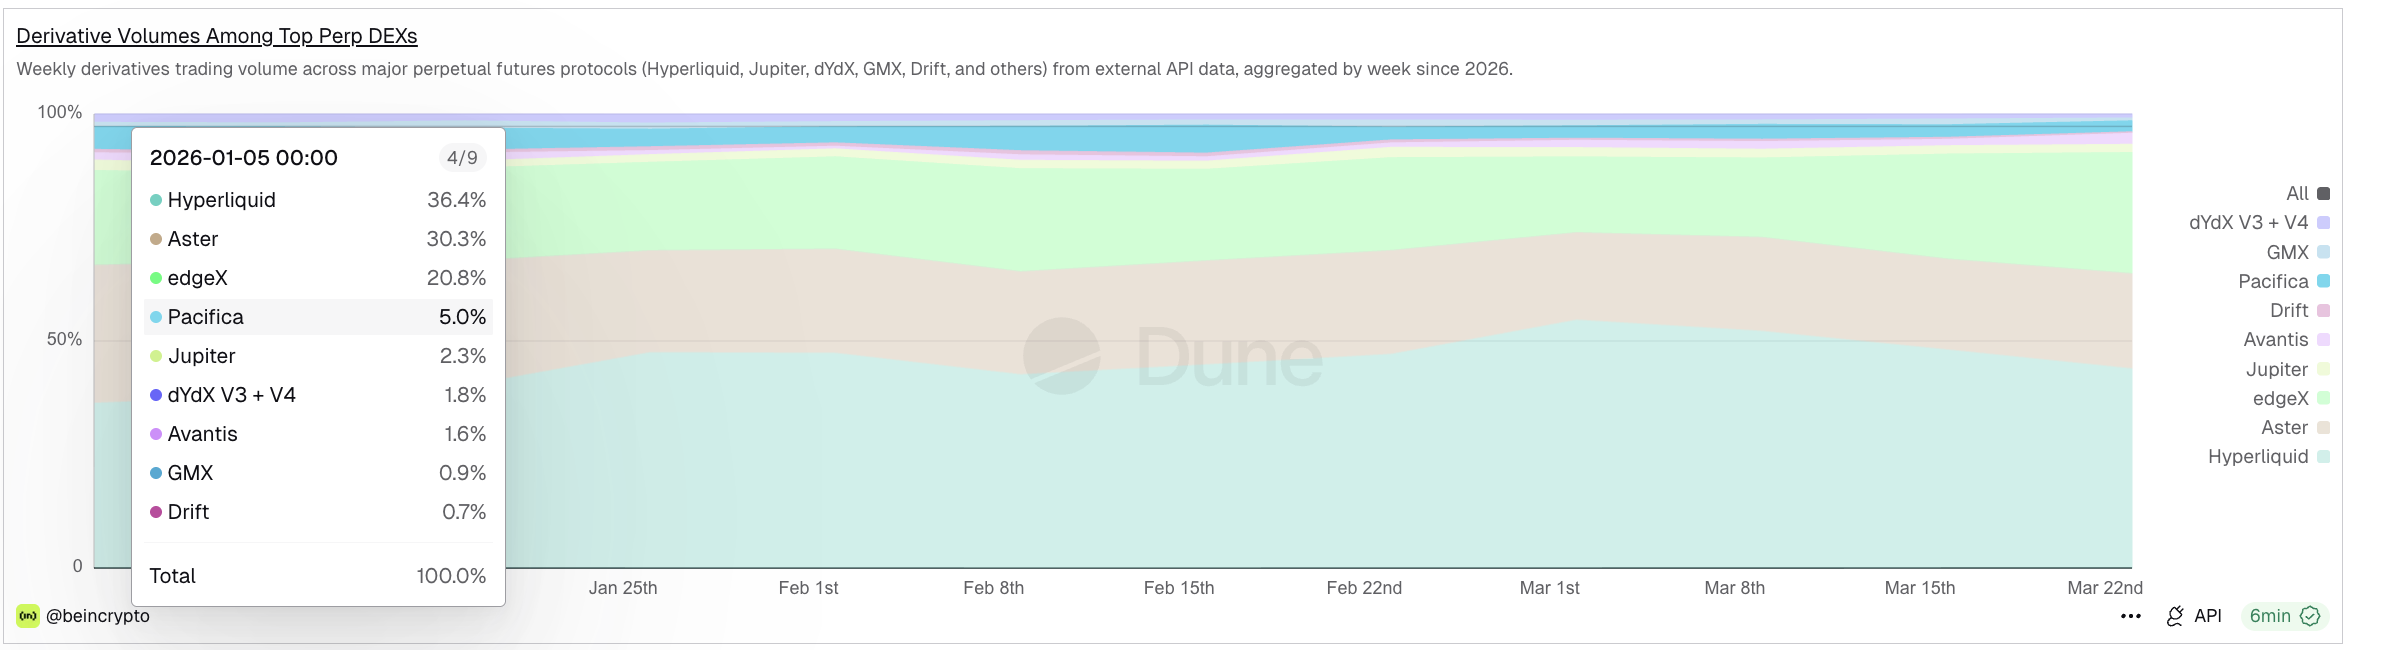
Hyperliquid’s share of weekly derivatives volume among top perpetual DEX protocols climbed from 36.4% in the week of January 5 to 44% in the week ending March 23, according to BeInCrypto’s Dune dashboard. That is a roughly 21% increase in market share since the start of the year.
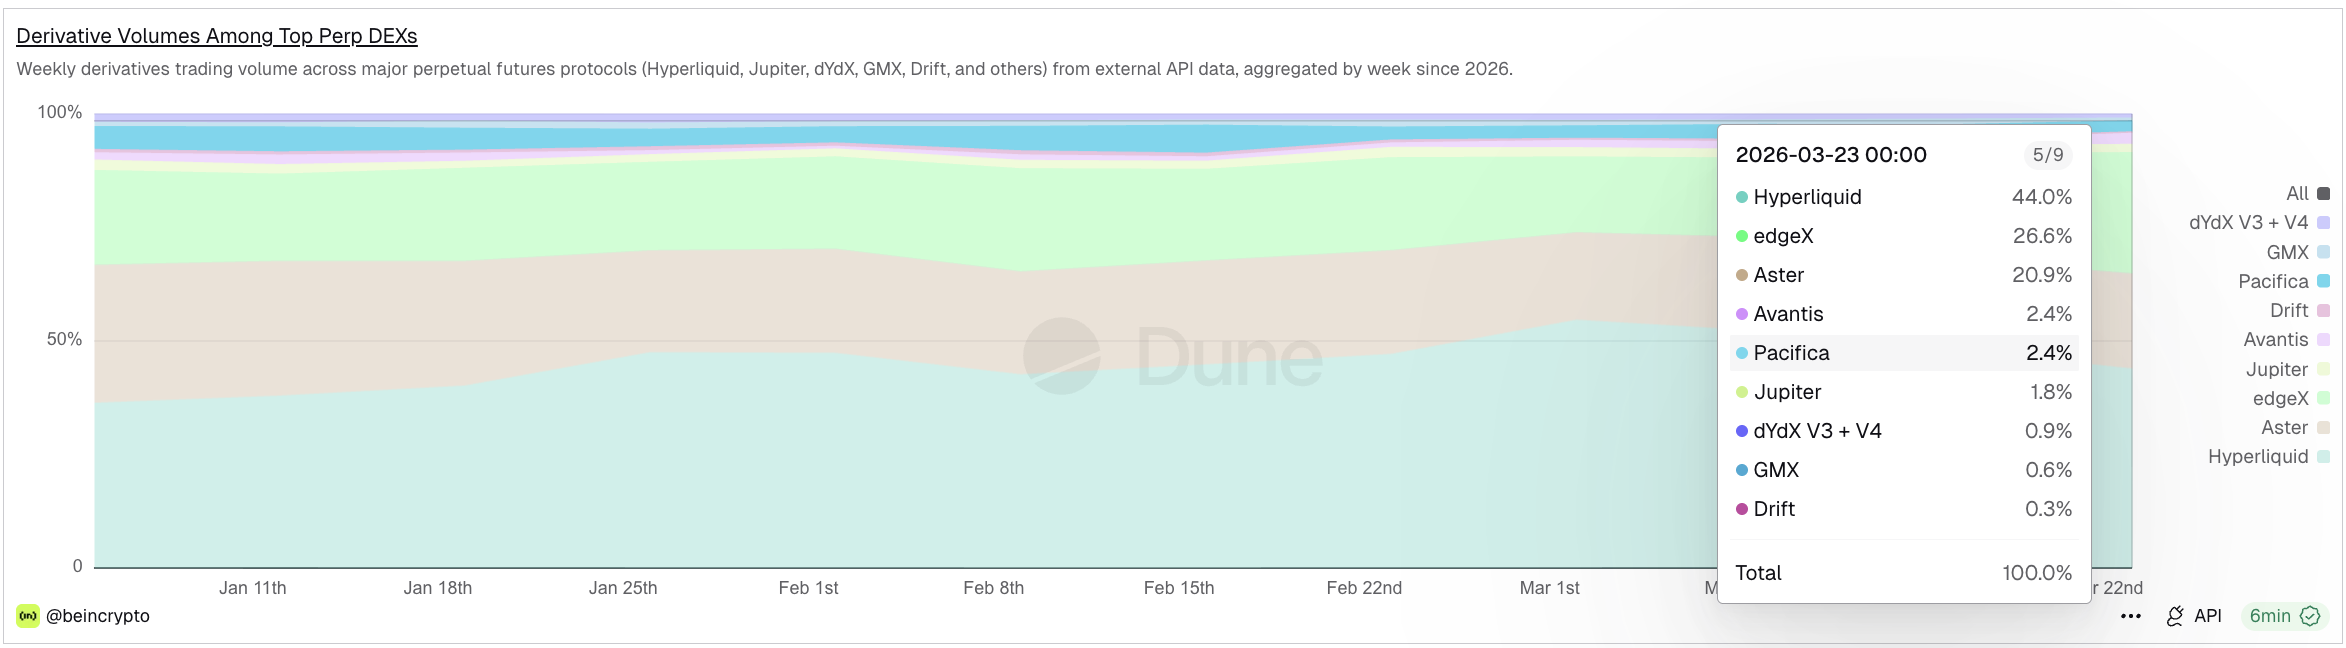
Every other major competitor lost ground during the same period. Aster dropped from 30.3% to 20.9%. edgeX held relatively steady at 26.6%, up slightly from 20.8% but still trailing Hyperliquid by a wide margin. Jupiter, dYdX, GMX, and Drift all remained below 3%. The Iran conflict and the resulting shift of traditional asset exposure toward 24/7 decentralized venues may have accelerated Hyperliquid’s dominance, as traders sought always-on access during volatile geopolitical conditions.
Spot buyers appear to be responding. Exchange flow data from Coinglass shows three consecutive days of net outflows for HYPE. On March 21, $2.94 million left exchanges, followed by $2.31 million the next day. On March 23, another $2.22 million exited, bringing the three-day total to $7.47 million. The pace has slowed slightly, a roughly 24% decline from the first to the third day, but the direction remains consistent.
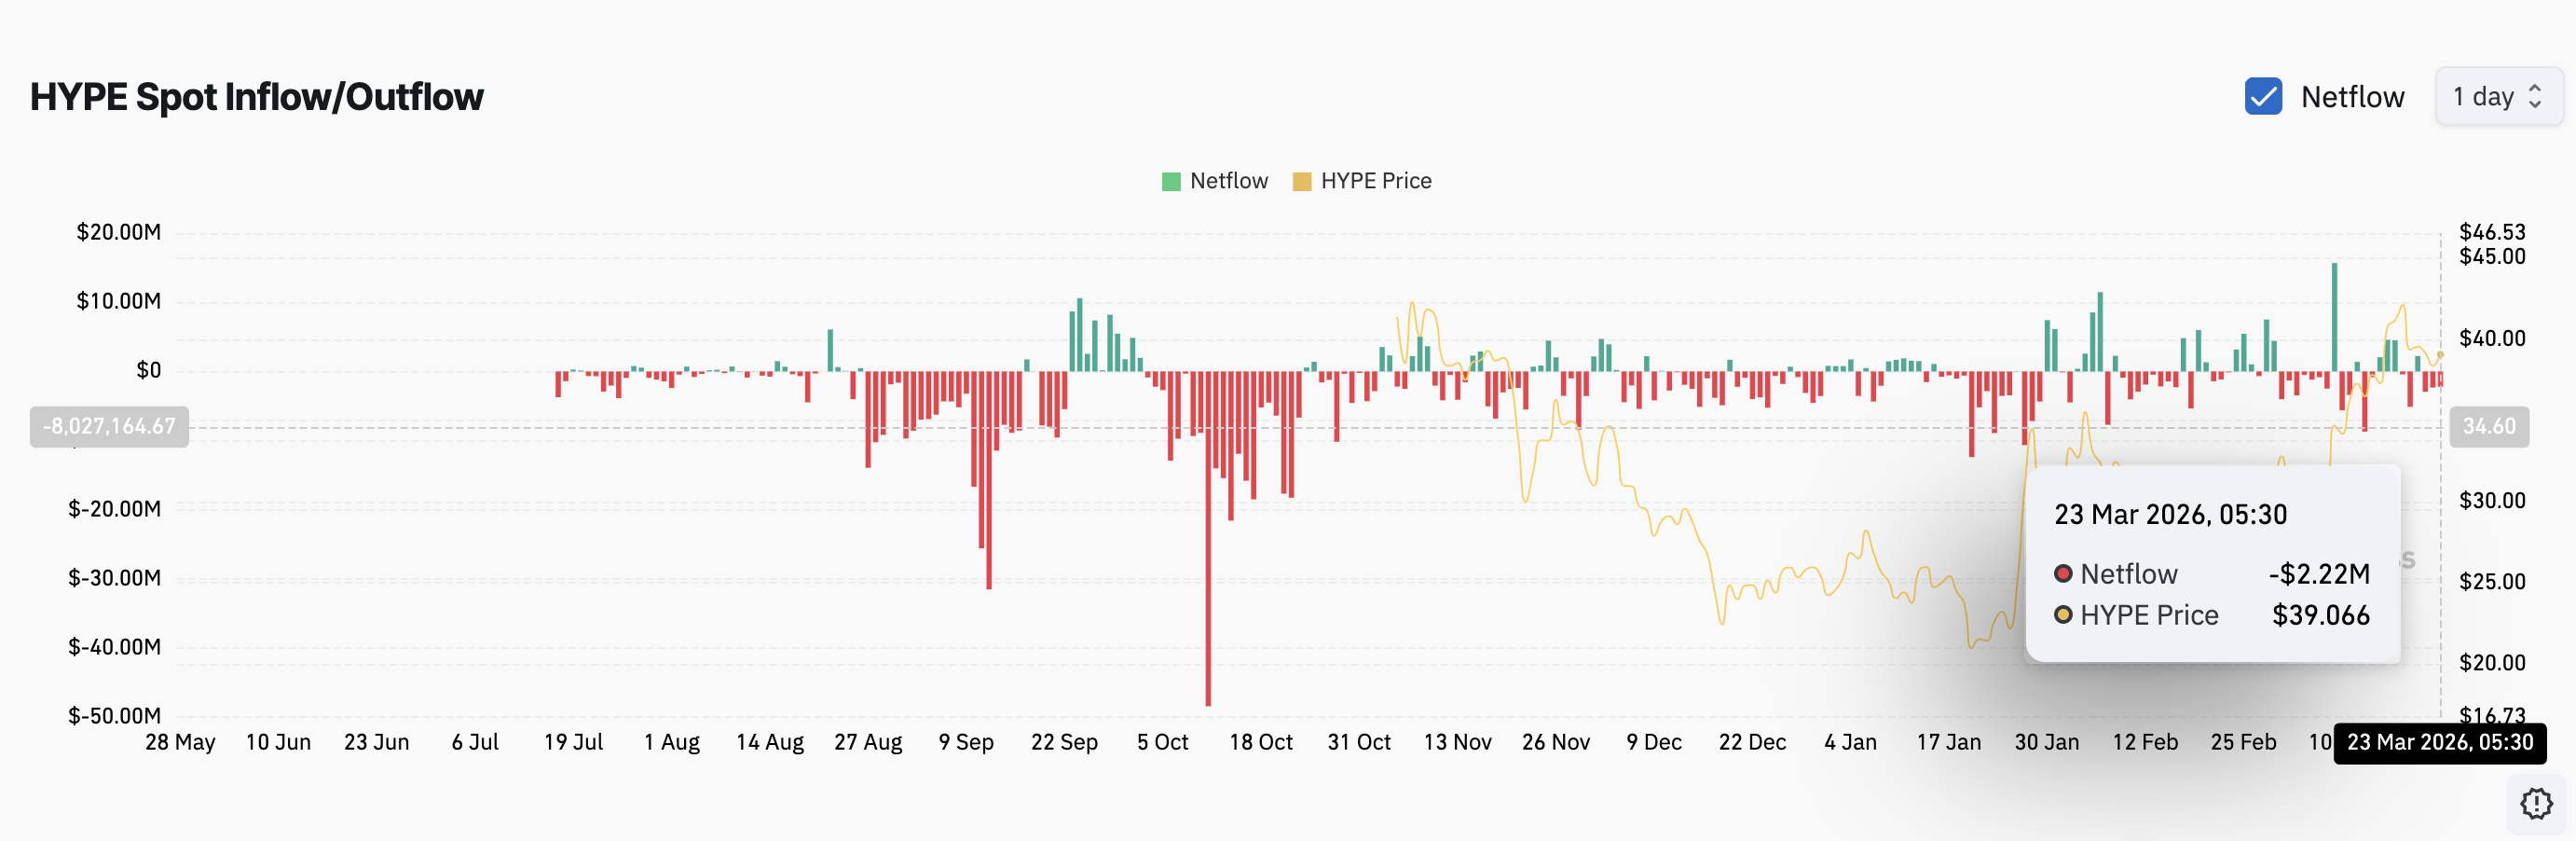
Spot accumulation during a consolidation phase after a 70% rally is a positioning pattern that typically precedes the next leg rather than a deeper correction. But whether the flag breaks depends on who is positioned on the other side.
Short Squeeze Fuel Builds as a Hidden Divergence Forms
The Bybit liquidation map for HYPE/USDT over the past seven days reveals a significant imbalance. Cumulative short liquidation leverage sits at $32.75 million, while long leverage totals roughly $12.63 million. That makes the short side approximately 160% larger than the long side.
Want more token insights like this? Sign up for Editor Harsh Notariya’s Daily Crypto Newsletter here.
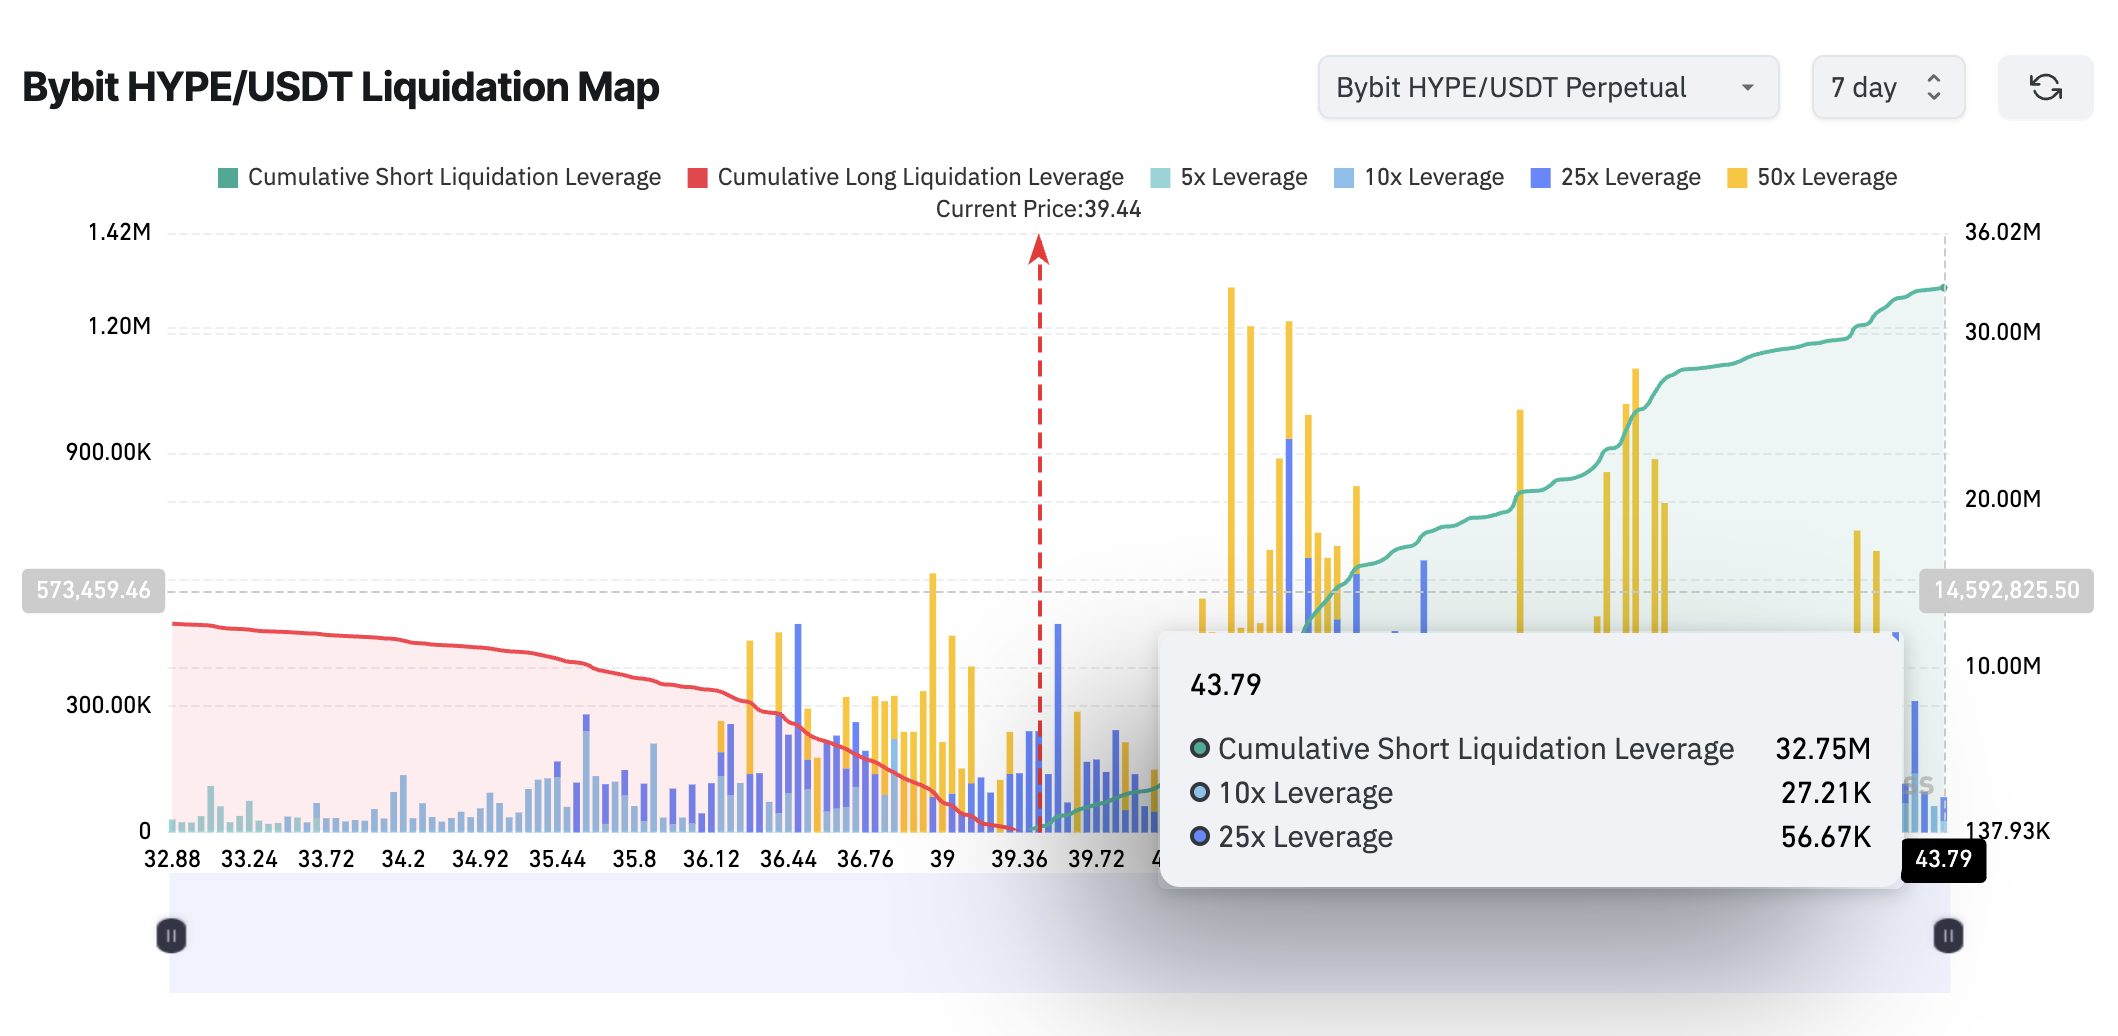
If the Hyperliquid price pushes above $43, the previous peak, it would trigger a cascade of short liquidations. Those forced buybacks become additional buying pressure, potentially accelerating the breakout from the flag pattern visible on the daily chart.
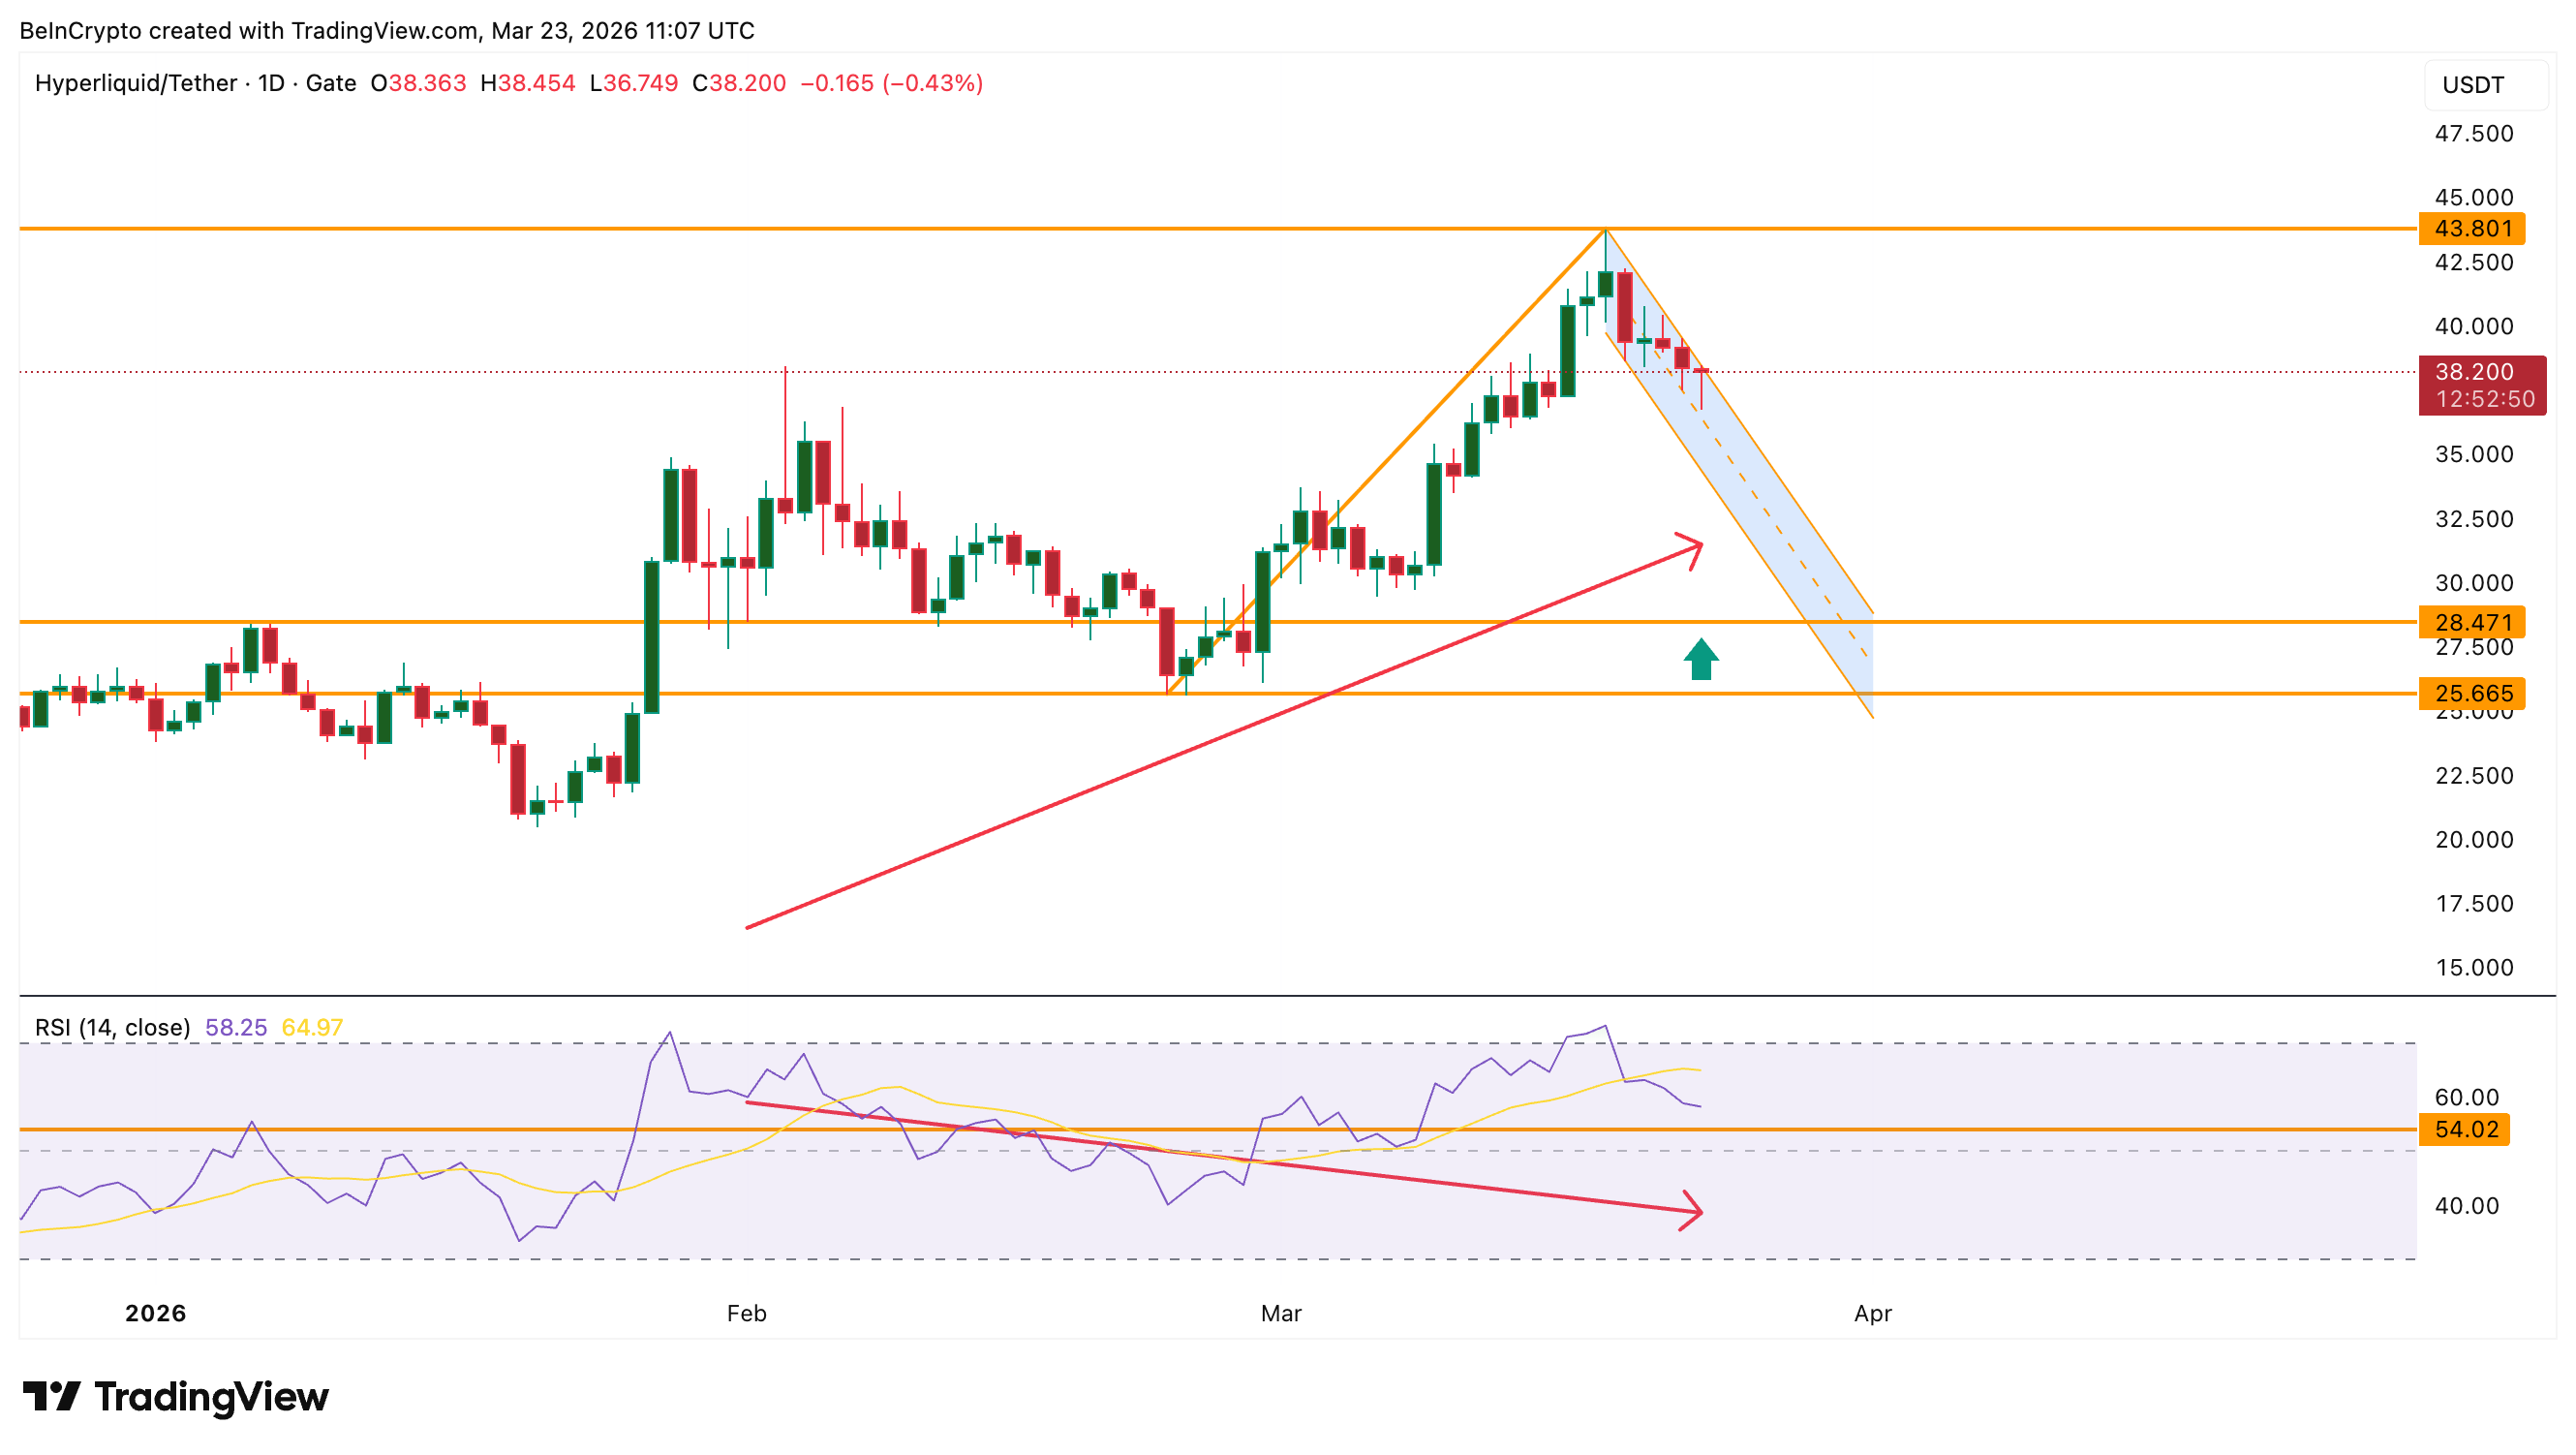
The daily chart also shows a hidden bullish divergence forming. Between February 1 and March 23, the HYPE price has been making a higher low on the candles while the relative strength index (RSI), a momentum indicator, appears to be forming a lower low. If the current candle holds and the next one closes above the current low, divergence is confirmed.
Hidden bullish divergence suggests that selling pressure is weakening during the consolidation, supporting upward continuation rather than a breakdown.
Spot outflows, a dominant DEX share, short squeeze fuel, and a forming hidden divergence all lean in the same direction. The HYPE price levels determine whether they activate.
HYPE Price Levels Now Confirm the Next Leg Up (Or Down)
The HYPE price has managed to stay above the current swing low of 36, a key support level, as buyers stepped in. Staying above this zone keeps the bull flag structure valid. The first meaningful hurdle sits at $43, the pole peak.
A daily close above $43 would strengthen the flag breakout, if that happens. It could then open a path toward $50 and $54 (the 1.0 extension). If the 70% pole replicates from the breakout level, the projected target reaches approximately $65, exactly the 1.618 Fib extension point.
On the downside, losing $36 weakens the breakout setup. The pattern remains technically intact above $33, but a daily close below $33 would invalidate the flag entirely and shift the bias back to bearish.
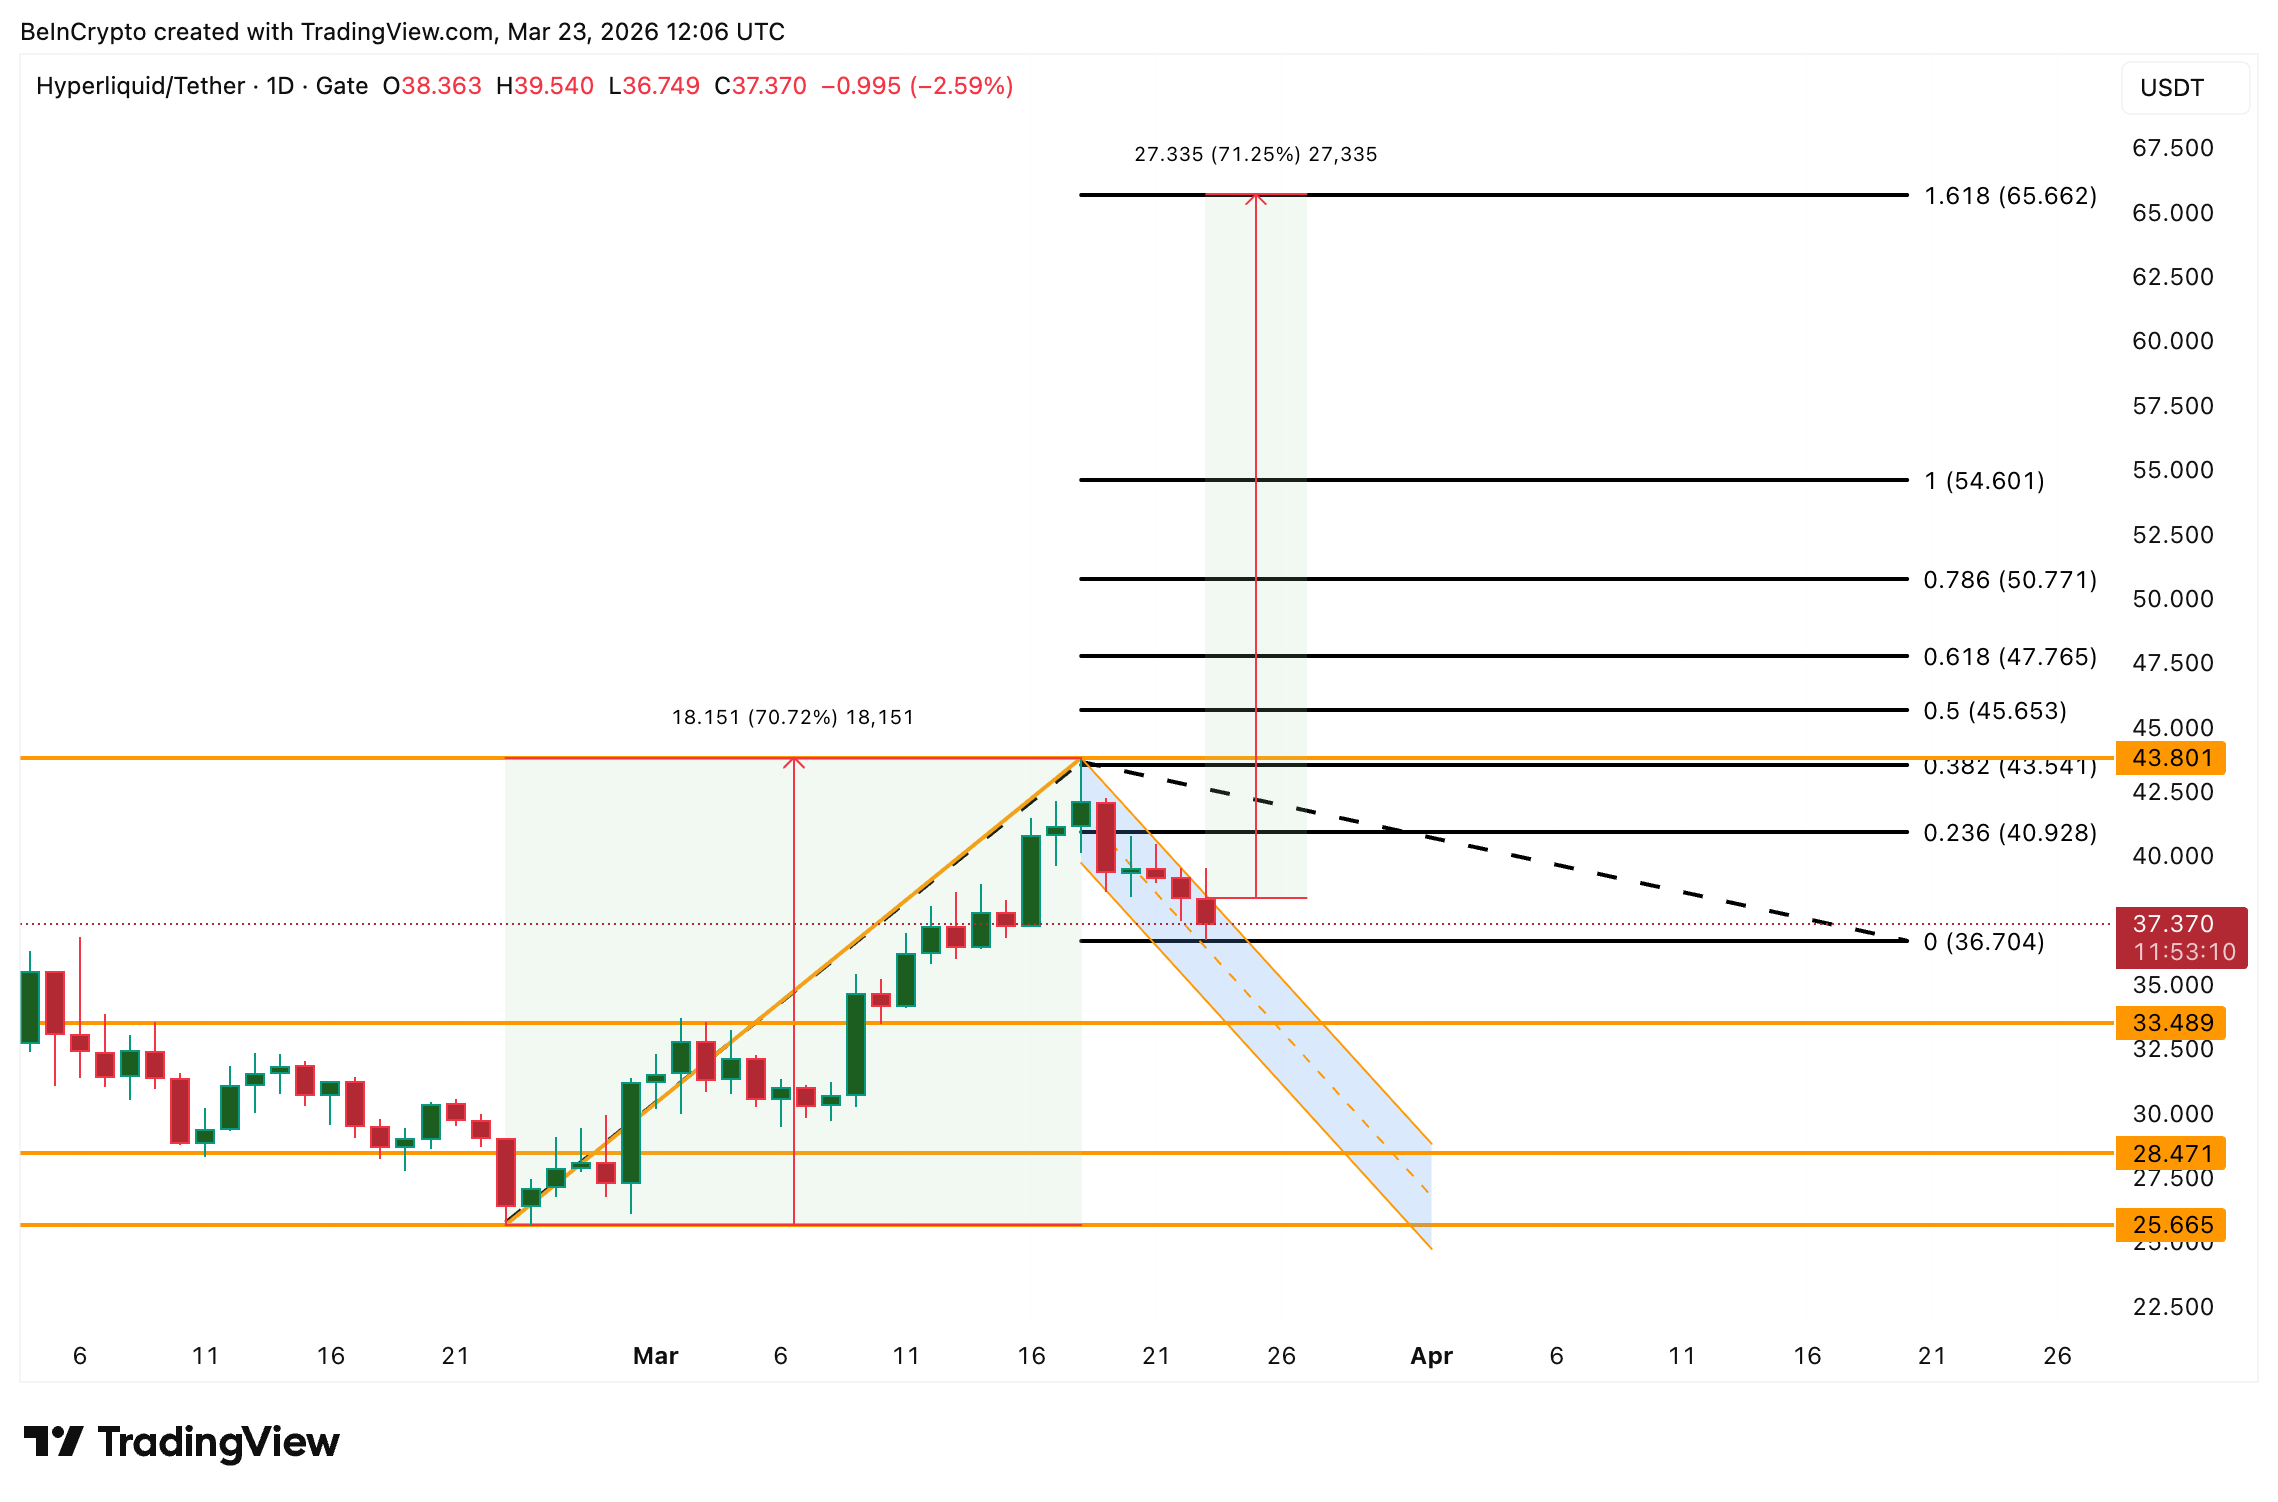
Currently, a daily close above $43 is what the Hyperliquid bull needs to rush towards the breakout projection.
The post Hyperliquid Price Consolidates After a 70% Surge as DEX Market Share Hits 44% appeared first on BeInCrypto.