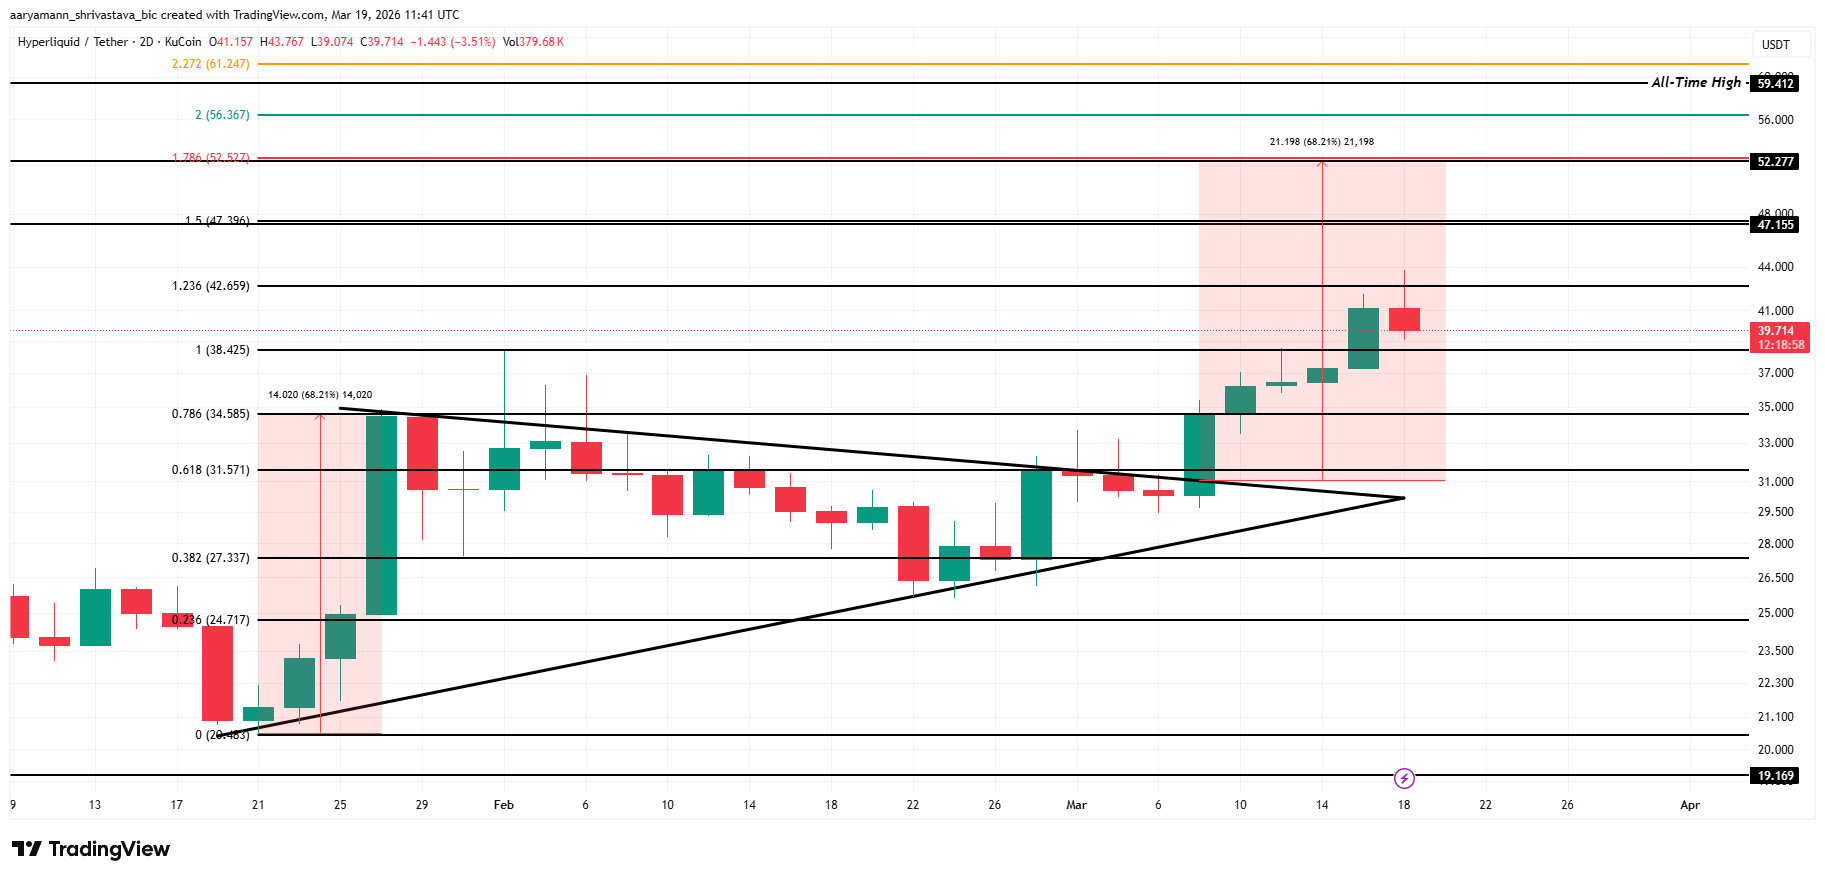
Hyperliquid (HYPE) is trading around $39.71 after breaking out of a multi-month symmetrical triangle on the 2-day chart, with a measured move pointing 68% higher to $52.27.
The breakout follows a sustained compression between converging trendlines dating back to late January. The token is up roughly 19% over the past week, but a key momentum indicator now contradicts the bullish price structure.
Bearish Divergence Signals Weak Demand For HYPE
The Chaikin Money Flow (CMF) on the 2D chart is currently reading -0.08, placing it below the zero line. This negative reading indicates that capital is flowing out of HYPE, not into it, despite the price trading near recent highs above $39.
CMF is forming a bearish divergence with HYPE. While price has formed higher highs since early March, CMF has continued to trend downward along a descending trendline visible since late January. That divergence warns that the breakout may lack the institutional buying pressure needed to sustain momentum into the $47–$52 zone.
Want more token insights like this? Sign up for Editor Harsh Notariya’s Daily Crypto Newsletter here.
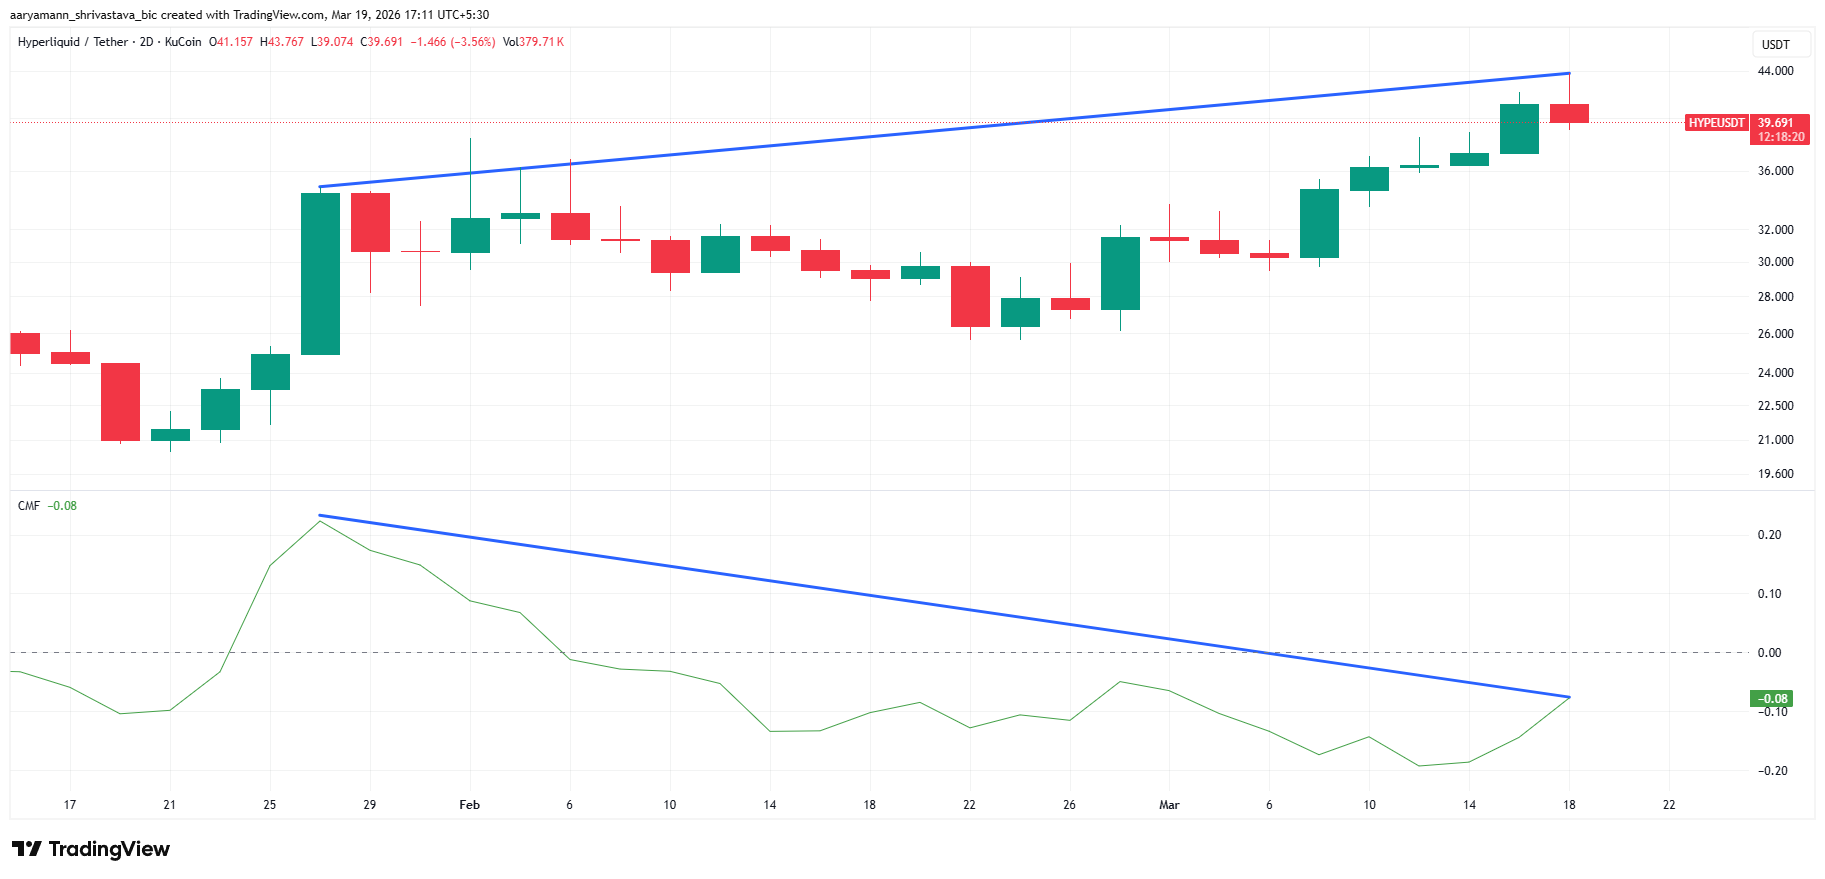
For the signal to flip bullish, CMF would need to close back above 0.00 and hold. Until that happens, the indicator paints the current rally as a liquidity-driven move rather than one backed by genuine demand accumulation.
Will The Short Liquidation Cluster Fuel or Stall the Next Move?
The liquidation map for Binance HYPE/USDT Perpetual over the past 30 days reveals a significant short liquidation cluster between $45 and $48. At the $47 level specifically, cumulative short liquidation leverage stands at $18.30 Million.
This cluster acts as a magnet. If HYPE pushes above $43–$44 with volume, cascading short liquidations in that $45–$48 range could inject fast-moving buy pressure and propel the token upward. That level also sits directly inside the densest liquidation band.
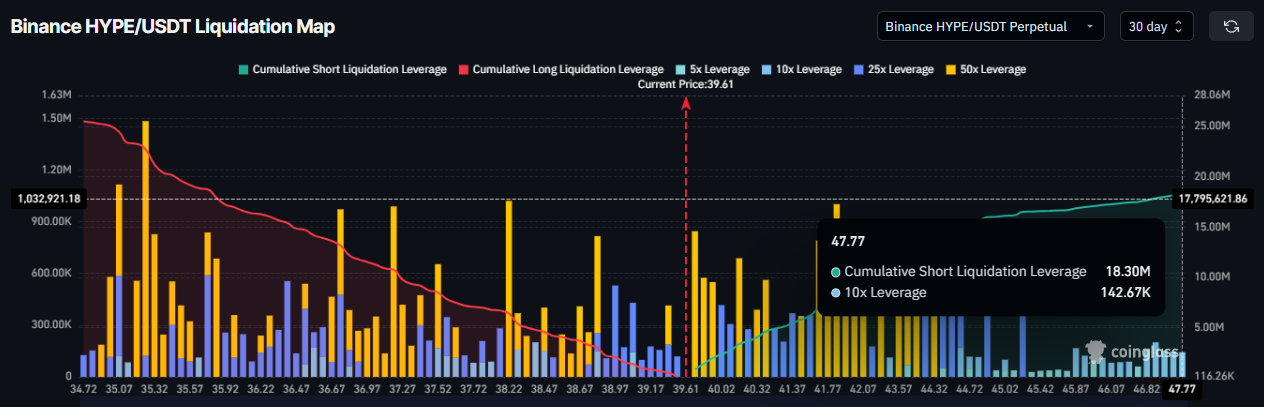
However, the current price at $39.61 also sits at a notable point on the map where a large concentration of long liquidations was recently cleared. That suggests the immediate overhead is less crowded than the $47–$48 zone, but getting there requires pushing through the $40–$43 with conviction.
HYPE Price Needs To Breach This Barrier
HYPE broke above a symmetrical triangle that had formed between mid-January and early March. The pattern’s lower trendline acted as rising support from the $20.48 low, while a descending upper trendline capped each rally attempt until the breakout in early March.
The measured move from this triangle targets the Fibonacci 1.786 extension at $52.27, representing a 68% gain from current levels near $39.71. The chart also marks an intermediate target at the 1.5 extension of $47.40, which aligns closely with the heavy short liquidation cluster identified on the liquidation map.
HYPE recently saw Hyperliquid introduce prediction markets and options support in February 2026 — both developments that could serve as catalysts if broader market conditions turn supportive. If $38.42 holds and CMF recovers above zero, the path to $47.40 opens. A breakdown below that support puts the entire breakout thesis in question.
The critical support level is the Fibonacci 1.0 retracement at $38.42. A daily close below that level would signal a failed breakout and likely send HYPE back toward the 0.786 level at $34.59. Above that, the 1.236 extension at $42.66 is the first resistance to clear before the $47 zone becomes accessible.
The post HYPE Price Breakout Targets a 68% Rise Beyond $50 appeared first on BeInCrypto.