Hedera (HBAR) didn’t join the broader market rally, but when the market turned red, it was among the first to follow suit, sliding almost 6% in the past 24 hours. Over the past week, HBAR has done almost nothing; the price is exactly where it started seven days ago.
This flatline tells a story of buyers and sellers locked in a stalemate. But dig deeper, and multiple timeframes are now flashing signals that point to a possible deeper correction or the sellers winning.
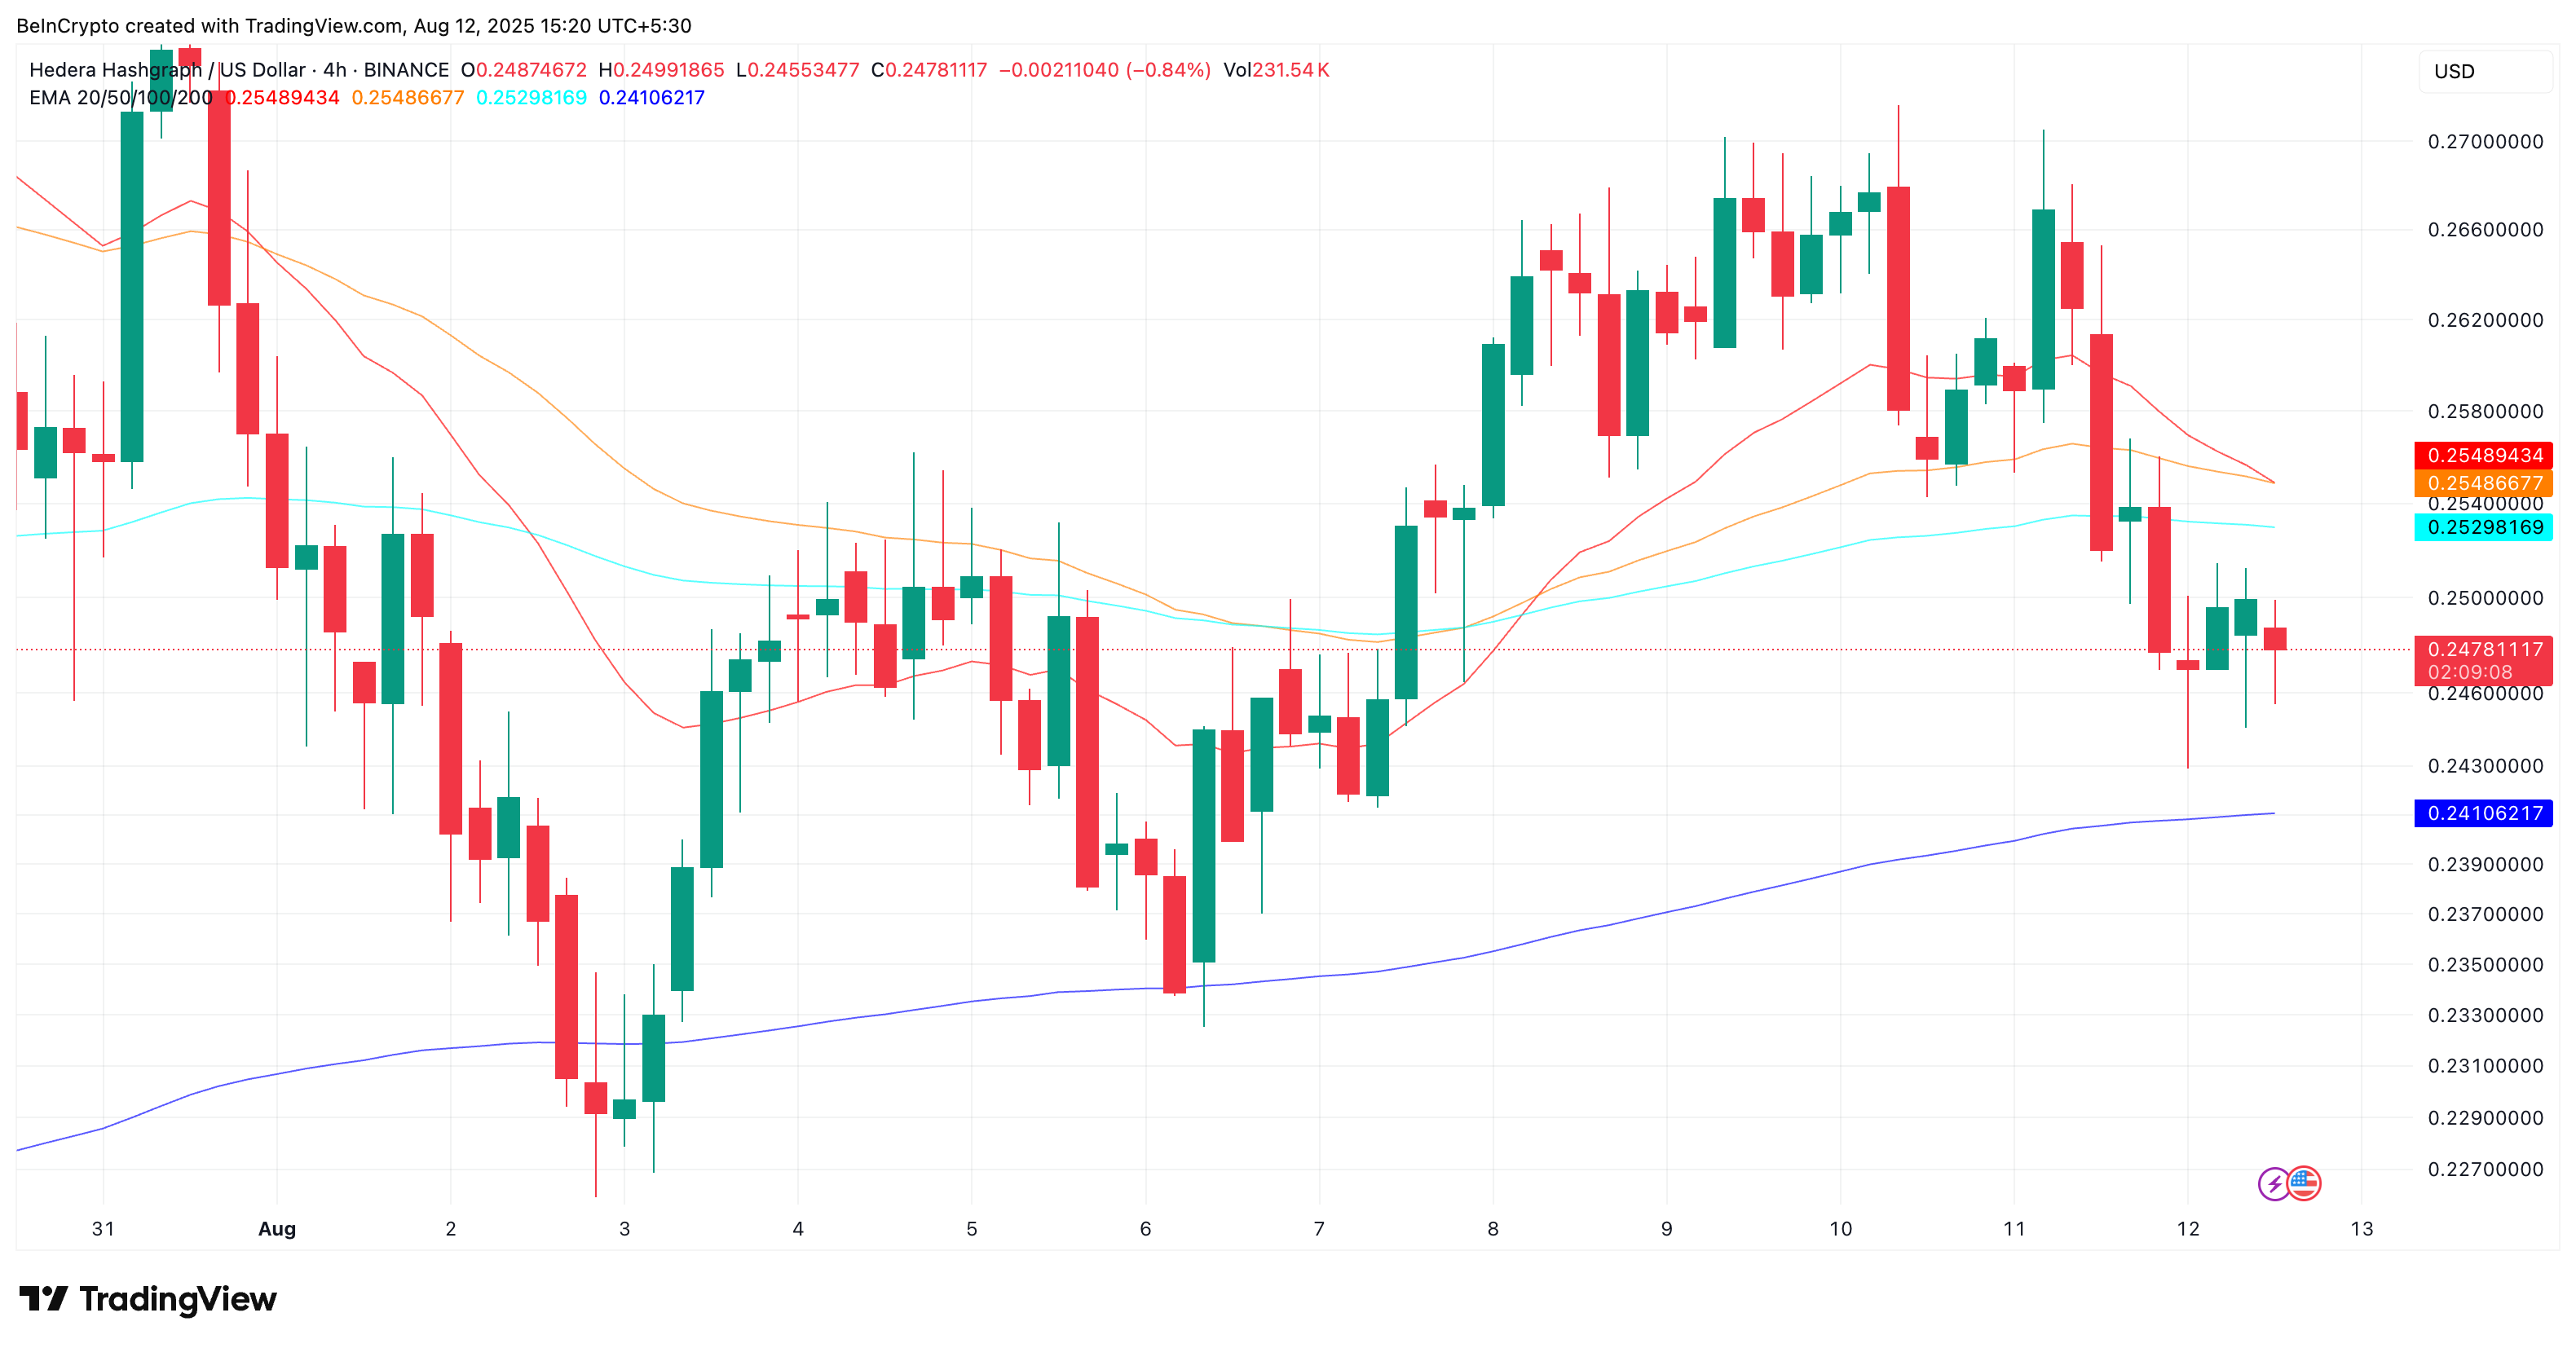
4-Hour Chart Flags a Looming Death Cross, Sellers Eye Advantage
With the 7-day price showing zero net change, we zoomed into the 4-hour timeframe to catch shorter-term shifts and found one pattern worth watching.
HBAR’s 20-period Exponential Moving Average (EMA), or the red line, is on the verge of crossing below its 50-period EMA (the orange line), almost forming what traders call a Death Cross. This technical event often signals a momentum shift from buyers to sellers, especially in the short term.
For token TA and market updates: Want more token insights like this? Sign up for Editor Harsh Notariya’s Daily Crypto Newsletter here.
The setup comes as weekly Exchange Net Flows have been losing their earlier bullish edge. Since the week of July 21, net flows have been deeply negative, peaking at -$46 million, which implied strong buying pressure as coins left exchanges.
But in recent weeks, that negativity has been fading (-$40 million to -$19 million to -$10 million). In simpler terms, the aggressive accumulation is slowing, inching closer to neutral or positive flows; a potential early sign of weakening demand.

A Death Cross alone can spook momentum buyers, but paired with cooling net outflows, it suggests sellers may soon have the upper hand.
HBAR Price Chart Pattern Faces Breakdown Risk as Bear Power Rises
The daily chart offers its own warning. HBAR has been consolidating inside a pennant pattern, a tightening range formed by converging trendlines. Price action is now hugging the lower trendline, which sits just above key support at $0.24.
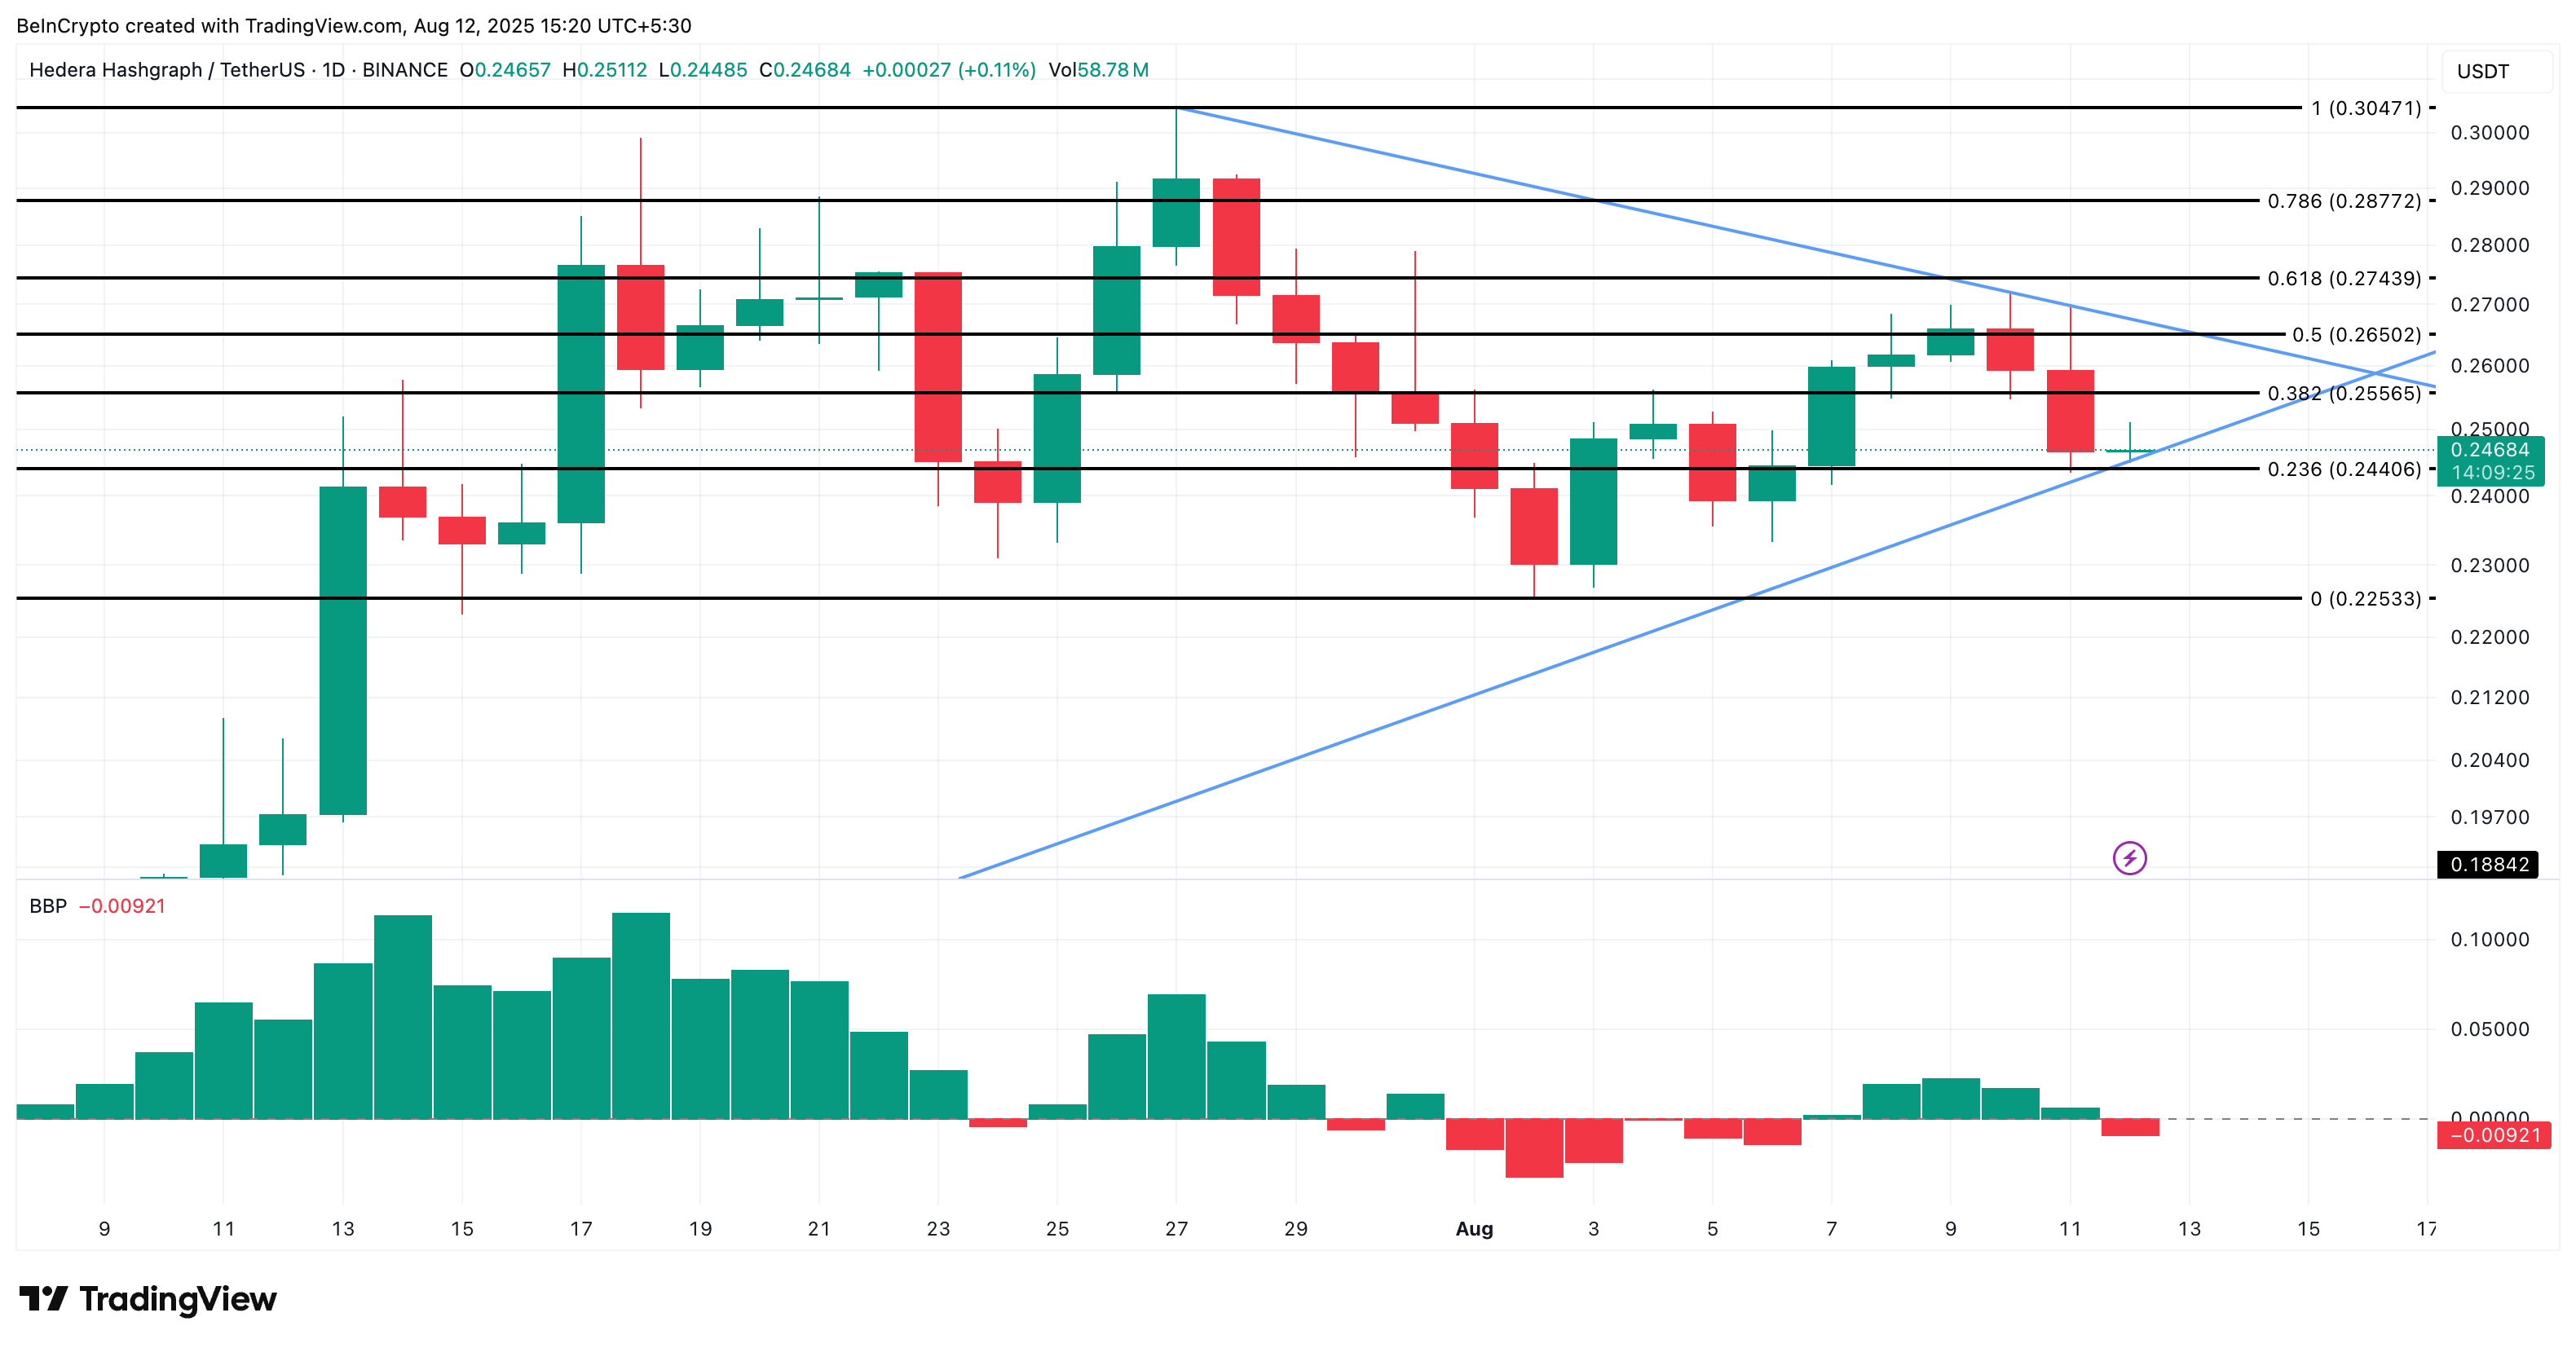
If that support breaks, with the HBAR price breaching the lower trendline of the pennant, a dip towards $0.22, or almost 10% from the current levels, looks likely.
Adding weight to this setup is the Elder-Ray Bear Power indicator, which has been climbing, indicating that selling pressure is gradually overpowering buying force.
Pennants can break either way, but when paired with rising bear power and weaker buy pressure, the odds tilt toward the downside.
Bear Power measures the distance between the lowest price and an EMA baseline, helping gauge seller dominance.
If HBAR holds $0.225 and the 4-hour Death Cross fails to confirm, a price rebound toward $0.26 could be in play. A shift back to strong negative net flows (indicating accumulation) would further weaken the bearish outlook.
The post HBAR Faces Death Cross Threat — A 10% Drop Could Be Next If One Key Level Fails appeared first on BeInCrypto.