
Ethereum price is drawing renewed attention after a fresh lifetime record quietly appeared in the derivatives market. On the surface, the development may look like growing trader confidence. But when combined with Ethereum’s recent price structure and momentum signals, the picture becomes less bullish.
Several indicators are now pointing to a weakening setup that could determine whether Ethereum price stabilizes here or reopens the path toward $1,800.
Record Leverage Ratio Shows Speculation Is Intensifying
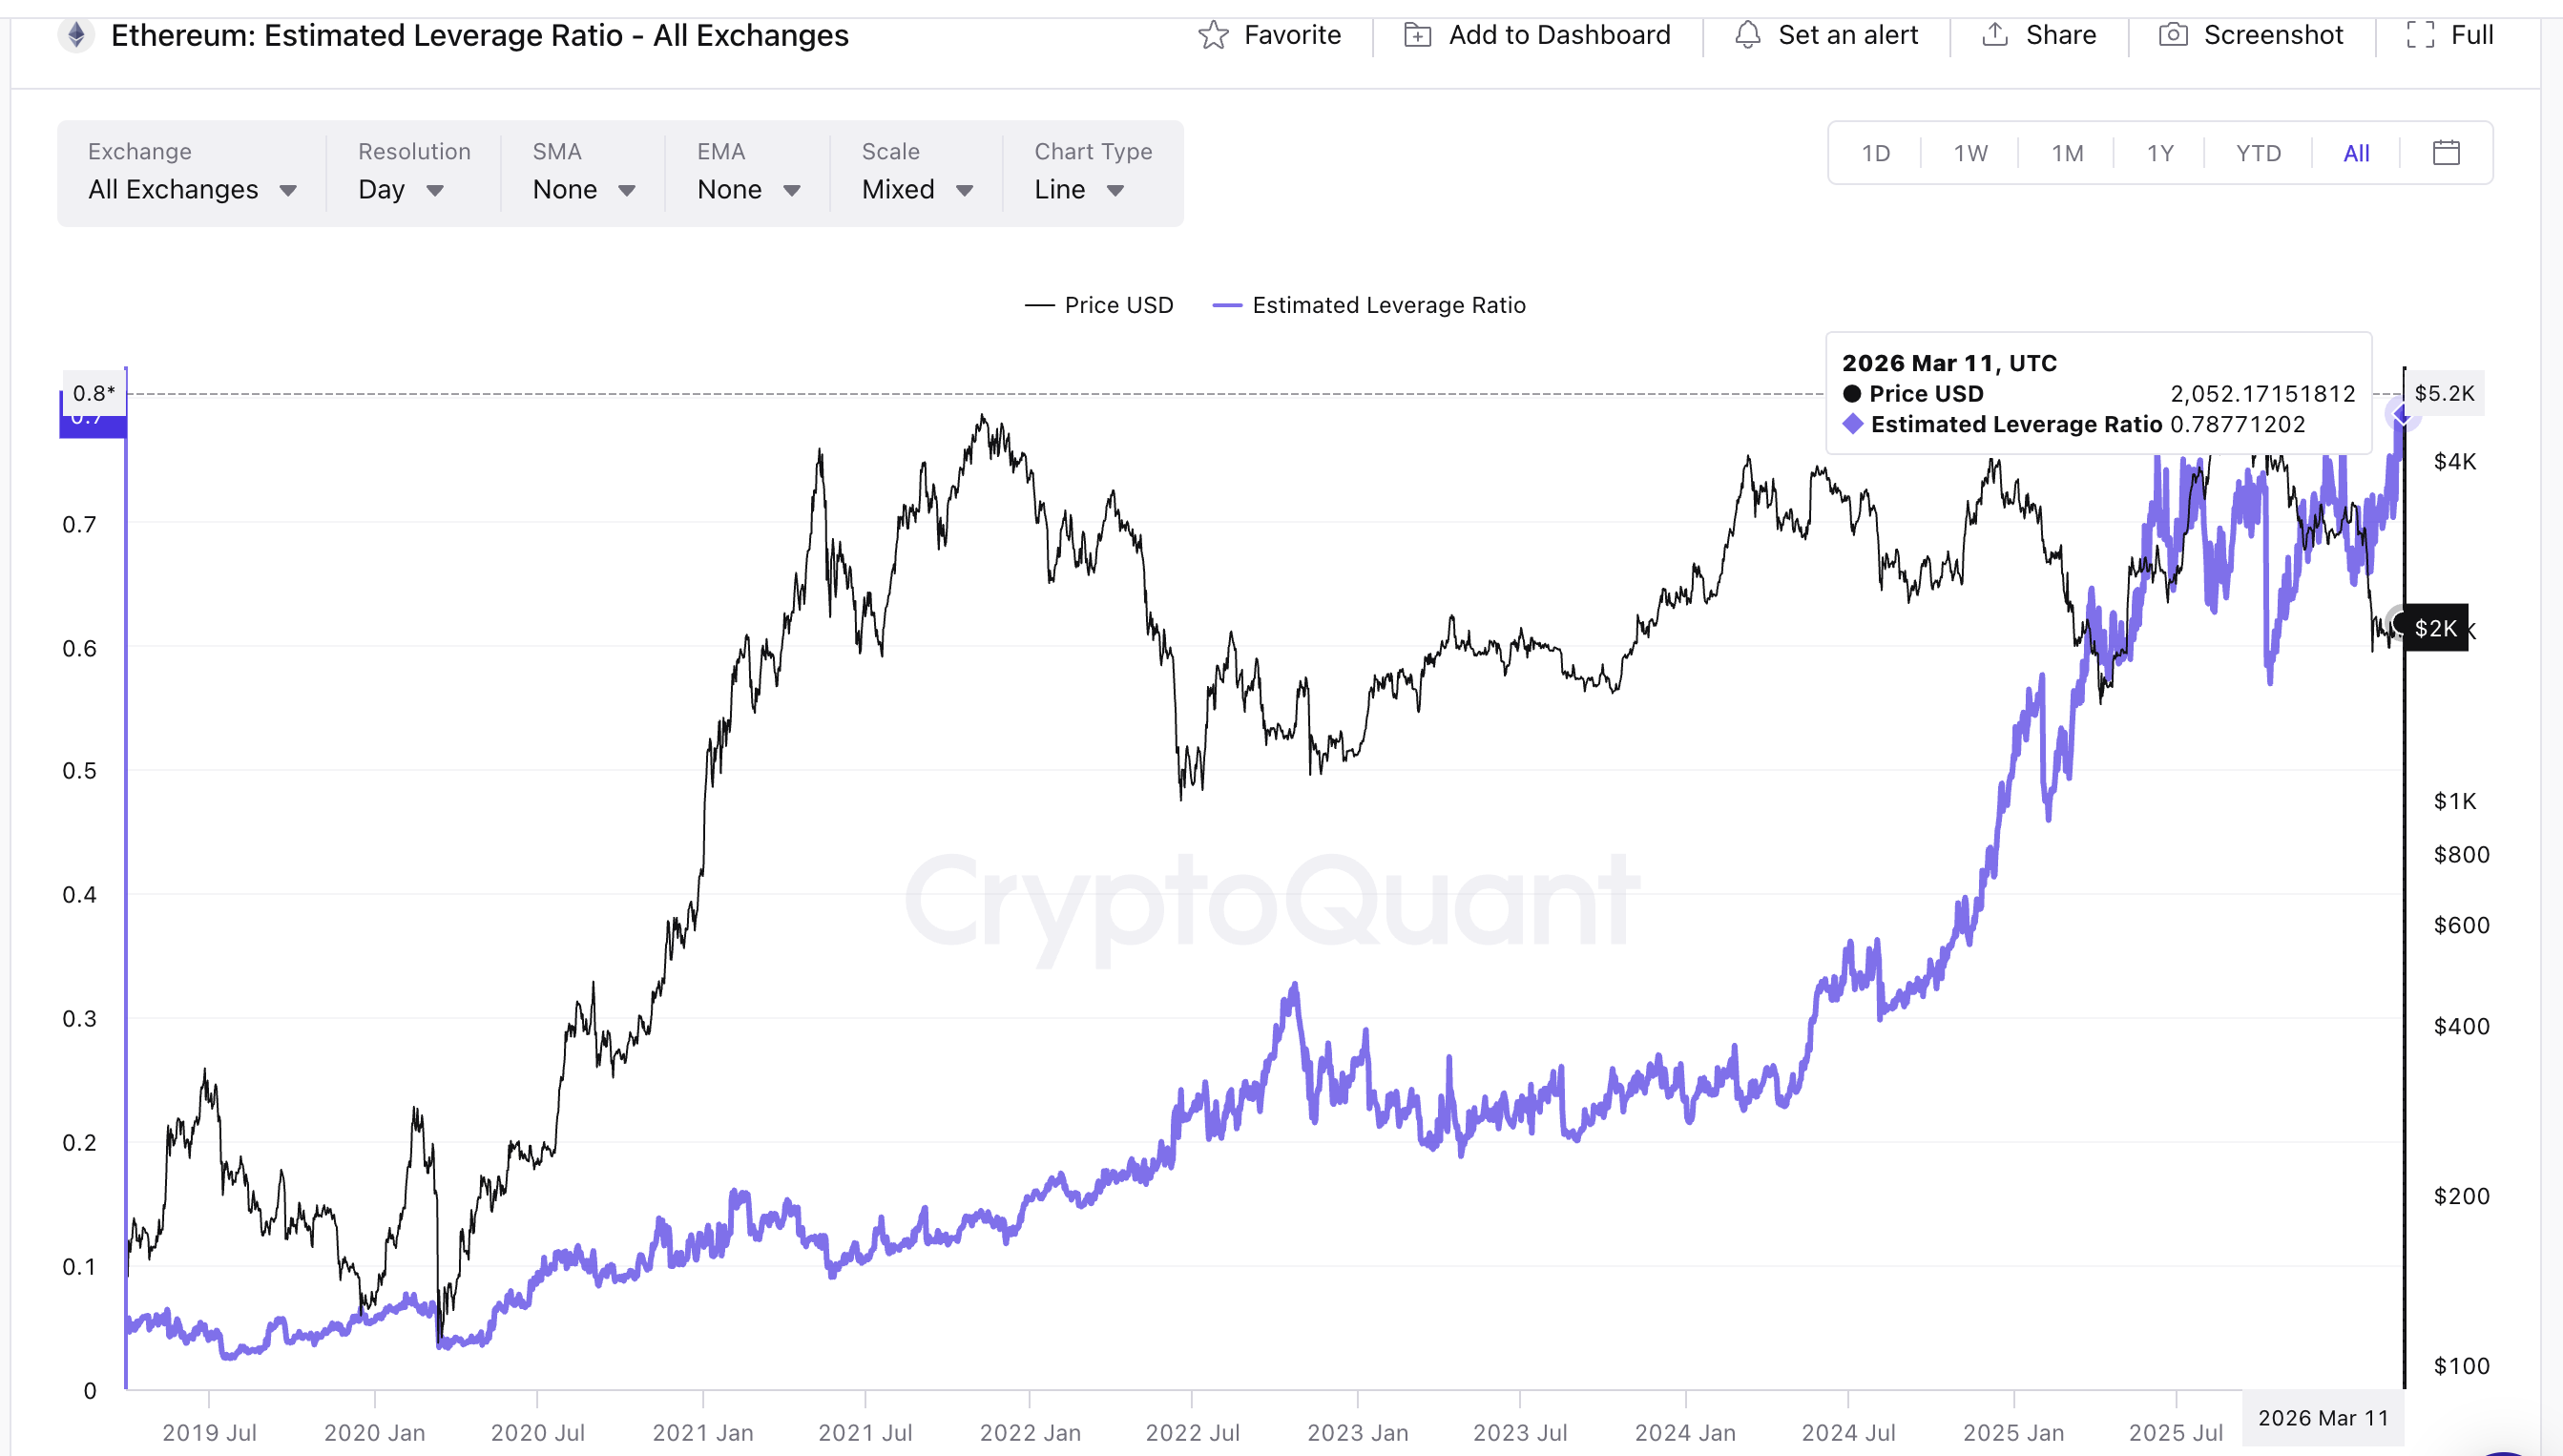
Ethereum price is currently trading in one of the most speculative derivatives environments in its recent history.
The estimated leverage ratio across exchanges has surged to around 0.78, the highest level ever recorded, according to CryptoQuant data. The ratio reached similar levels earlier in March and set a fresh record again on March 11, confirming that speculative positioning has continued building.
Want more token insights like this? Sign up for Editor Harsh Notariya’s Daily Crypto Newsletter here.
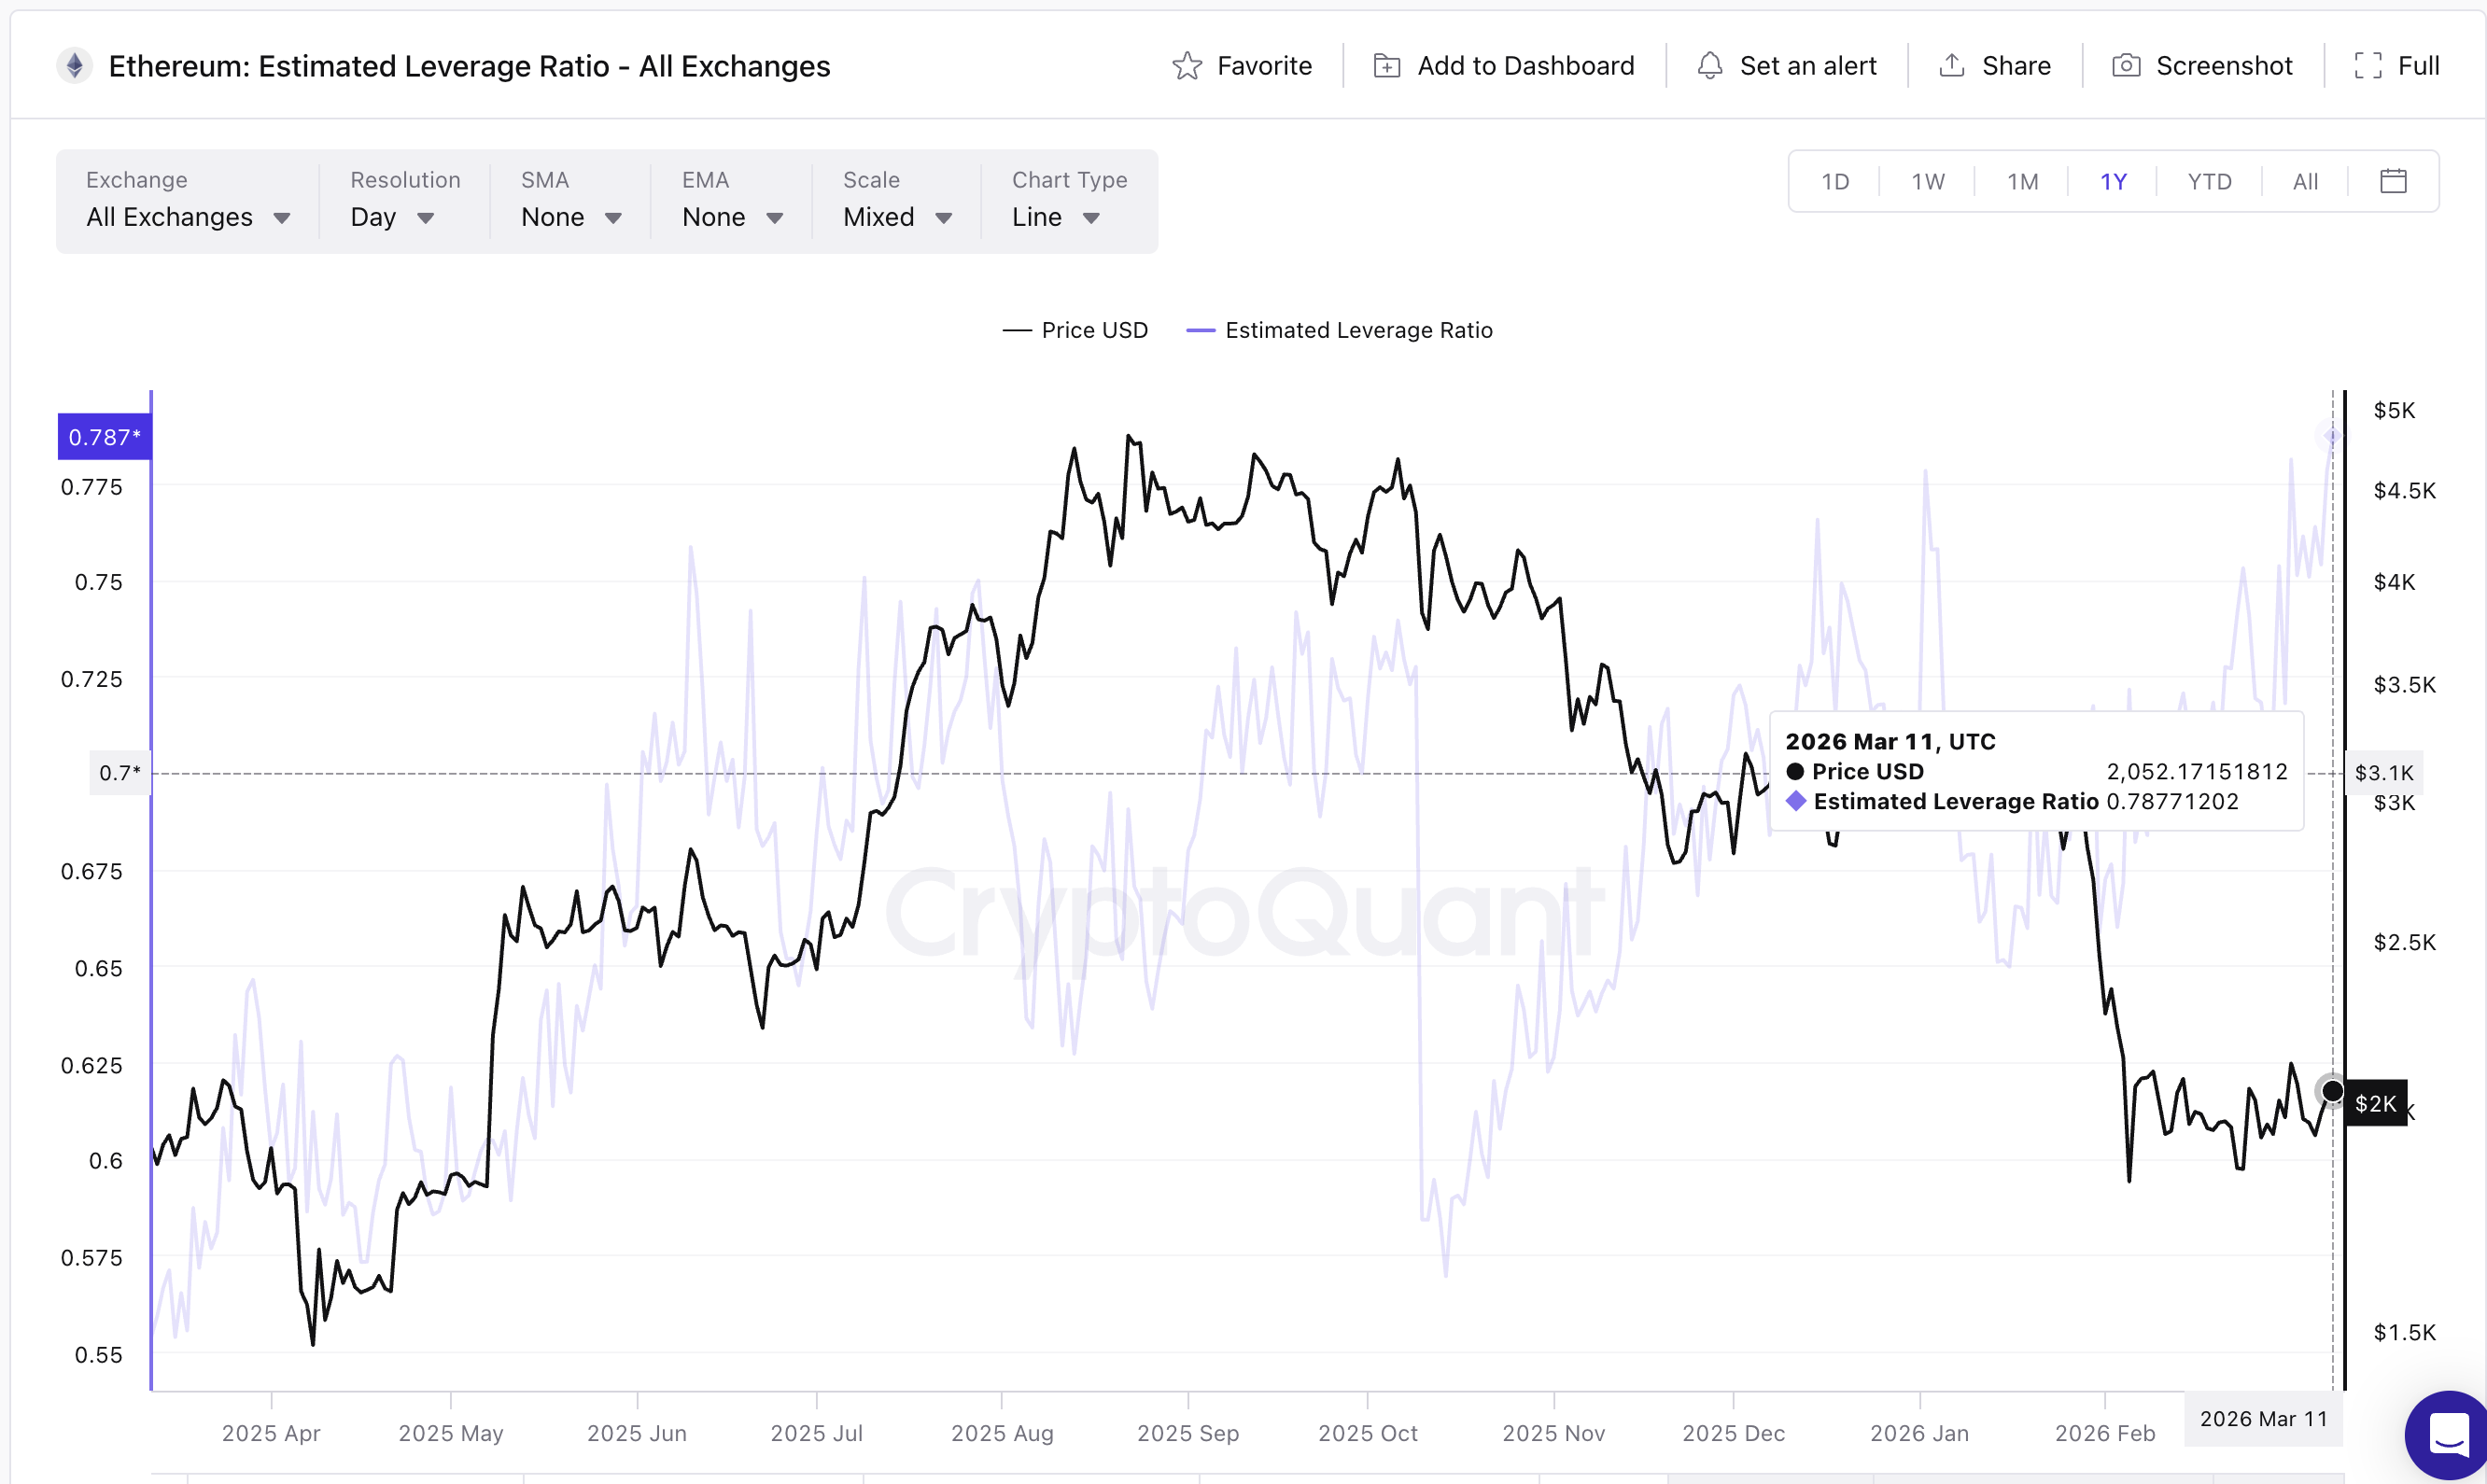
The metric compares derivatives open interest with the amount of ETH held on exchanges. When the ratio rises, it means traders are increasingly relying on borrowed capital to place directional bets. This metric for BTC has started to lean downwards, hinting at a possible shift from Bitcoin to altcoins.
This surge in leverage is supported by a rapid expansion in open interest. Ethereum open interest increased from roughly $9.4 billion on March 9 to about $10.21 billion by March 12, representing an increase of approximately 8.6% in just three days.
When open interest and leverage ratios rise together, it typically signals that new leveraged positions are entering the market, rather than older trades simply rotating. But here comes the bearish bit, even though it could look bullish at first.
Funding rates provide another clue about how traders are positioning themselves.
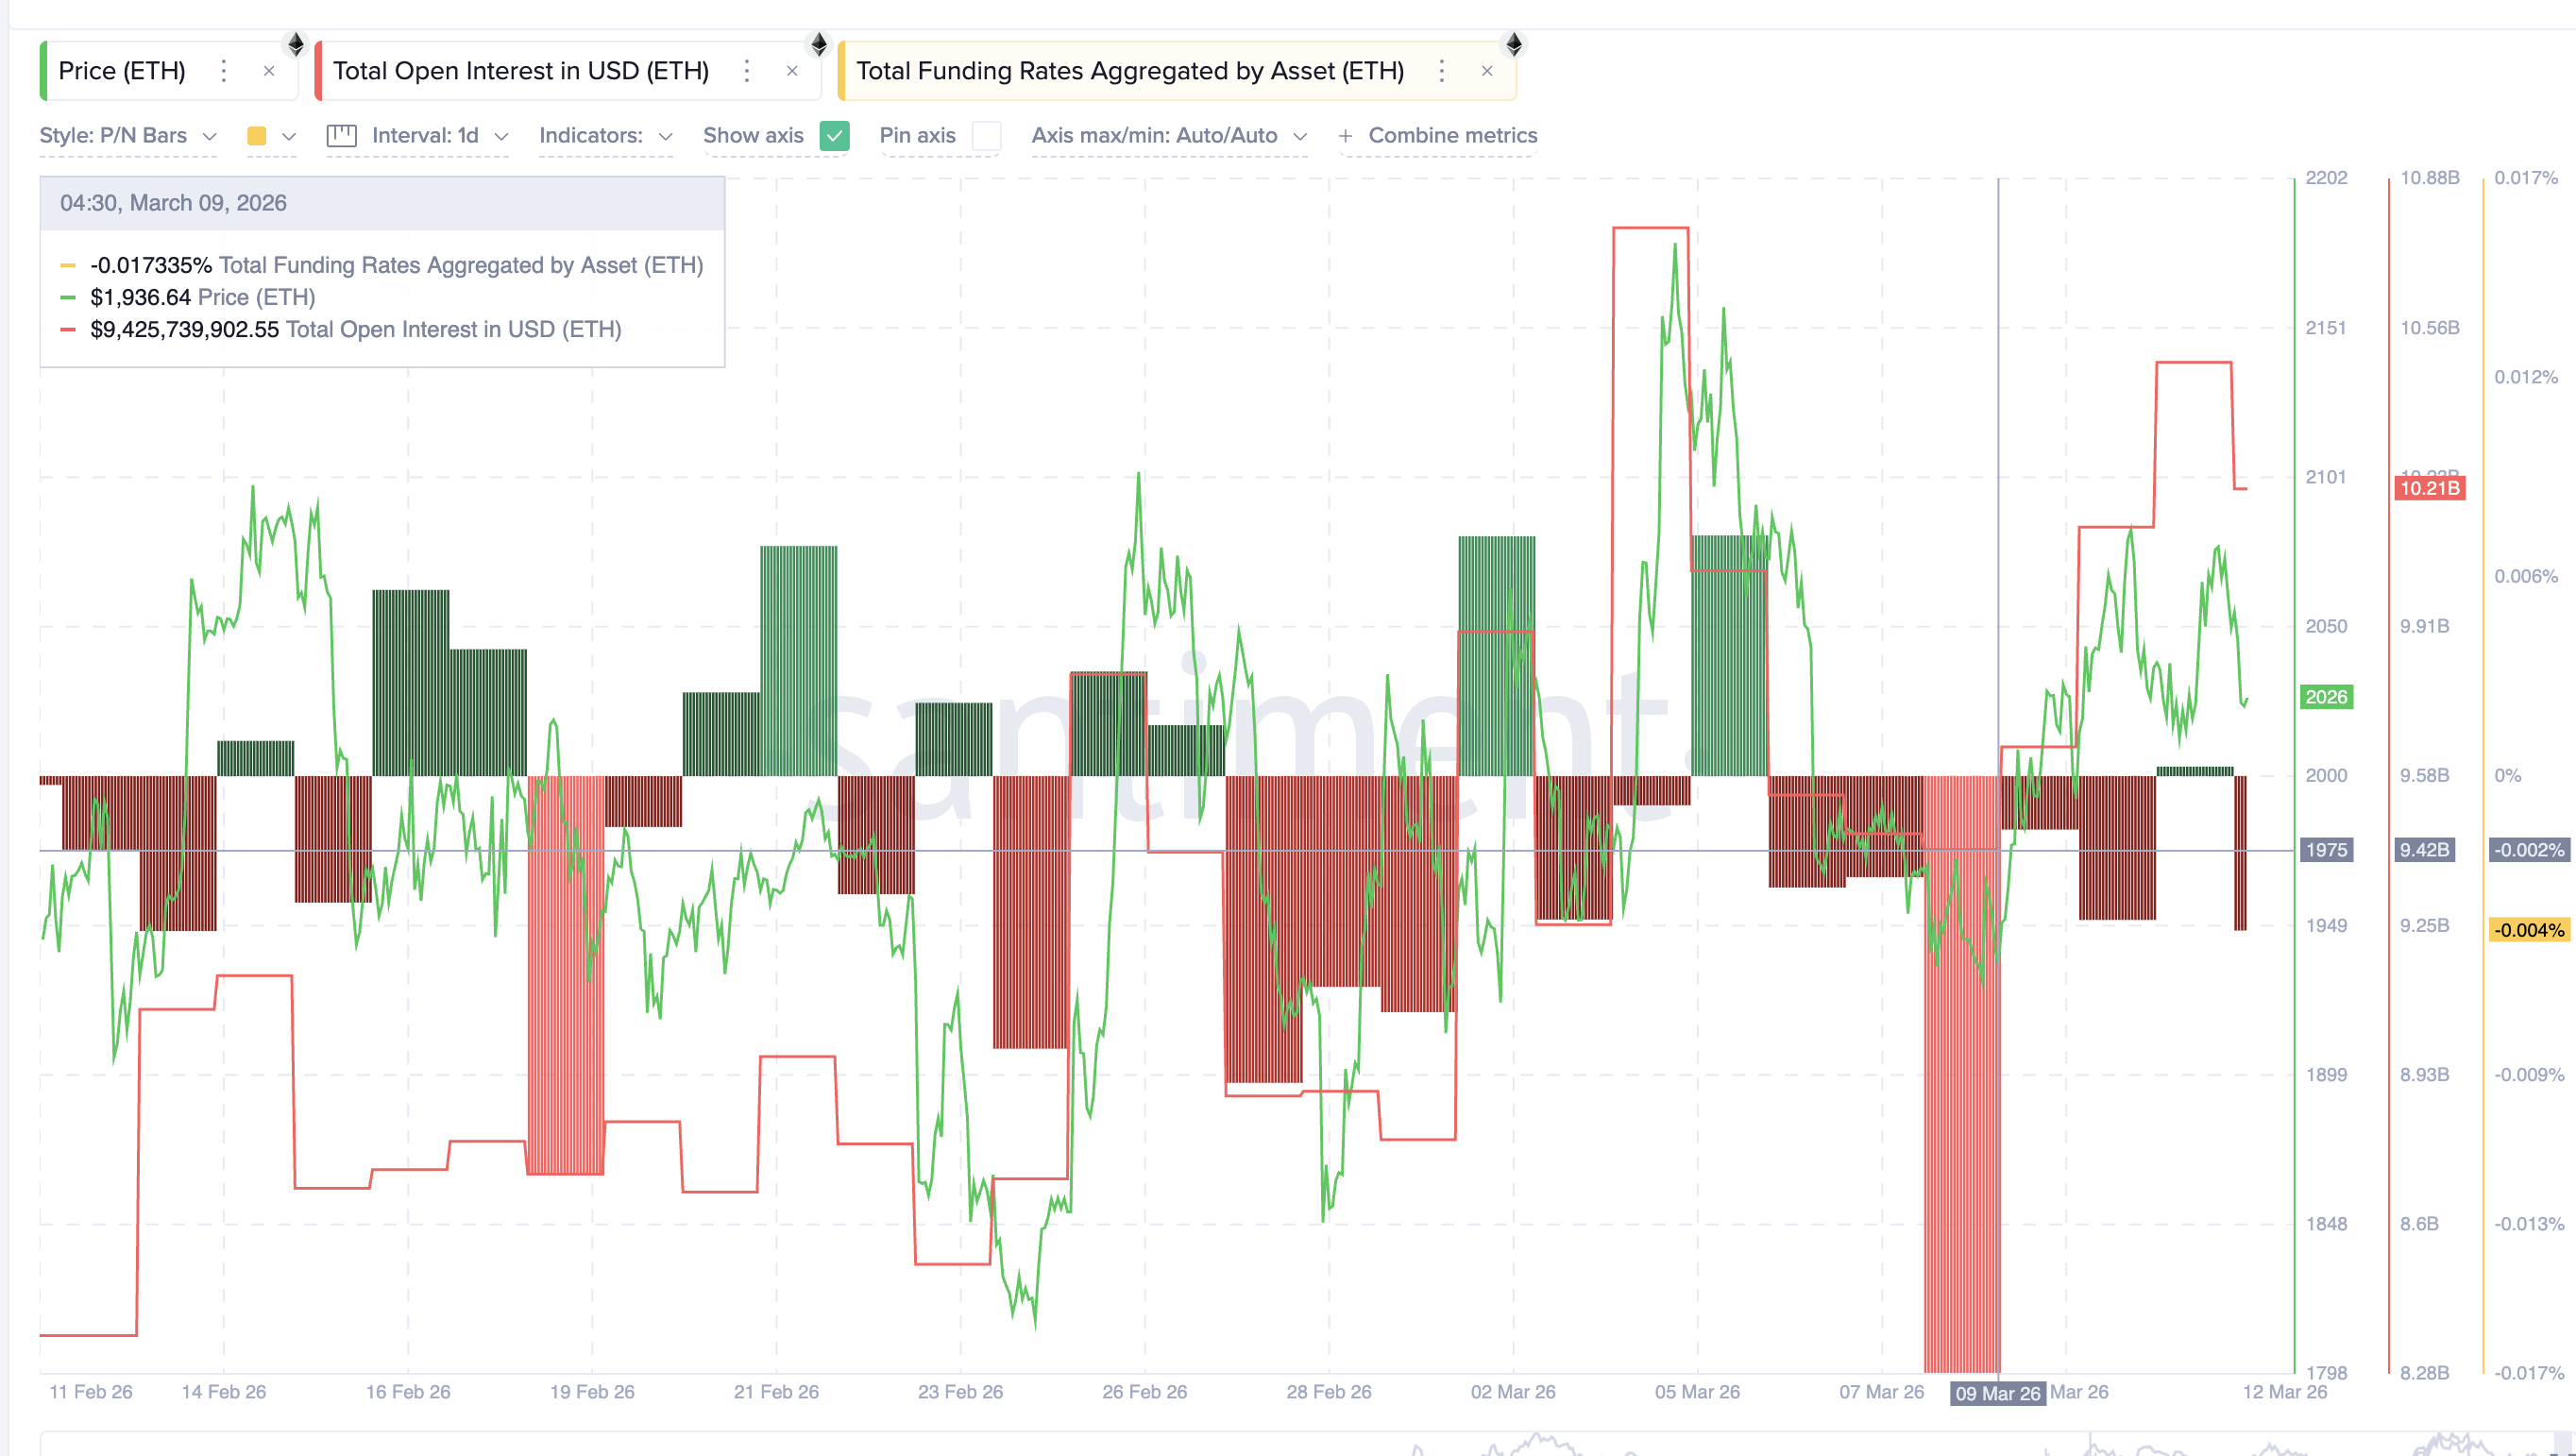
Earlier this week, Ethereum funding dropped to -0.017%, showing heavy short positioning. However, even as open interest kept rising, funding rates recovered toward -0.004%.
This shift suggests that short pressure is easing while new long positions are stepping into the market, increasing overall volatility risk if price momentum fails to follow through.
Rising Long Positions Align with Bearish Structure
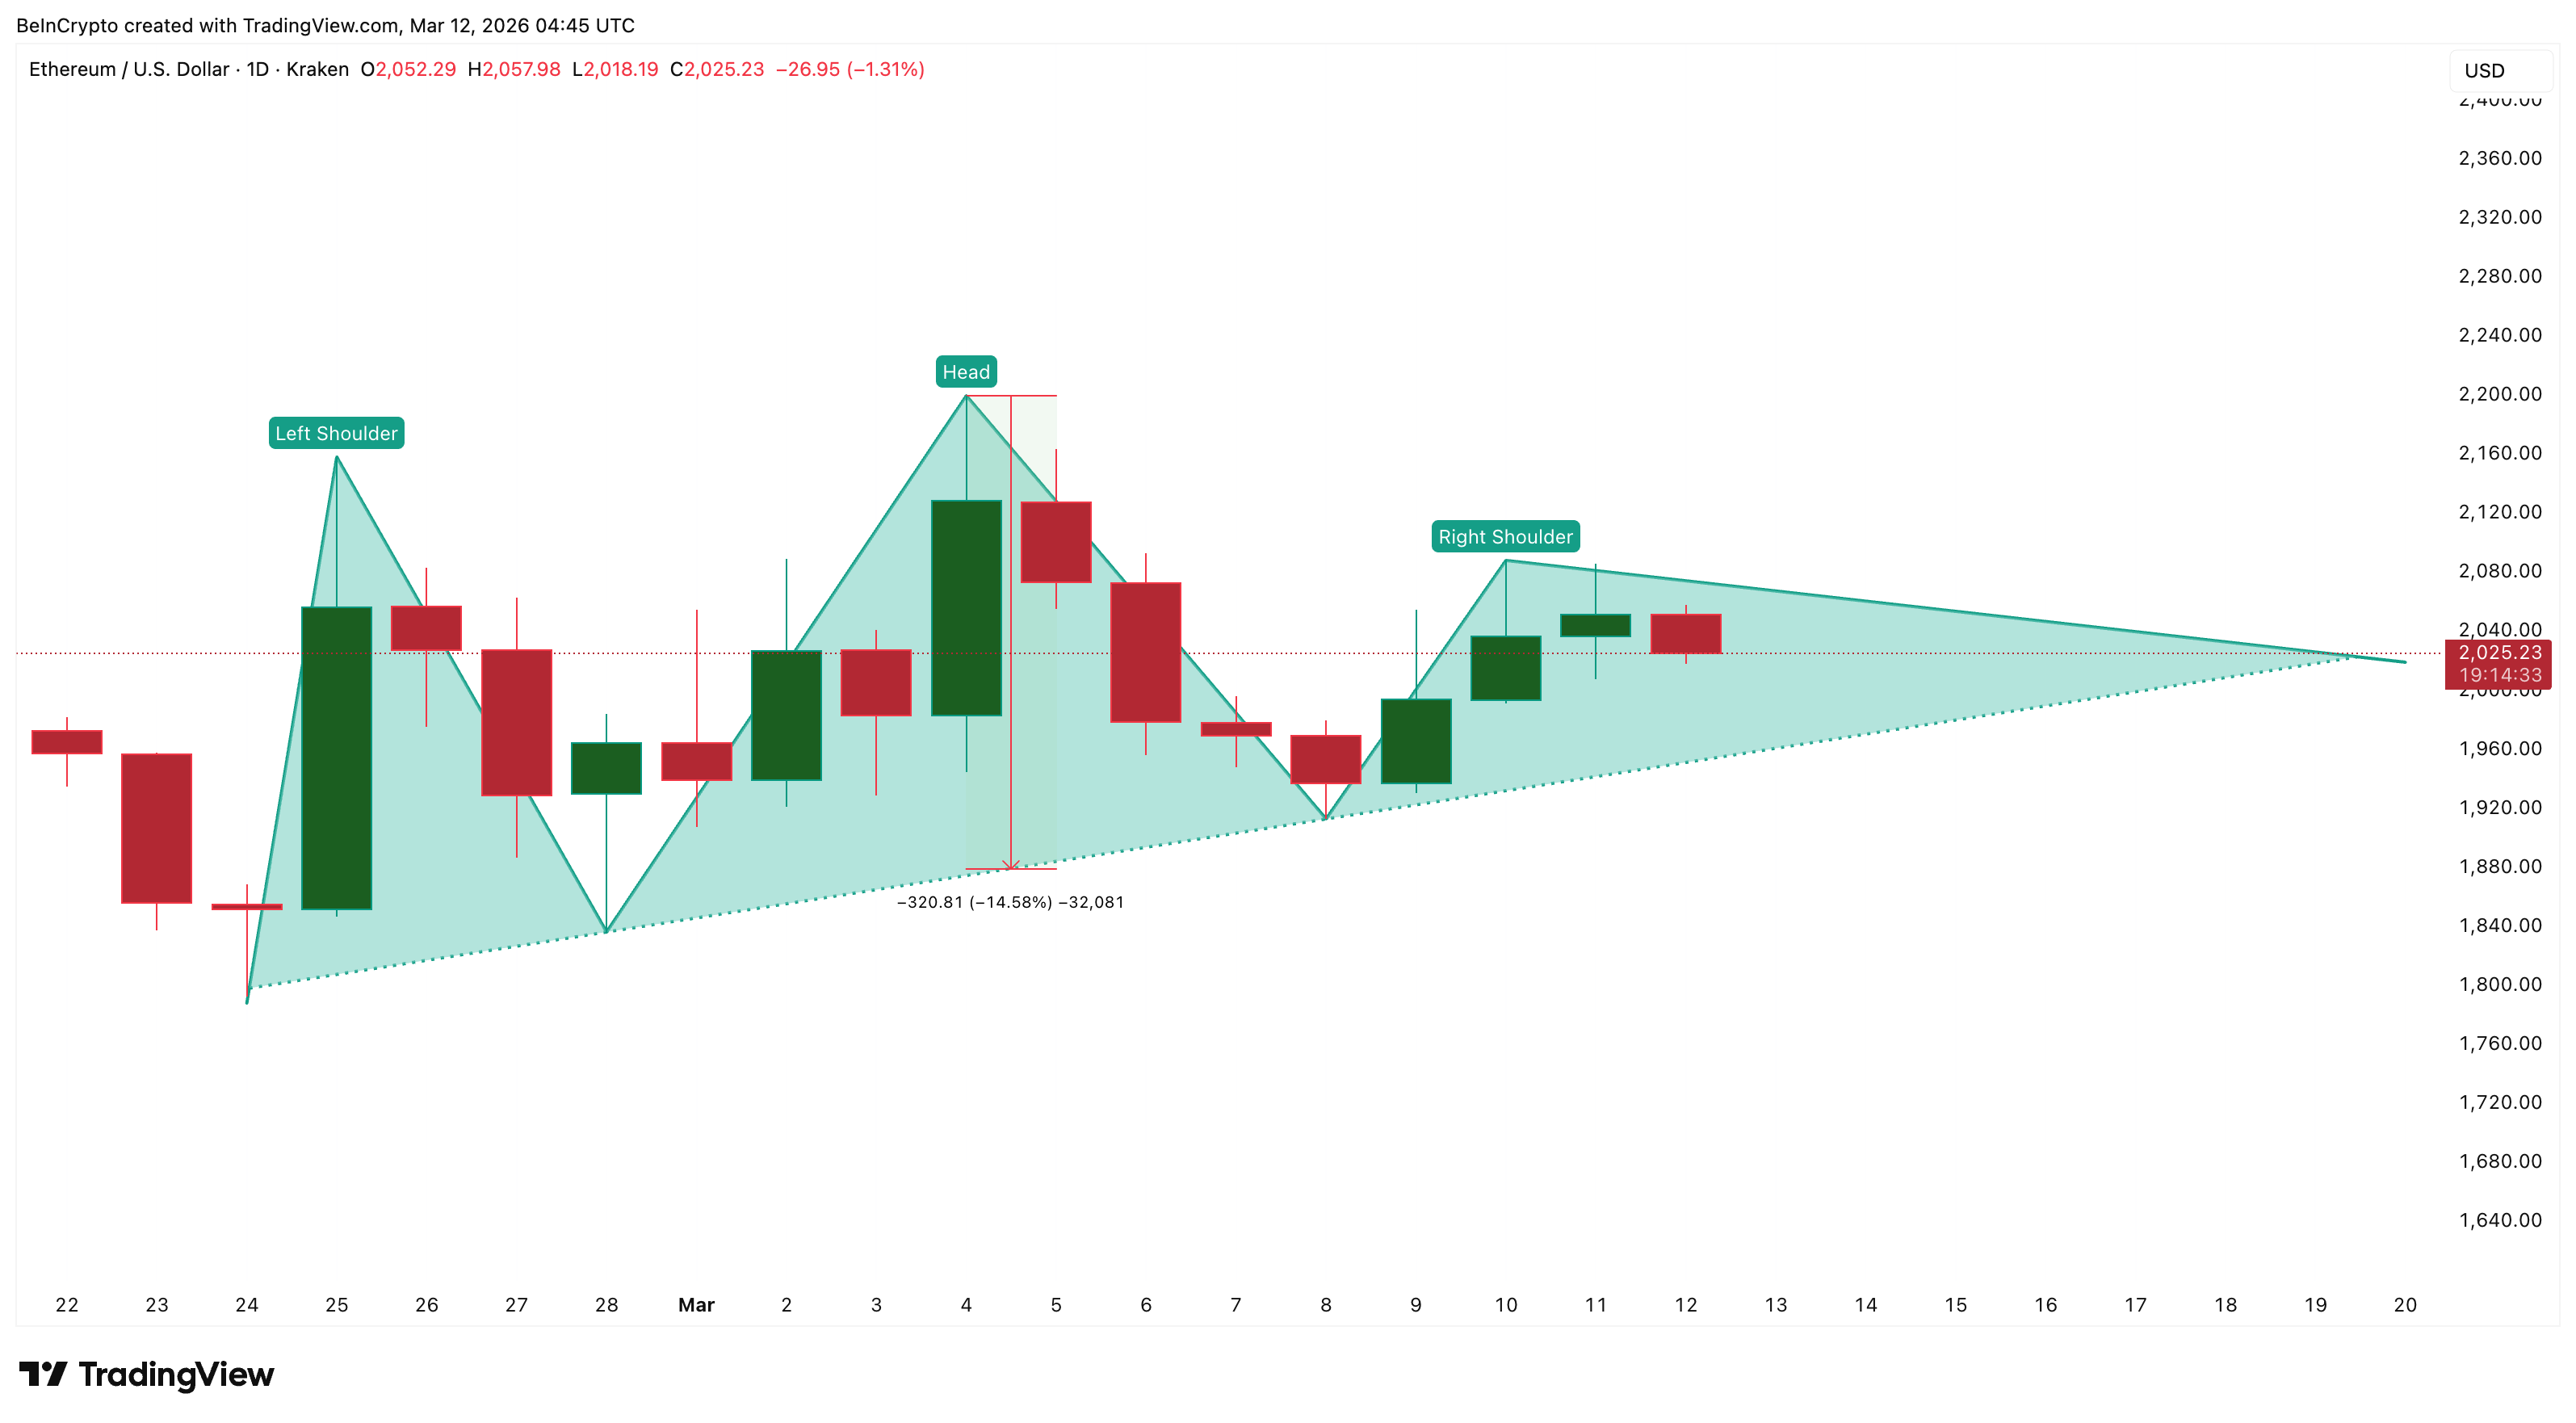
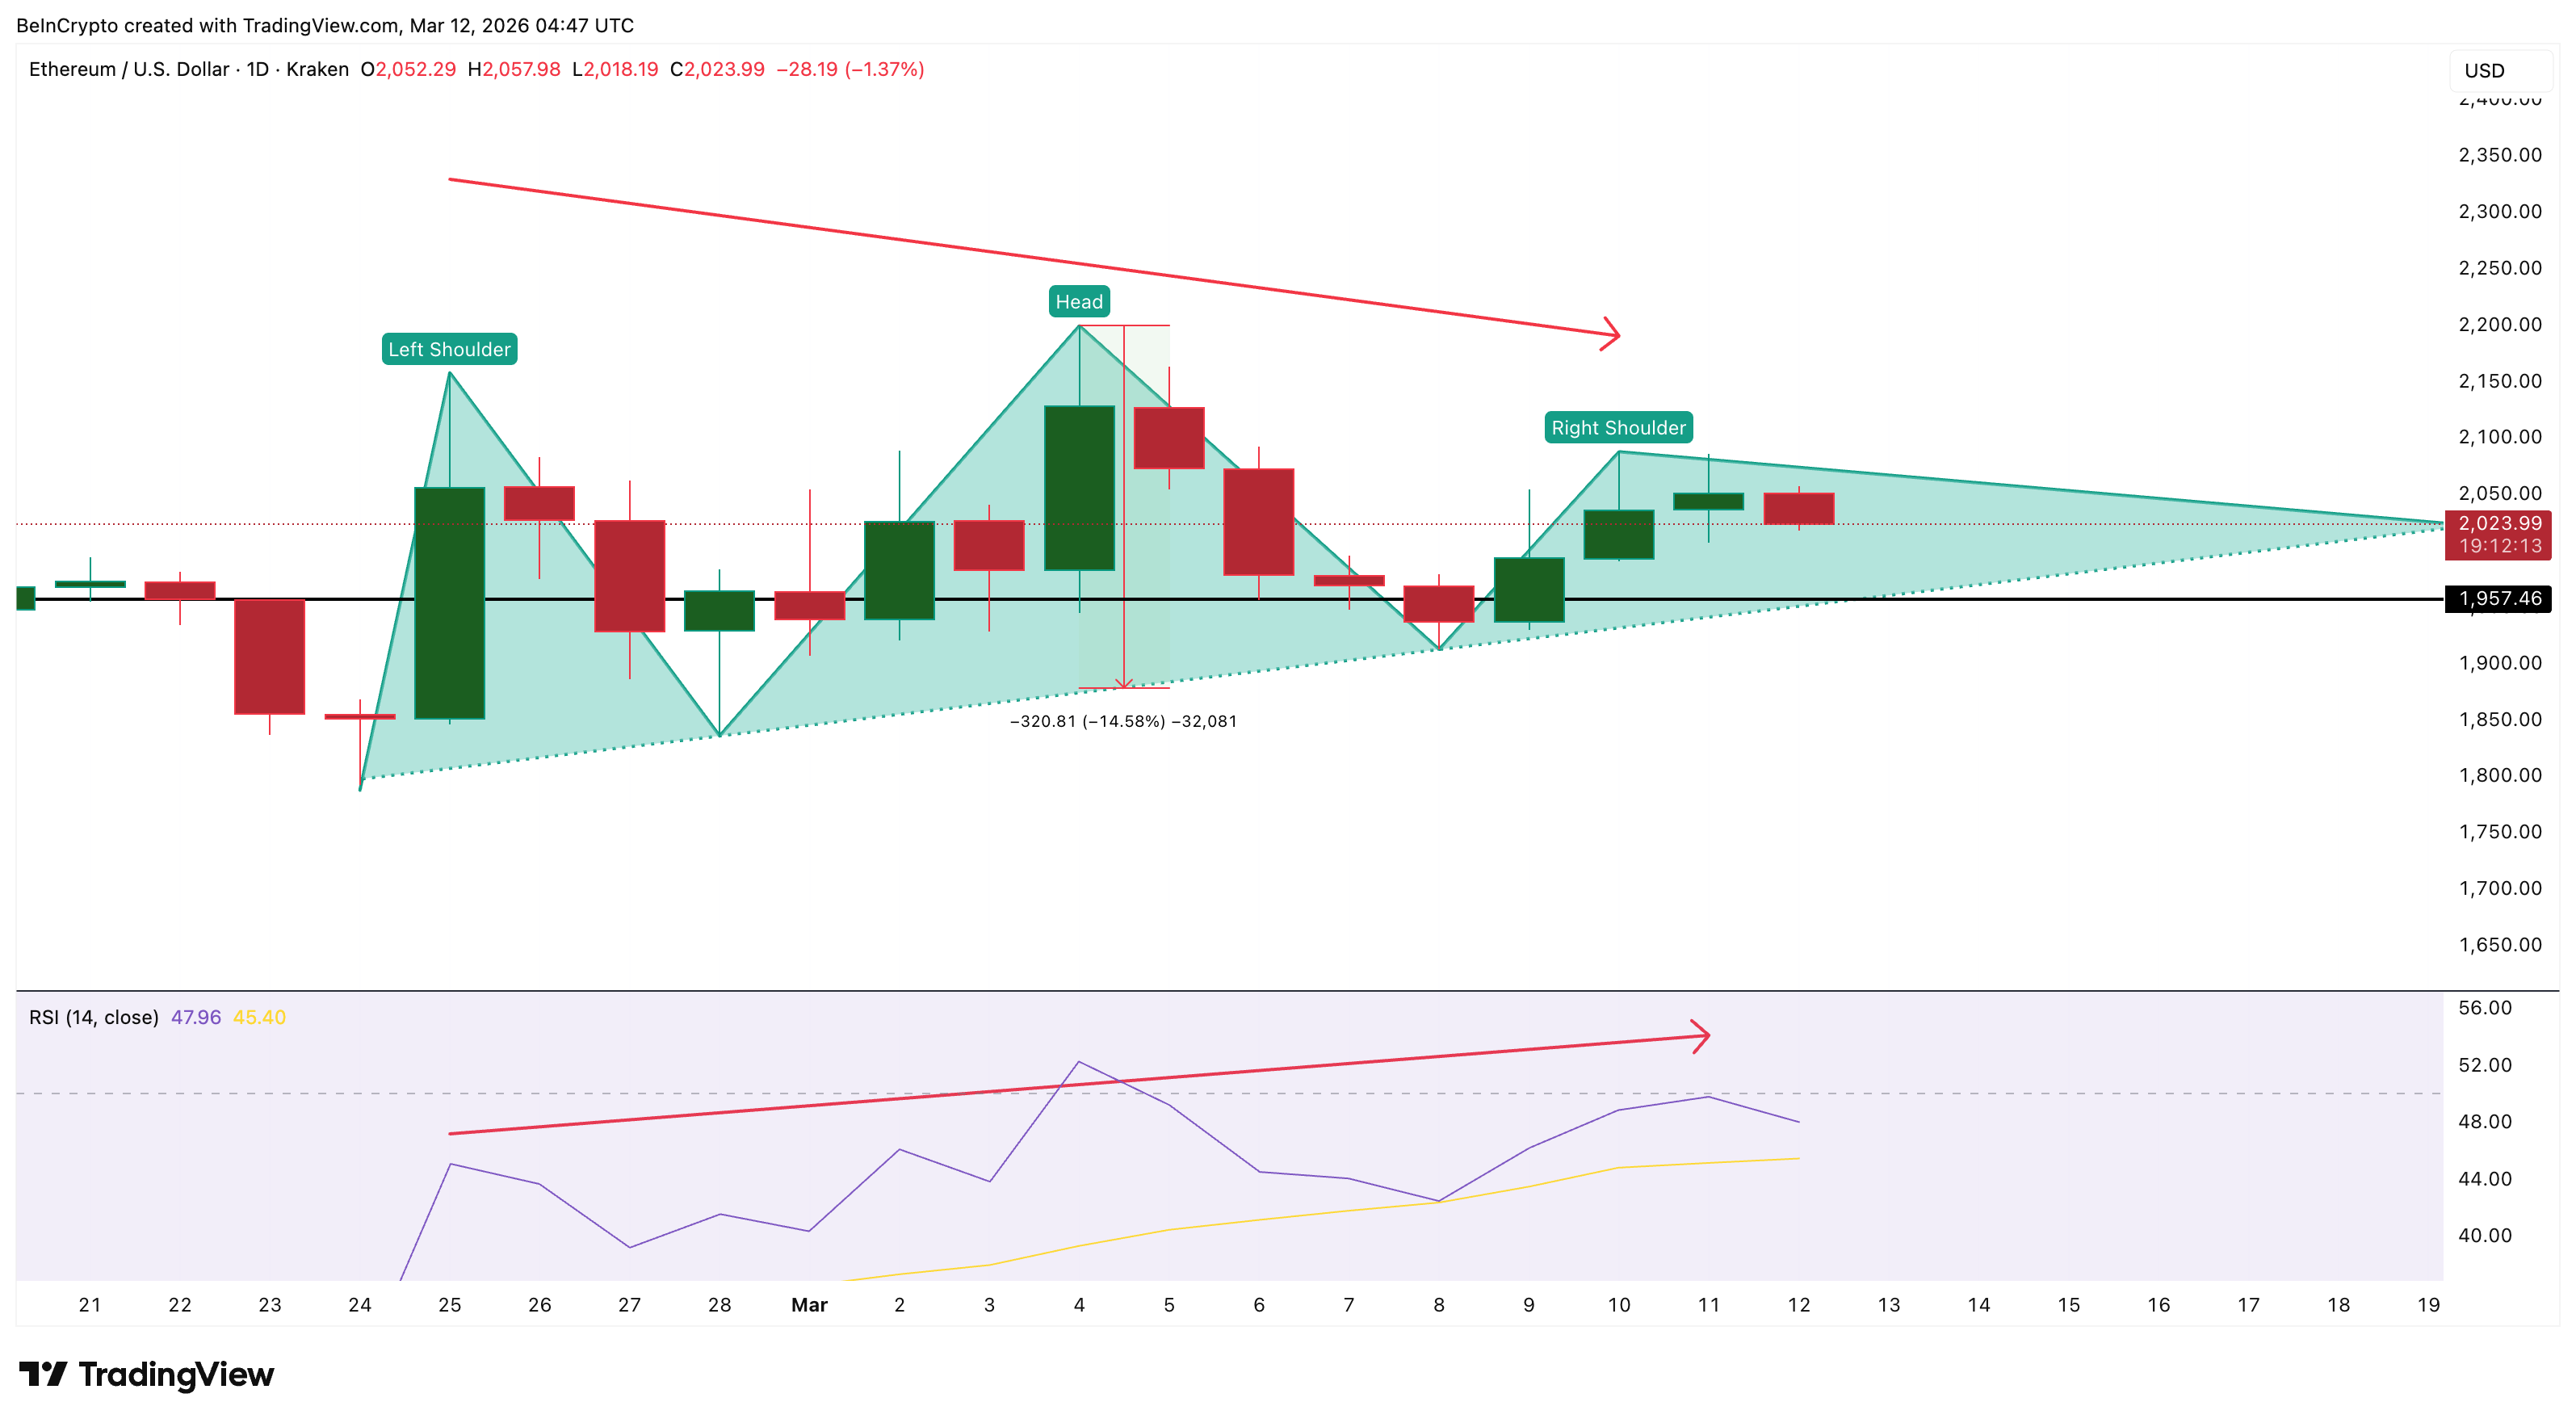
The derivatives positioning appears to be reflected directly in Ethereum’s price structure. On the daily chart, Ethereum price is forming a head-and-shoulders pattern with the right shoulder currently developing.
One unusual feature of this pattern is the upward-sloping neckline. An upward neckline typically forms when buyers repeatedly step in during pullbacks, pushing each support level slightly higher than the previous one. This behavior aligns with the derivatives signals.
As funding rates recover and long positions increase, buyers appear to be stepping in more aggressively during dips. That buying pressure helps explain why the neckline of the head-and-shoulders structure continues to slope upward rather than forming a flat support level. However, this also creates a weak structure.
Because the neckline is rising, the exact breakdown level can shift depending on where the price meets the trendline. This makes the timing of a breakdown harder to predict, even though the broader bearish pattern remains intact. And the longs are now appearing inside the bearish pattern, adding to the downside squeeze risk.
Divergence Suggests ETH Price Momentum Is Weakening
Momentum indicators are also showing early warning signals.
Between the left shoulder and the right shoulder of the pattern, the Ethereum price has formed a lower high, indicating that the most recent rally failed to match the strength of the earlier peak. At the same time, the Relative Strength Index or RSI, a momentum indicator, printed a higher high during the same period.
This combination forms a hidden bearish divergence, which typically signals that the broader trend remains weak despite temporary rebounds. The divergence reinforces the derivatives setup.
While leverage and open interest are rising sharply, the Ethereum price itself is struggling to create stronger highs. This mismatch suggests the market may be relying more on speculative positioning than genuine spot demand.
Ethereum price has already declined roughly 4% over the past 30 days, highlighting that the broader trend has remained under pressure. The RSI divergence also reinforces the structural weakness and supports the risk of a pullback toward the neckline.
Ethereum Price Levels Show How the $1,800 Zone Could Come Back Into Focus
The head-and-shoulders structure now highlights a crucial support zone. Because the neckline slopes upward, the breakdown level shifts over time rather than remaining fixed. Currently, the neckline sits within a floating range between $1,970 and $1,940.
If the Ethereum price breaks this zone, the bearish structure could activate.
The projected move from the pattern suggests a decline of roughly 15% from the neckline level. While the full measured target from the neckline points closer to $1,680, the $1,800 level becomes the first major downside objective if support fails. However, the bearish setup can still be invalidated.
The ETH price would need to move above $2,080, which corresponds to the right shoulder resistance, to begin weakening the pattern.
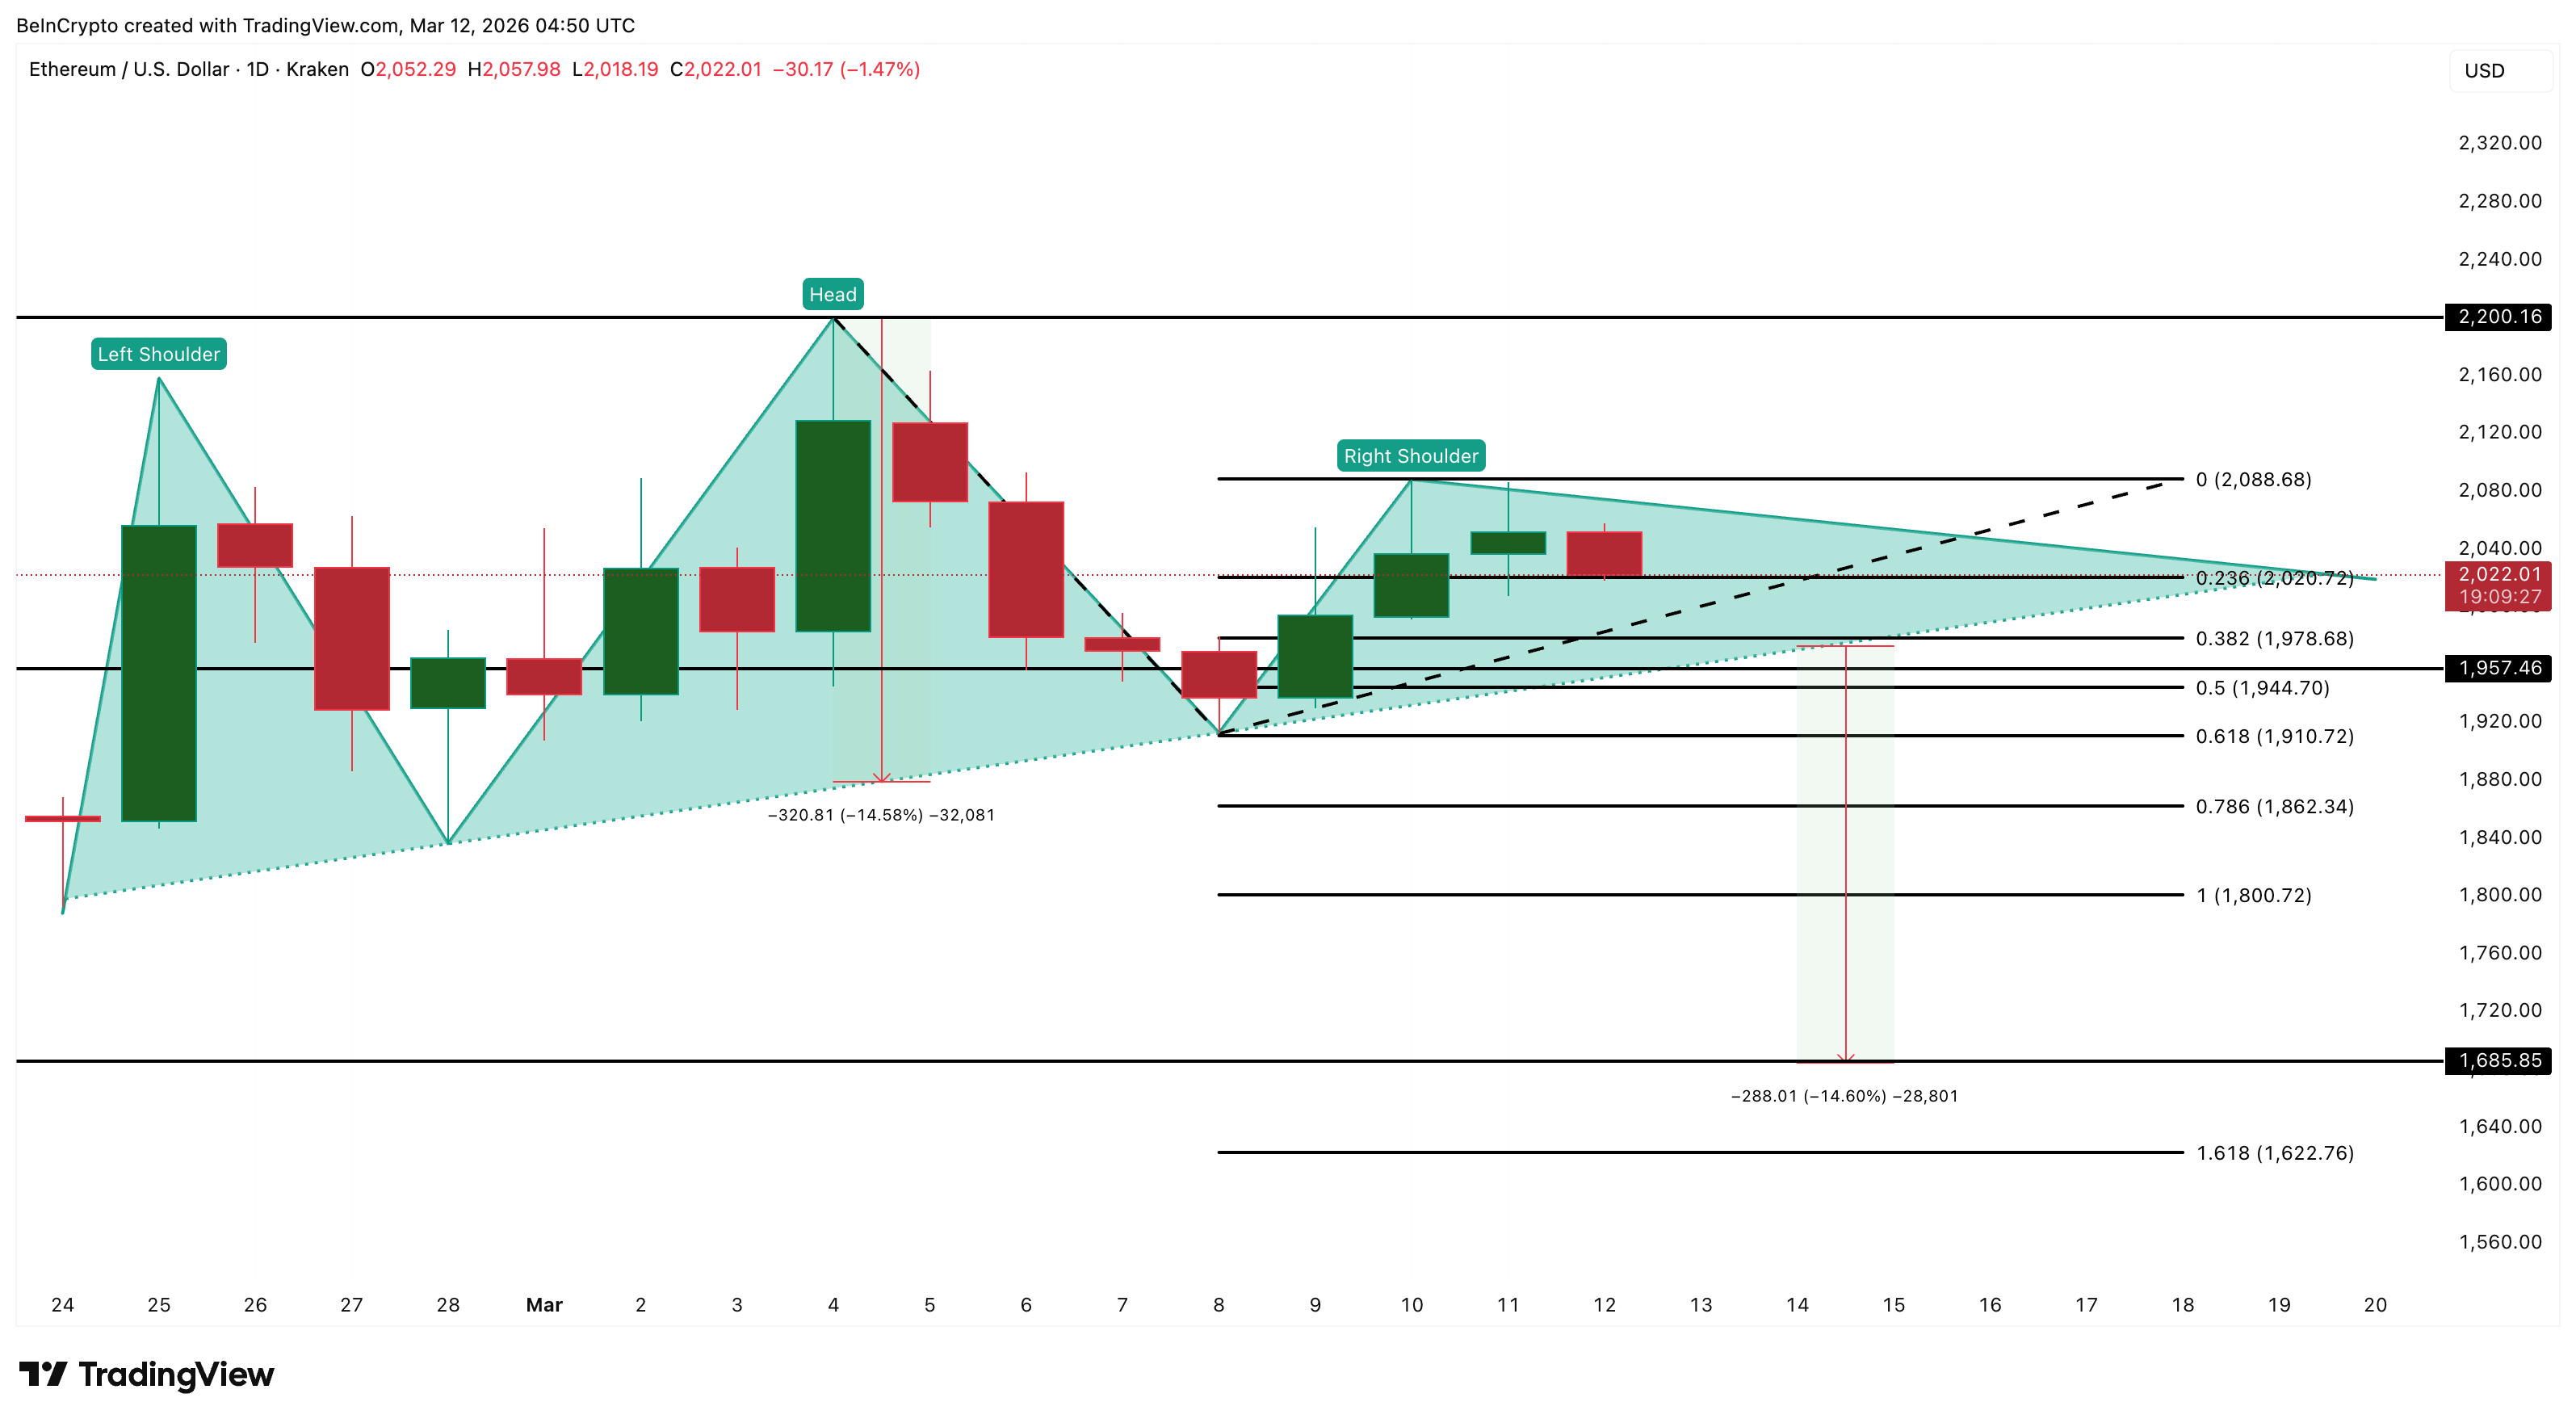
A stronger breakout above $2,200 would invalidate the head-and-shoulders formation entirely and signal that bullish momentum has returned.
Until that happens, the combination of record leverage, rising open interest, hidden RSI divergence, and a bearish pattern suggests Ethereum price may remain vulnerable to a deeper correction.
The post Ethereum’s New Lifetime Record Carries Bearish Undertones, Puts $1,800 Back in Focus appeared first on BeInCrypto.