
Ethereum price is up nearly 4% over the past seven days, showing fresh strength after months of pressure. That move stands out because ETH is still down roughly 33% over the past three months, keeping the broader trend firmly bearish until now.
The latest bounce has finally broken that bearish structure. But just as the trend flips, a new risk is starting to surface, one that could decide whether this breakout holds or stalls. Debunking that risk requires a 10% upmove.
Ethereum Breaks a Bearish Structure, but Momentum Is Not Fully Clean
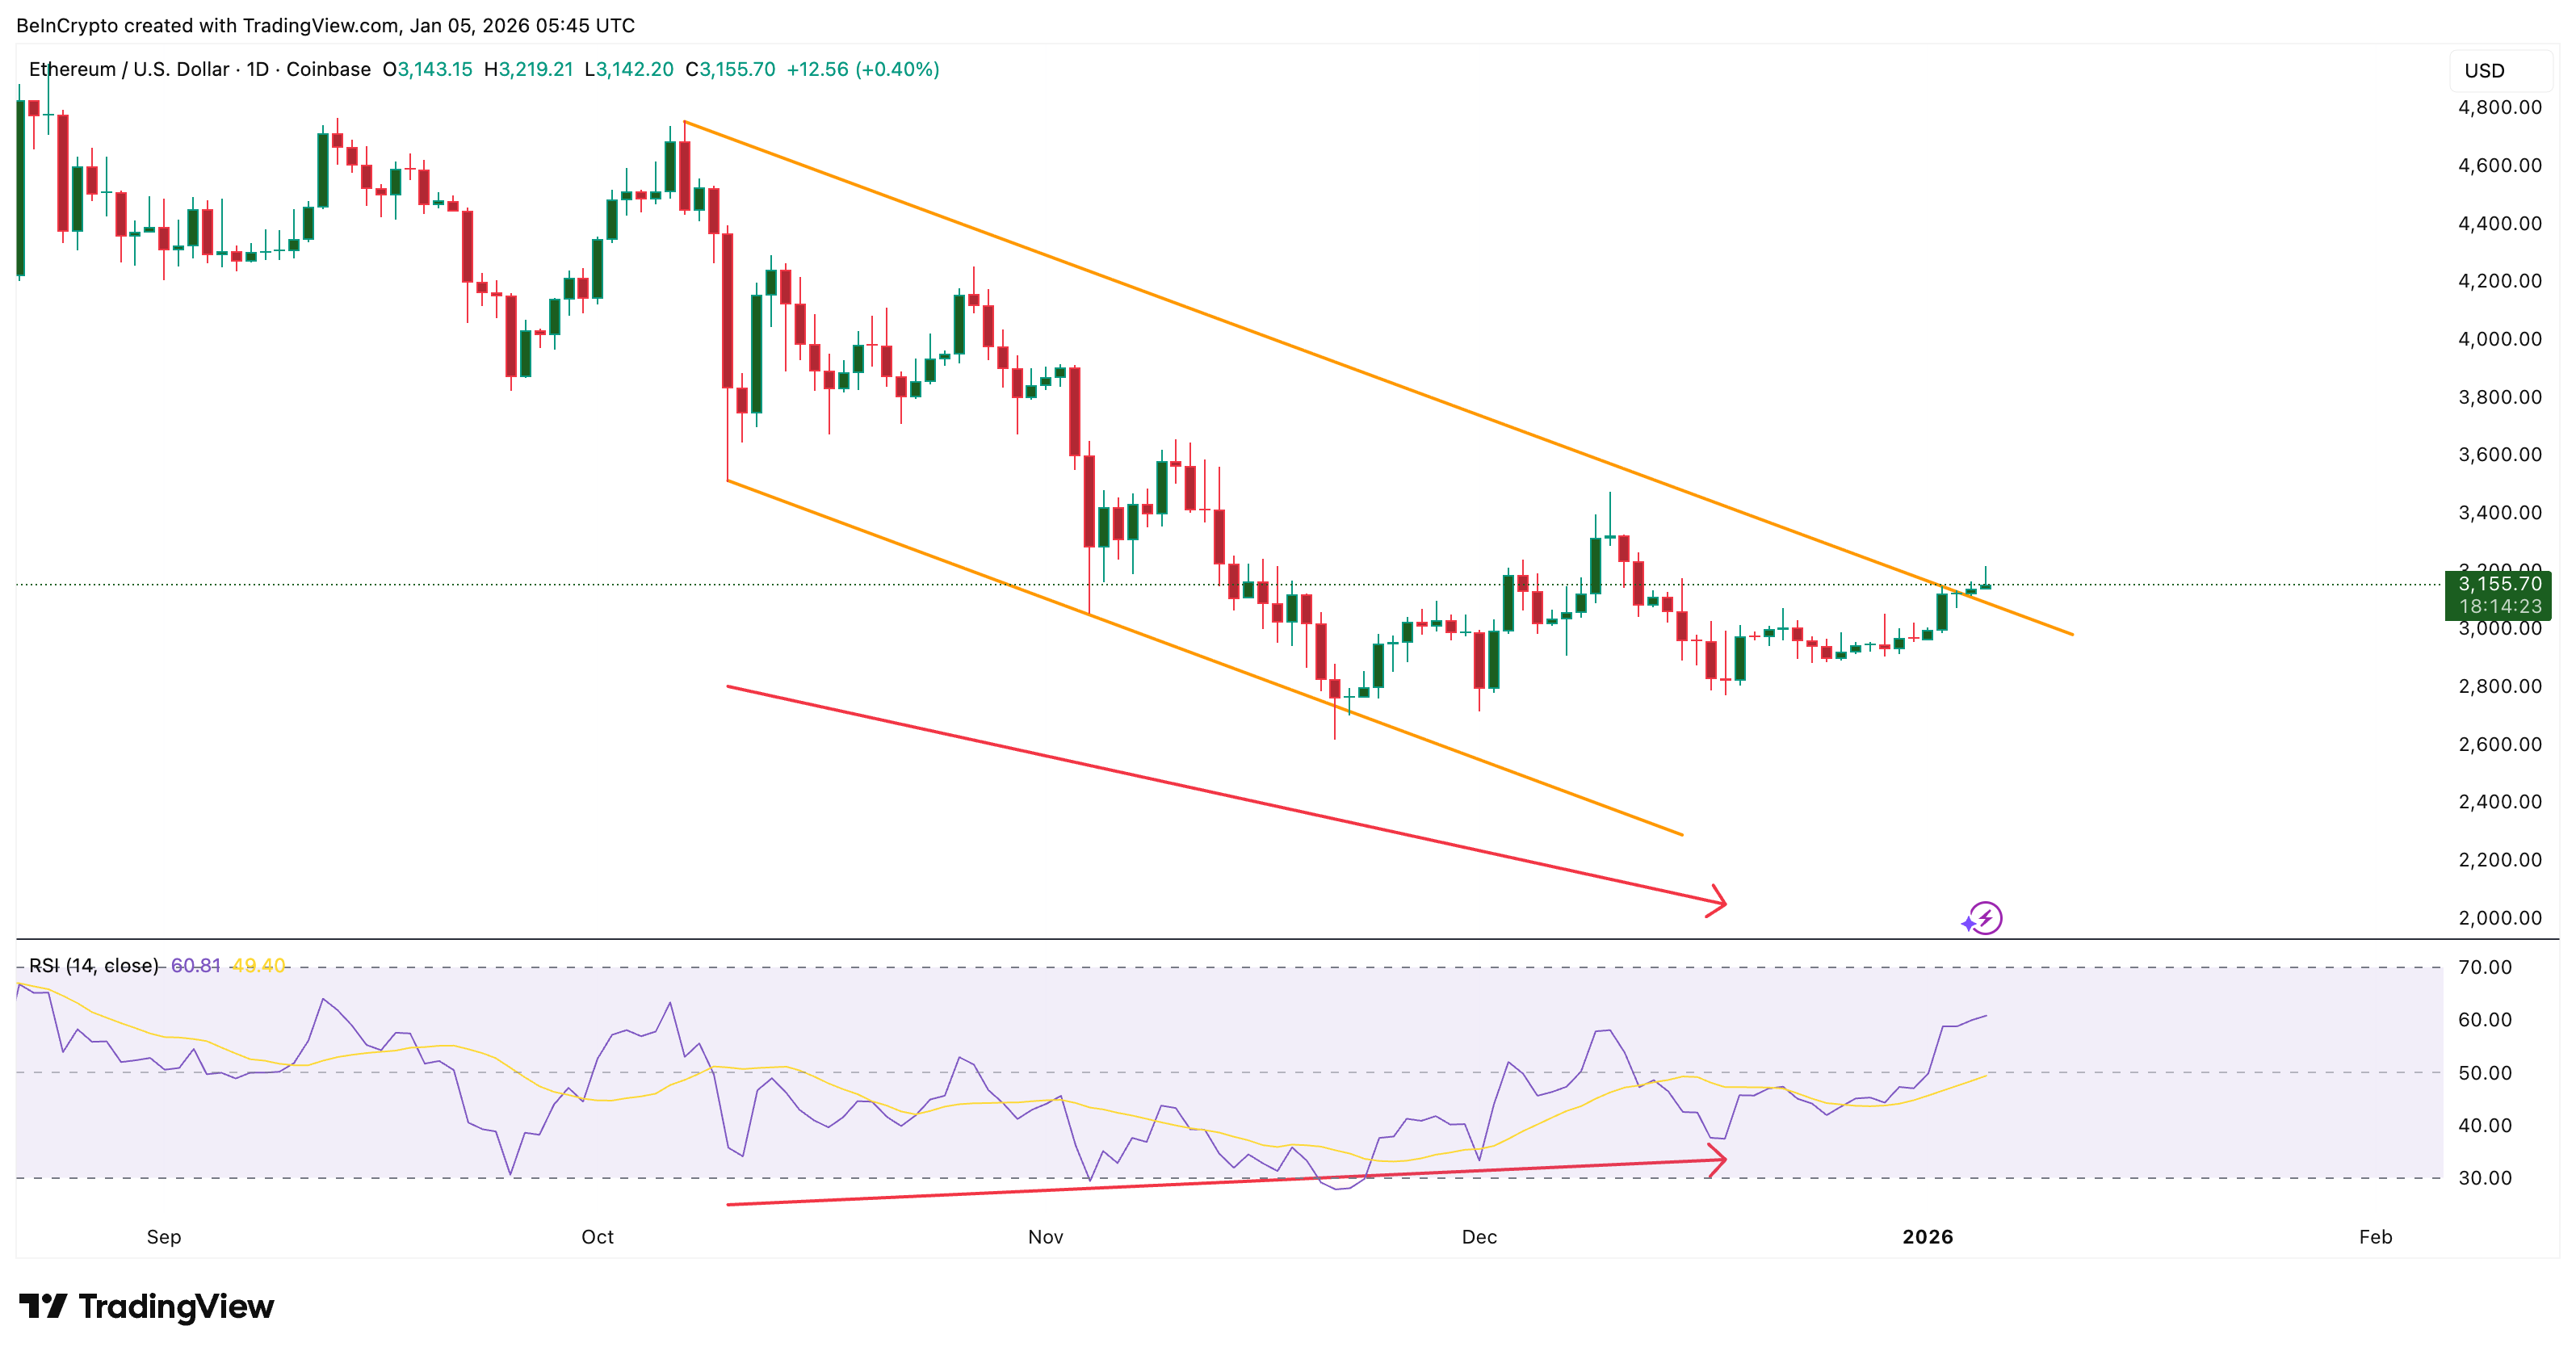
Ethereum had been trading inside a descending channel since early October, a structure that reflects a controlled bearish trend where each bounce fails lower than the last. This week, the price finally pushed above the upper trendline, signaling that the bearish structure has been broken.
That breakout did not happen randomly. Between October 10 and December 18, the Ethereum price made a lower low, while the Relative Strength Index (RSI) made a higher low. RSI measures momentum. When price falls, but RSI rises, it often signals that selling pressure is weakening. This bullish divergence helped set up the trend reversal.
Want more token insights like this? Sign up for Editor Harsh Notariya’s Daily Crypto Newsletter here.
However, the reversal is not without friction.
Between December 10 and January 5, the Ethereum price is forming a lower high (still incomplete), while the RSI is forming a higher high.
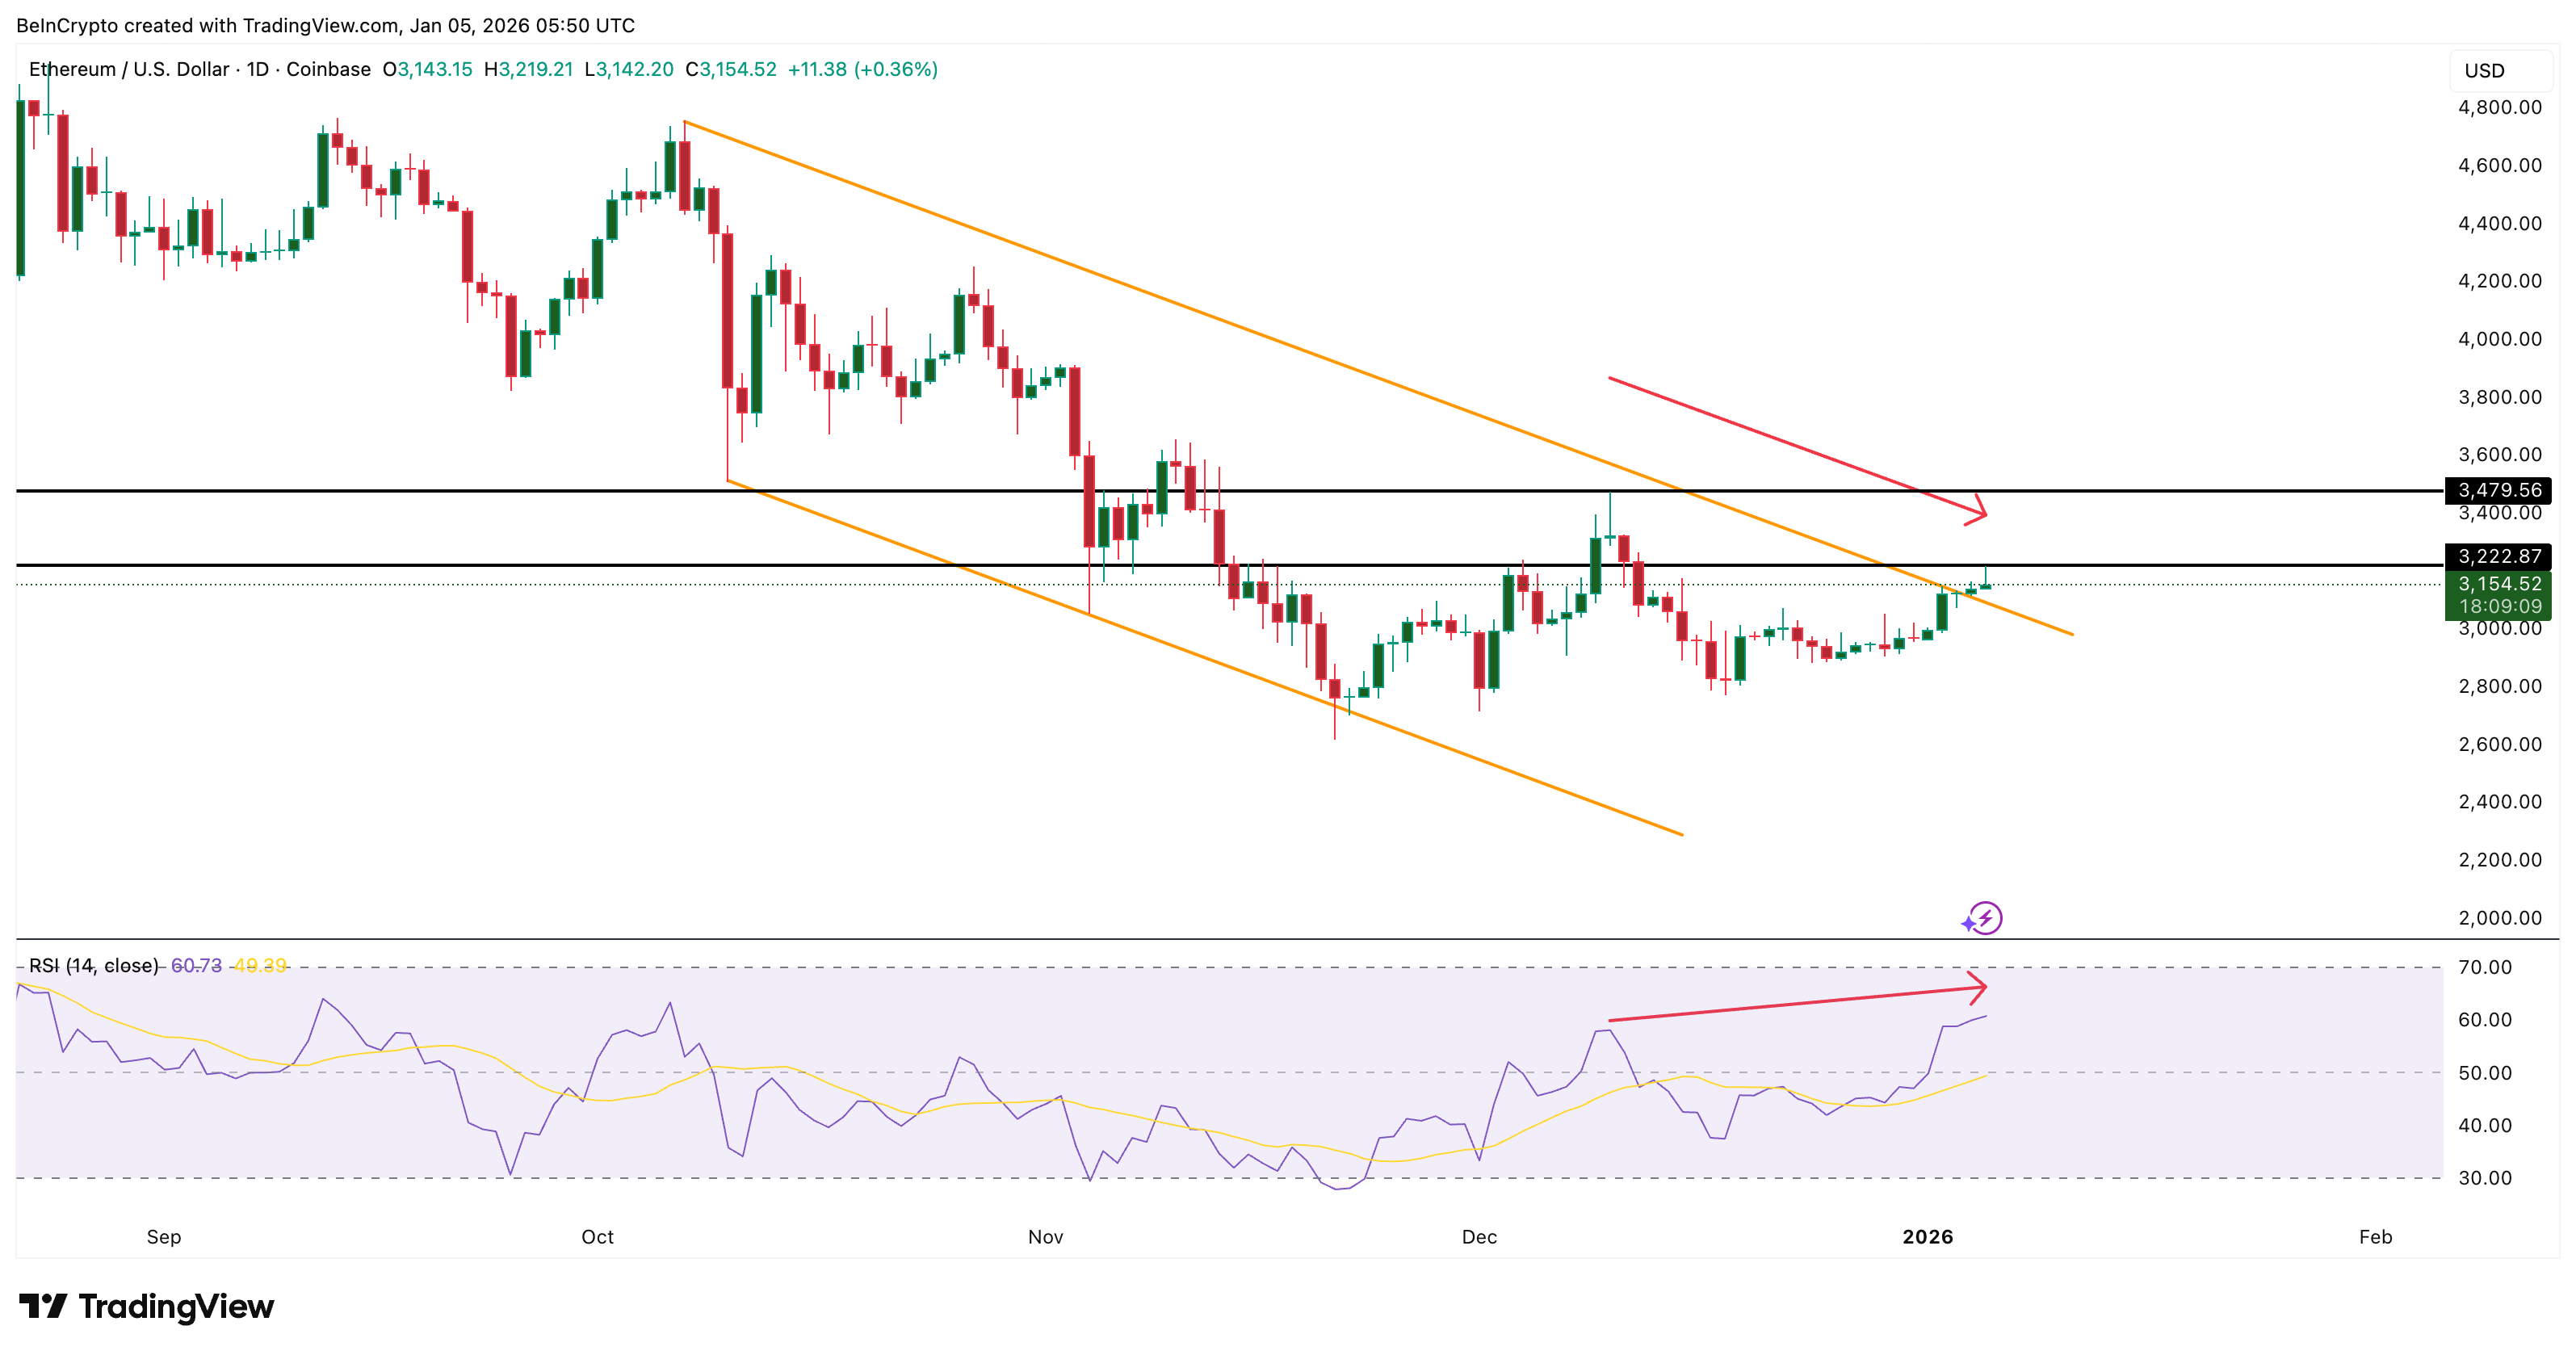
This creates a hidden bearish divergence, which usually points to consolidation or a pullback rather than a full trend failure. If the next candle forms under $3,220, it would confirm the bearish pattern.
This indicates that Ethereum has reversed the bearish trend, but it has not yet fully demonstrated its strength.
Derivatives Risk Is High, Even as Whales Step In
The biggest short-term pullback risk comes from derivatives positioning.
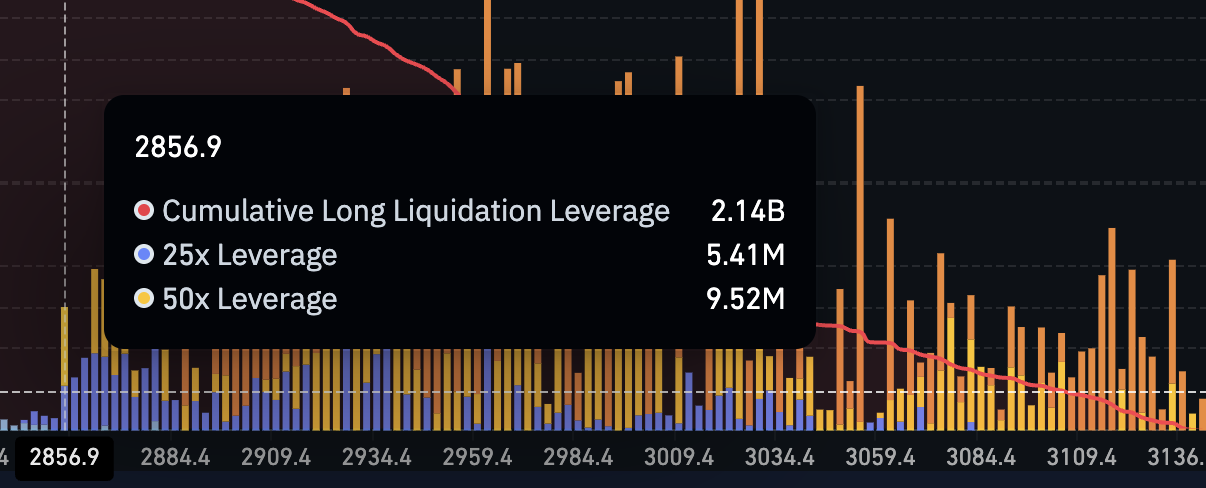
On the Binance ETH/USDT liquidation map, long liquidation leverage sits near $2.20 billion, while short liquidation leverage is just around $303 million. Long exposure is more than seven times larger than short exposure. When positioning becomes this one-sided, even a small pullback can trigger forced selling.
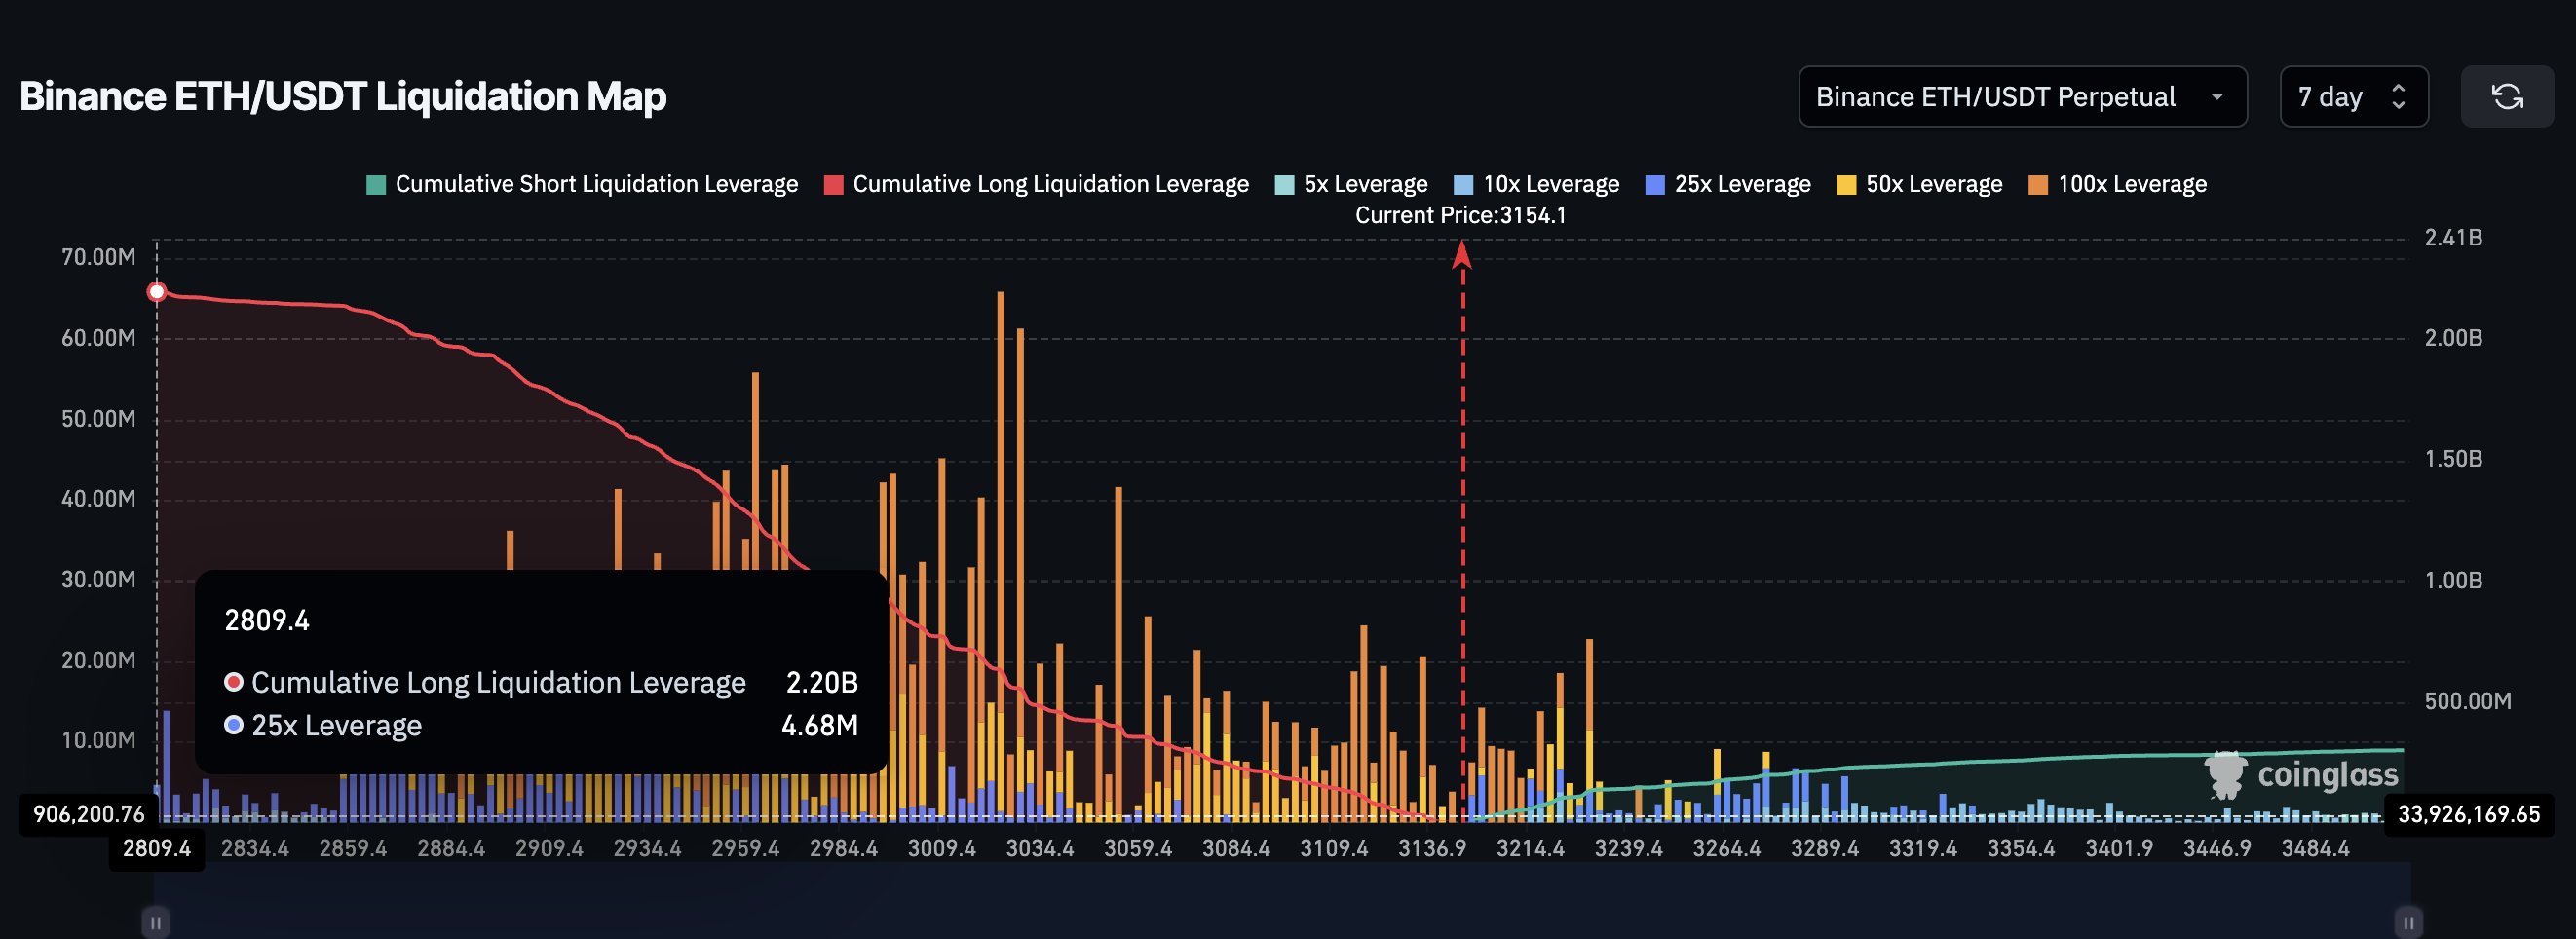
The thickest liquidation clusters show that long liquidations begin around $3,150 (current price) and extend down toward $2,850 (visible on the price chart), which has acted as strong support since early December. A sharp move into this zone could trigger a cascade, potentially dragging the Ethereum price lower.
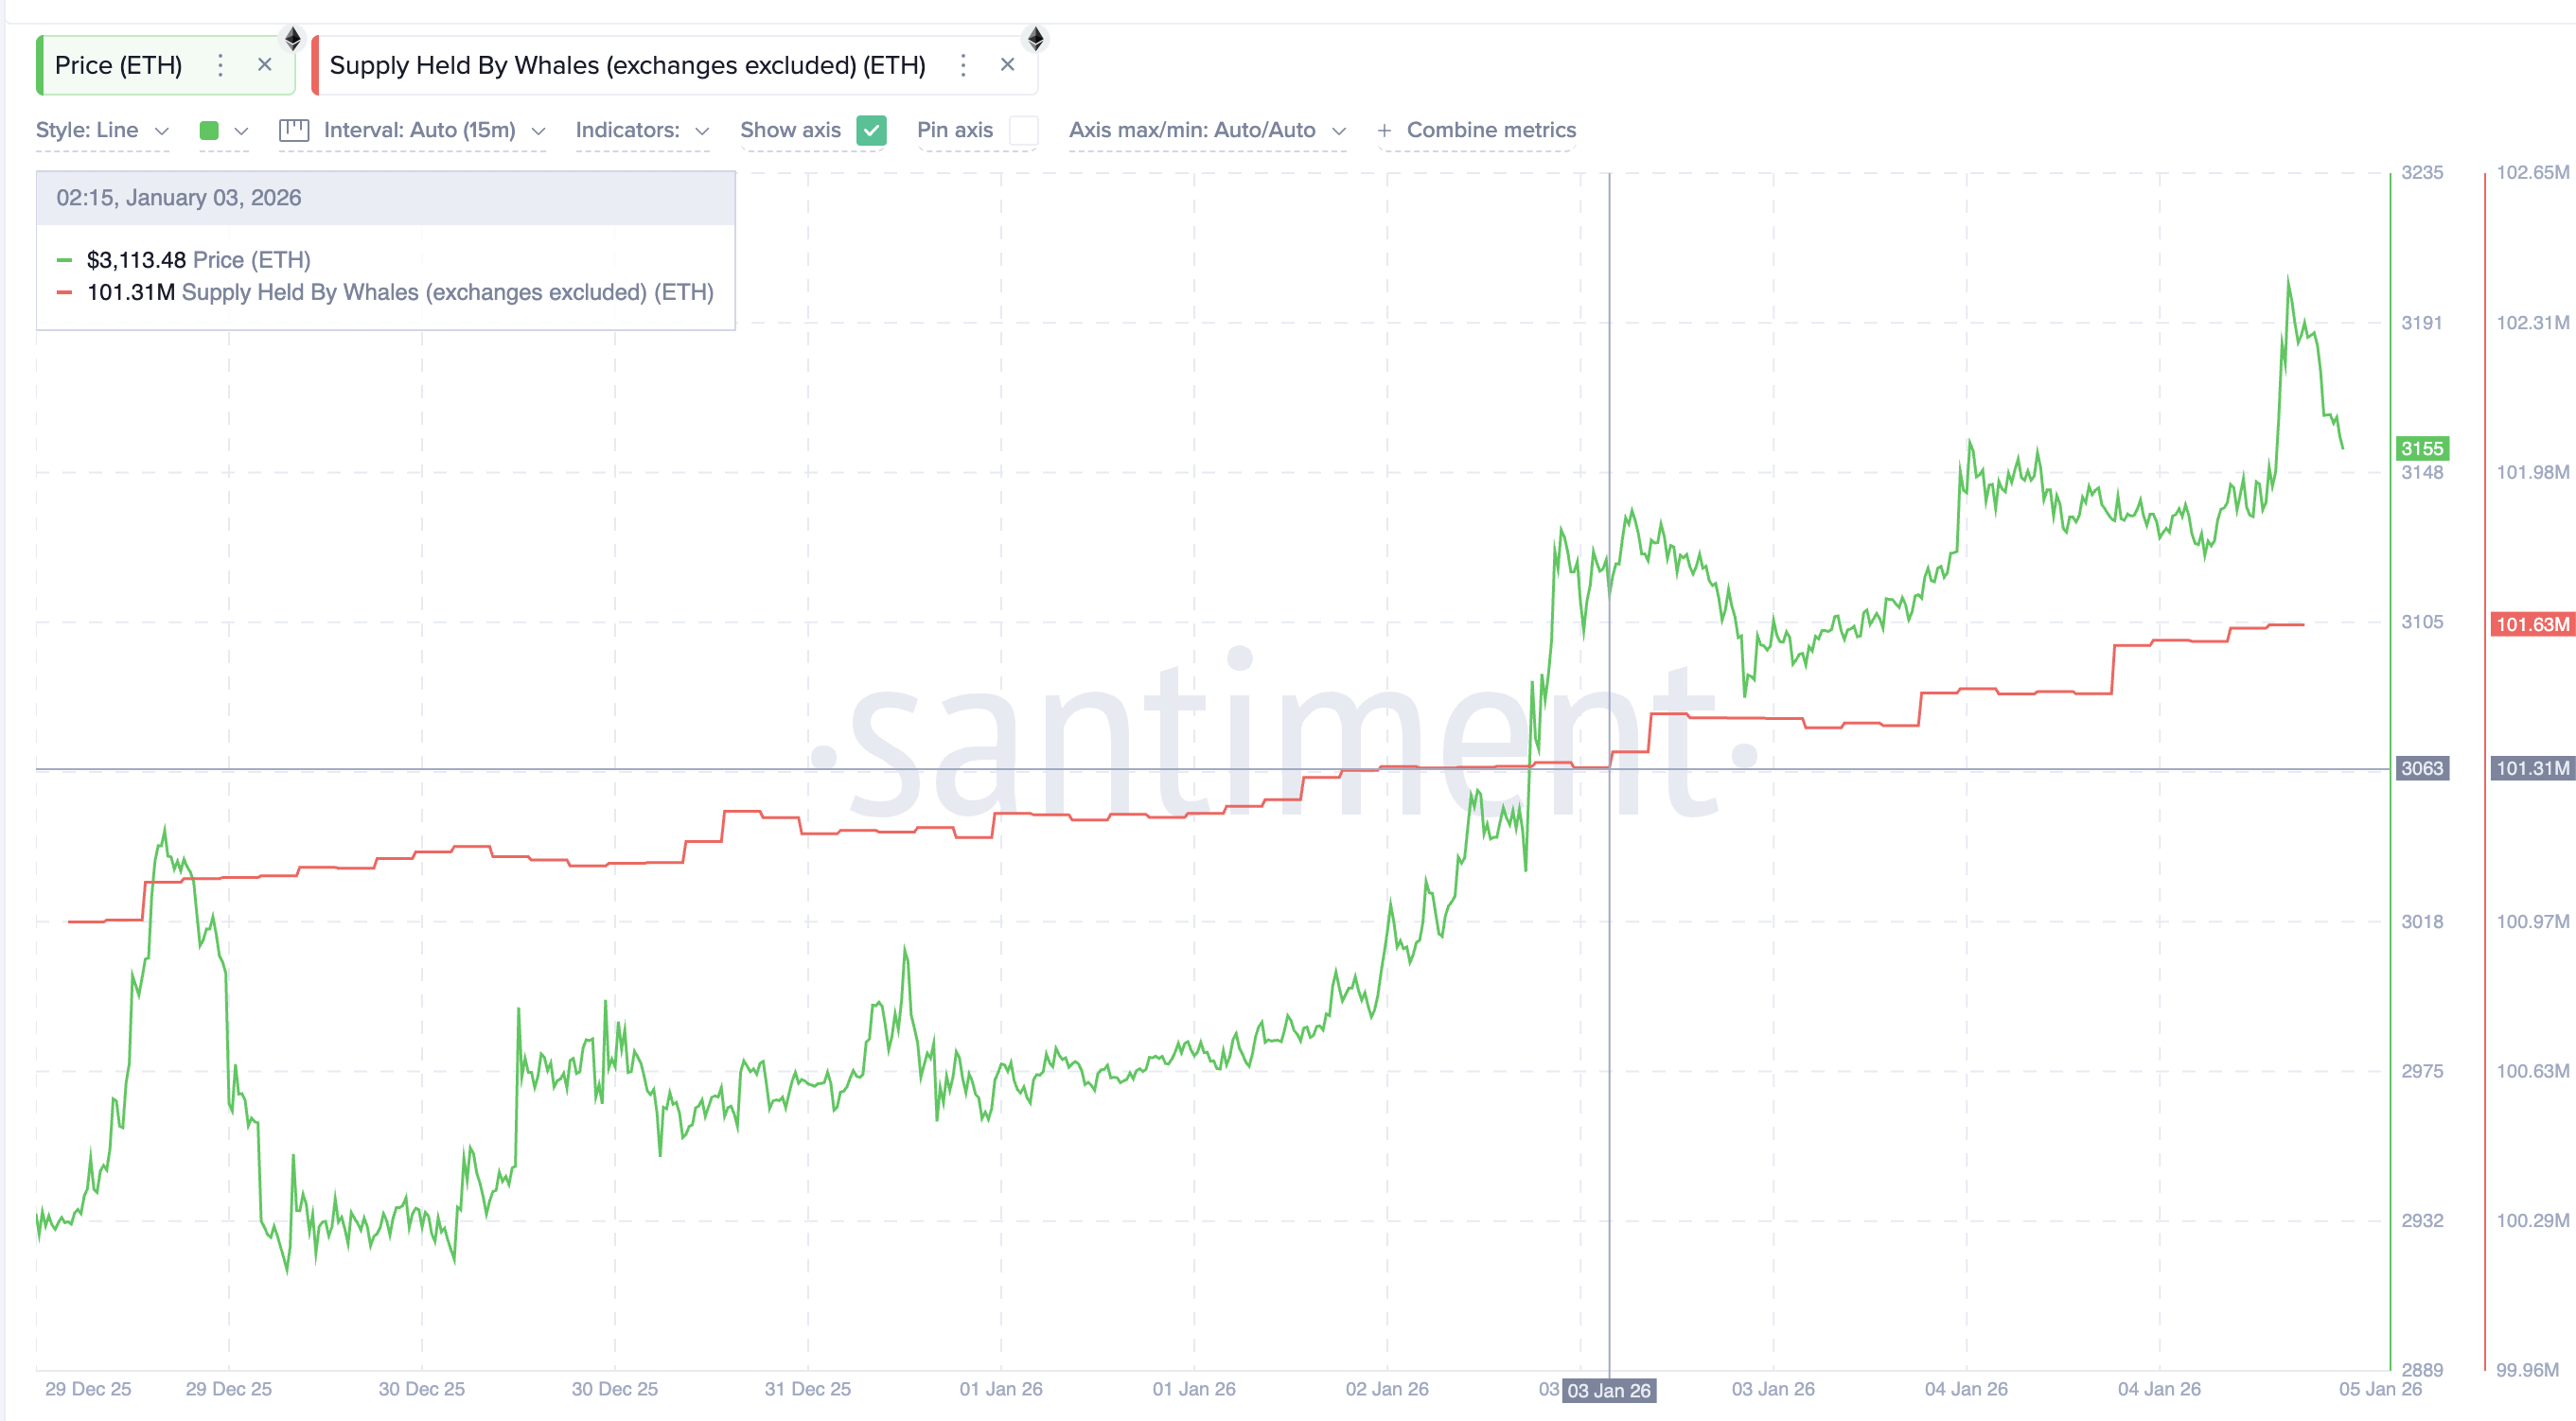
Whales, however, are leaning the other way, showing strength across the spot markets.
Over the recent weekend alone, Ethereum whales increased their holdings from 101.31 million ETH to 101.63 million ETH, adding roughly 320,000 ETH. At the current price, that accumulation is worth about $1.0 billion. This suggests large holders are positioning for upside rather than preparing to exit.
Still, whale accumulation does not remove liquidation risk. It only offsets it.
The 10% Test That Decides The Next Ethereum Price Move
Ethereum price levels now matter more than narratives.
Ethereum is currently trading inside the same $3,220 to $2,850 range that has defined price action since early December. As long as ETH remains inside this band, liquidation risk stays elevated.
A move above $3,470 would be critical. That level represents roughly a 10% rally from current prices and would invalidate the hidden bearish divergence by pushing the price to a higher high. Clearing it would also move Ethereum away from the densest long-liquidation cluster.
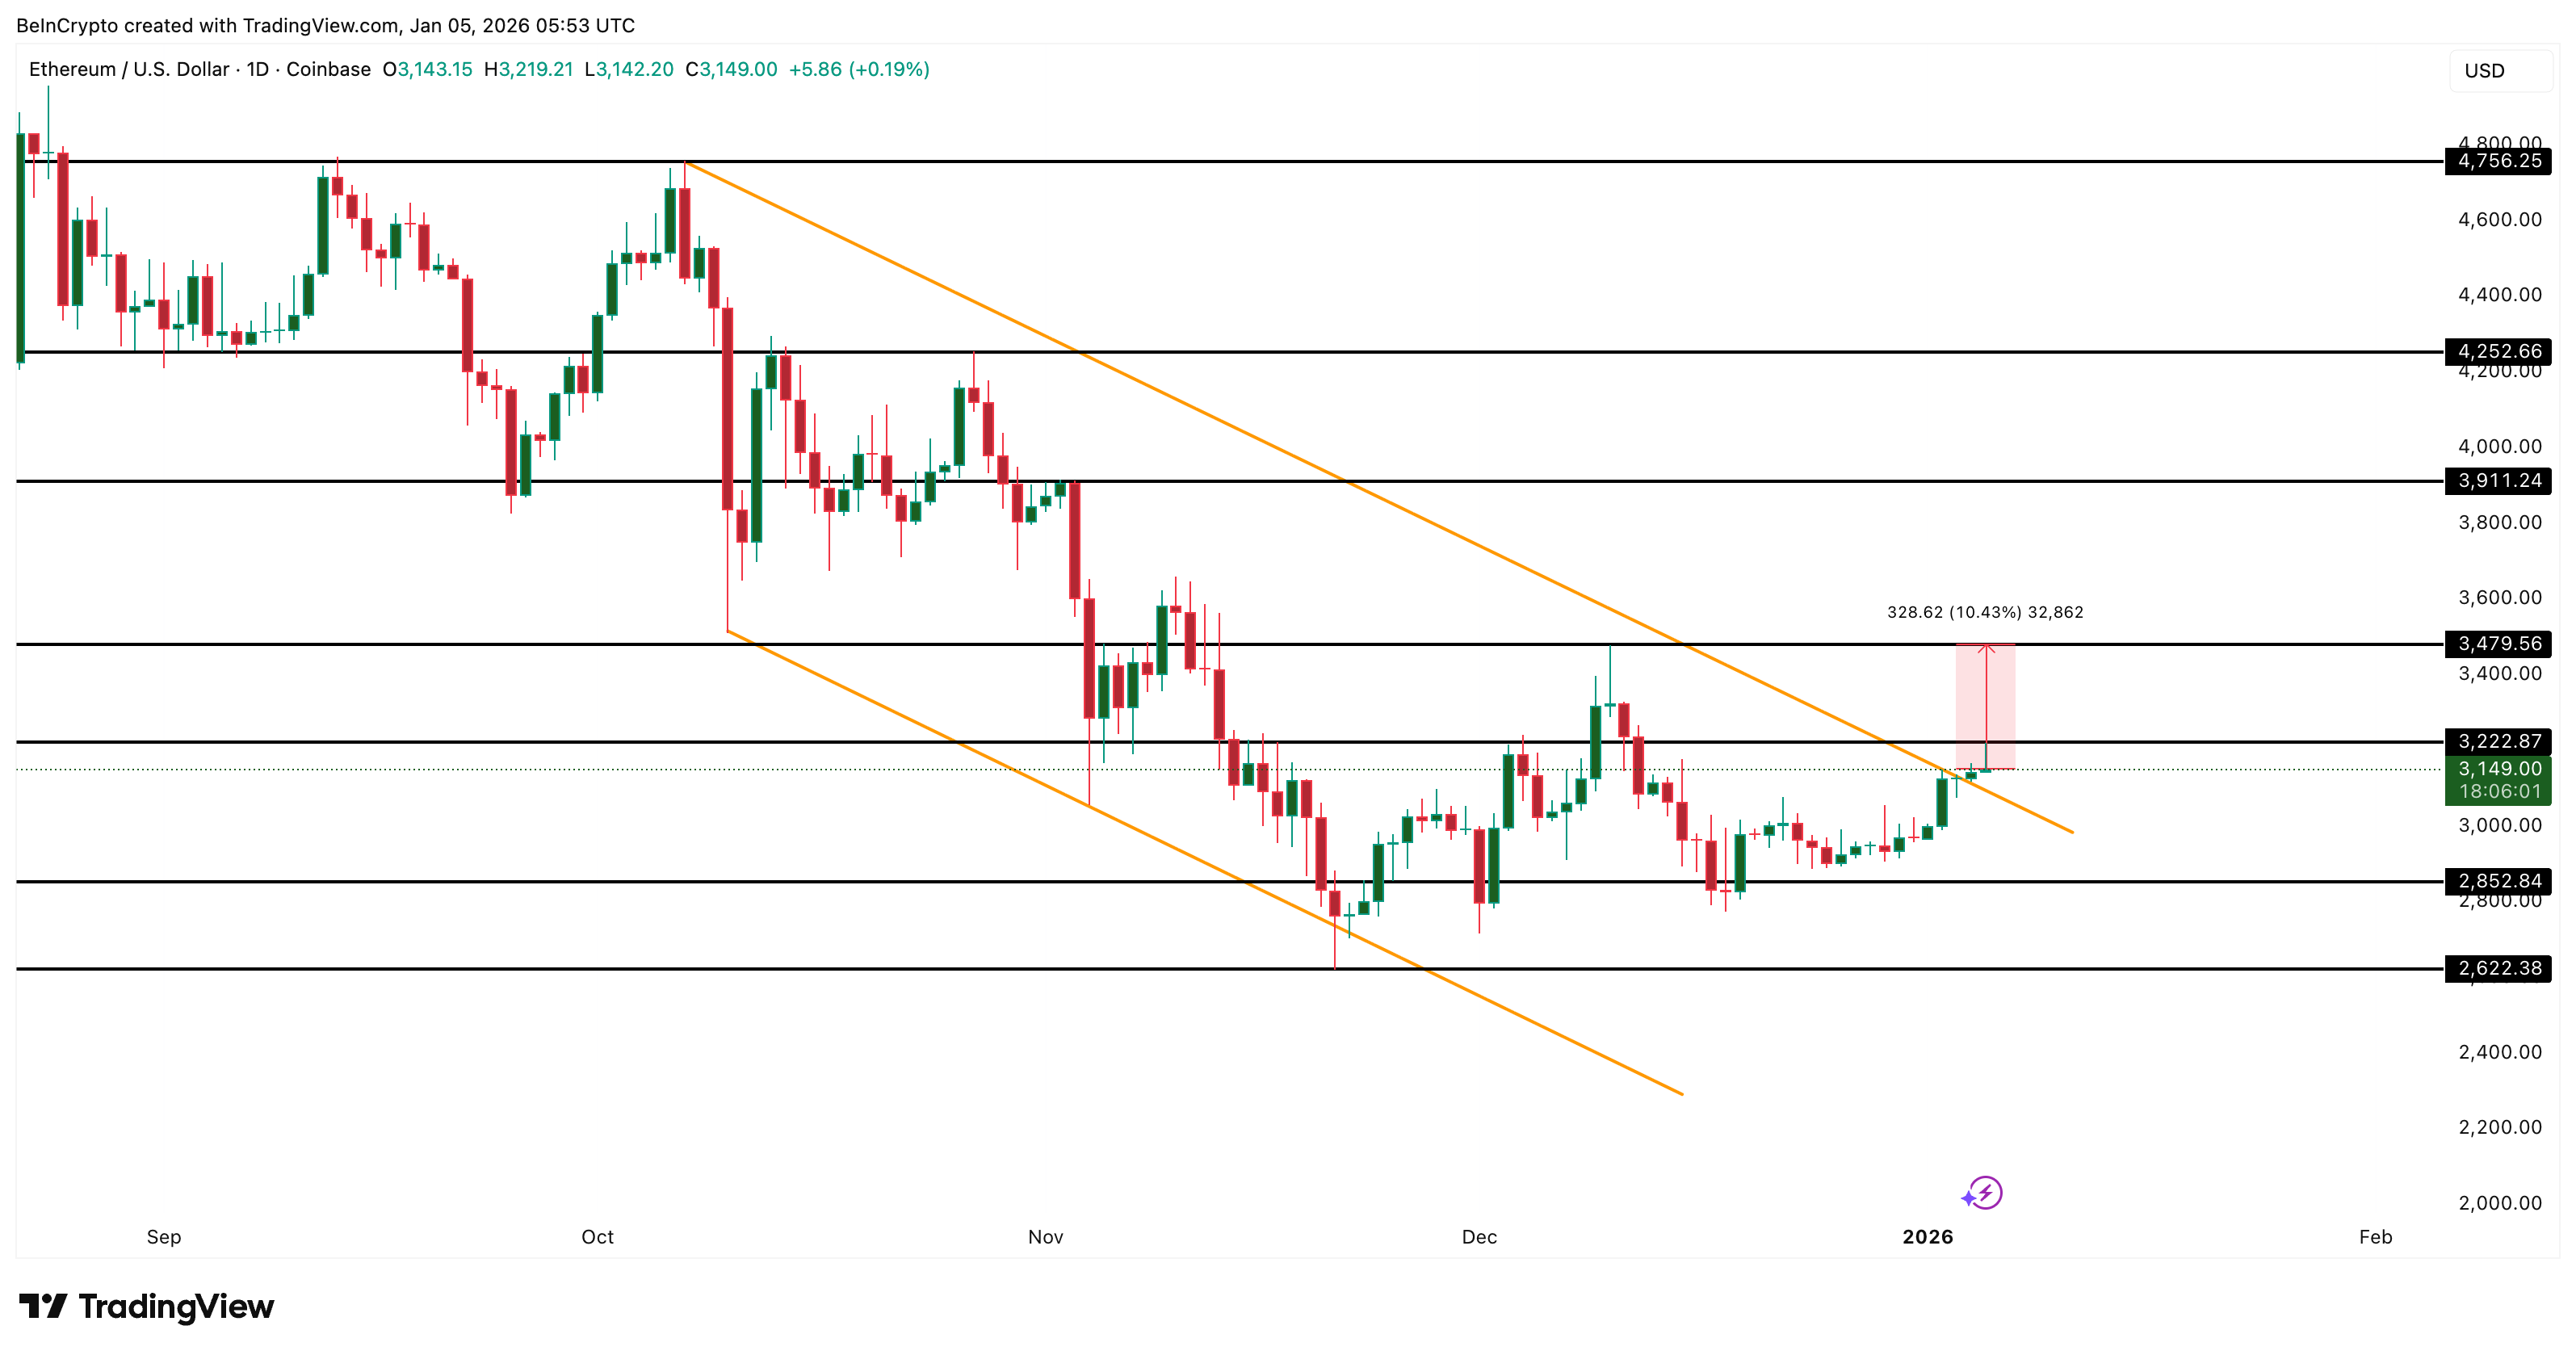
If that happens, Ethereum could open the door toward $3,910, followed by $4,250 if momentum builds further. On the downside, losing $2,850 would weaken the reversal thesis and re-expose ETH to deeper downside risk.
Ethereum price has beaten a bearish trend, but the breakout is still fragile. A 10% move higher is now the difference between a confirmed reversal and another painful reset.
The post Ethereum Price Breaks Bearish Trend, Now Faces a Critical 10% Test appeared first on BeInCrypto.