
The Dogecoin price has had a choppy week. The meme coin is up nearly 7% over the past seven days, but that gain has been wiped out by an almost 7% drop in the past 24 hours. The pullback mirrors a broader crypto market cooldown, but Dogecoin’s setup looks slightly different.
On the charts and on-chain, a mix of accumulation and selling risk paints a split picture. While short-term weakness remains, hidden bullish signals suggest the pullback may be cooling off — though not without one lingering threat.
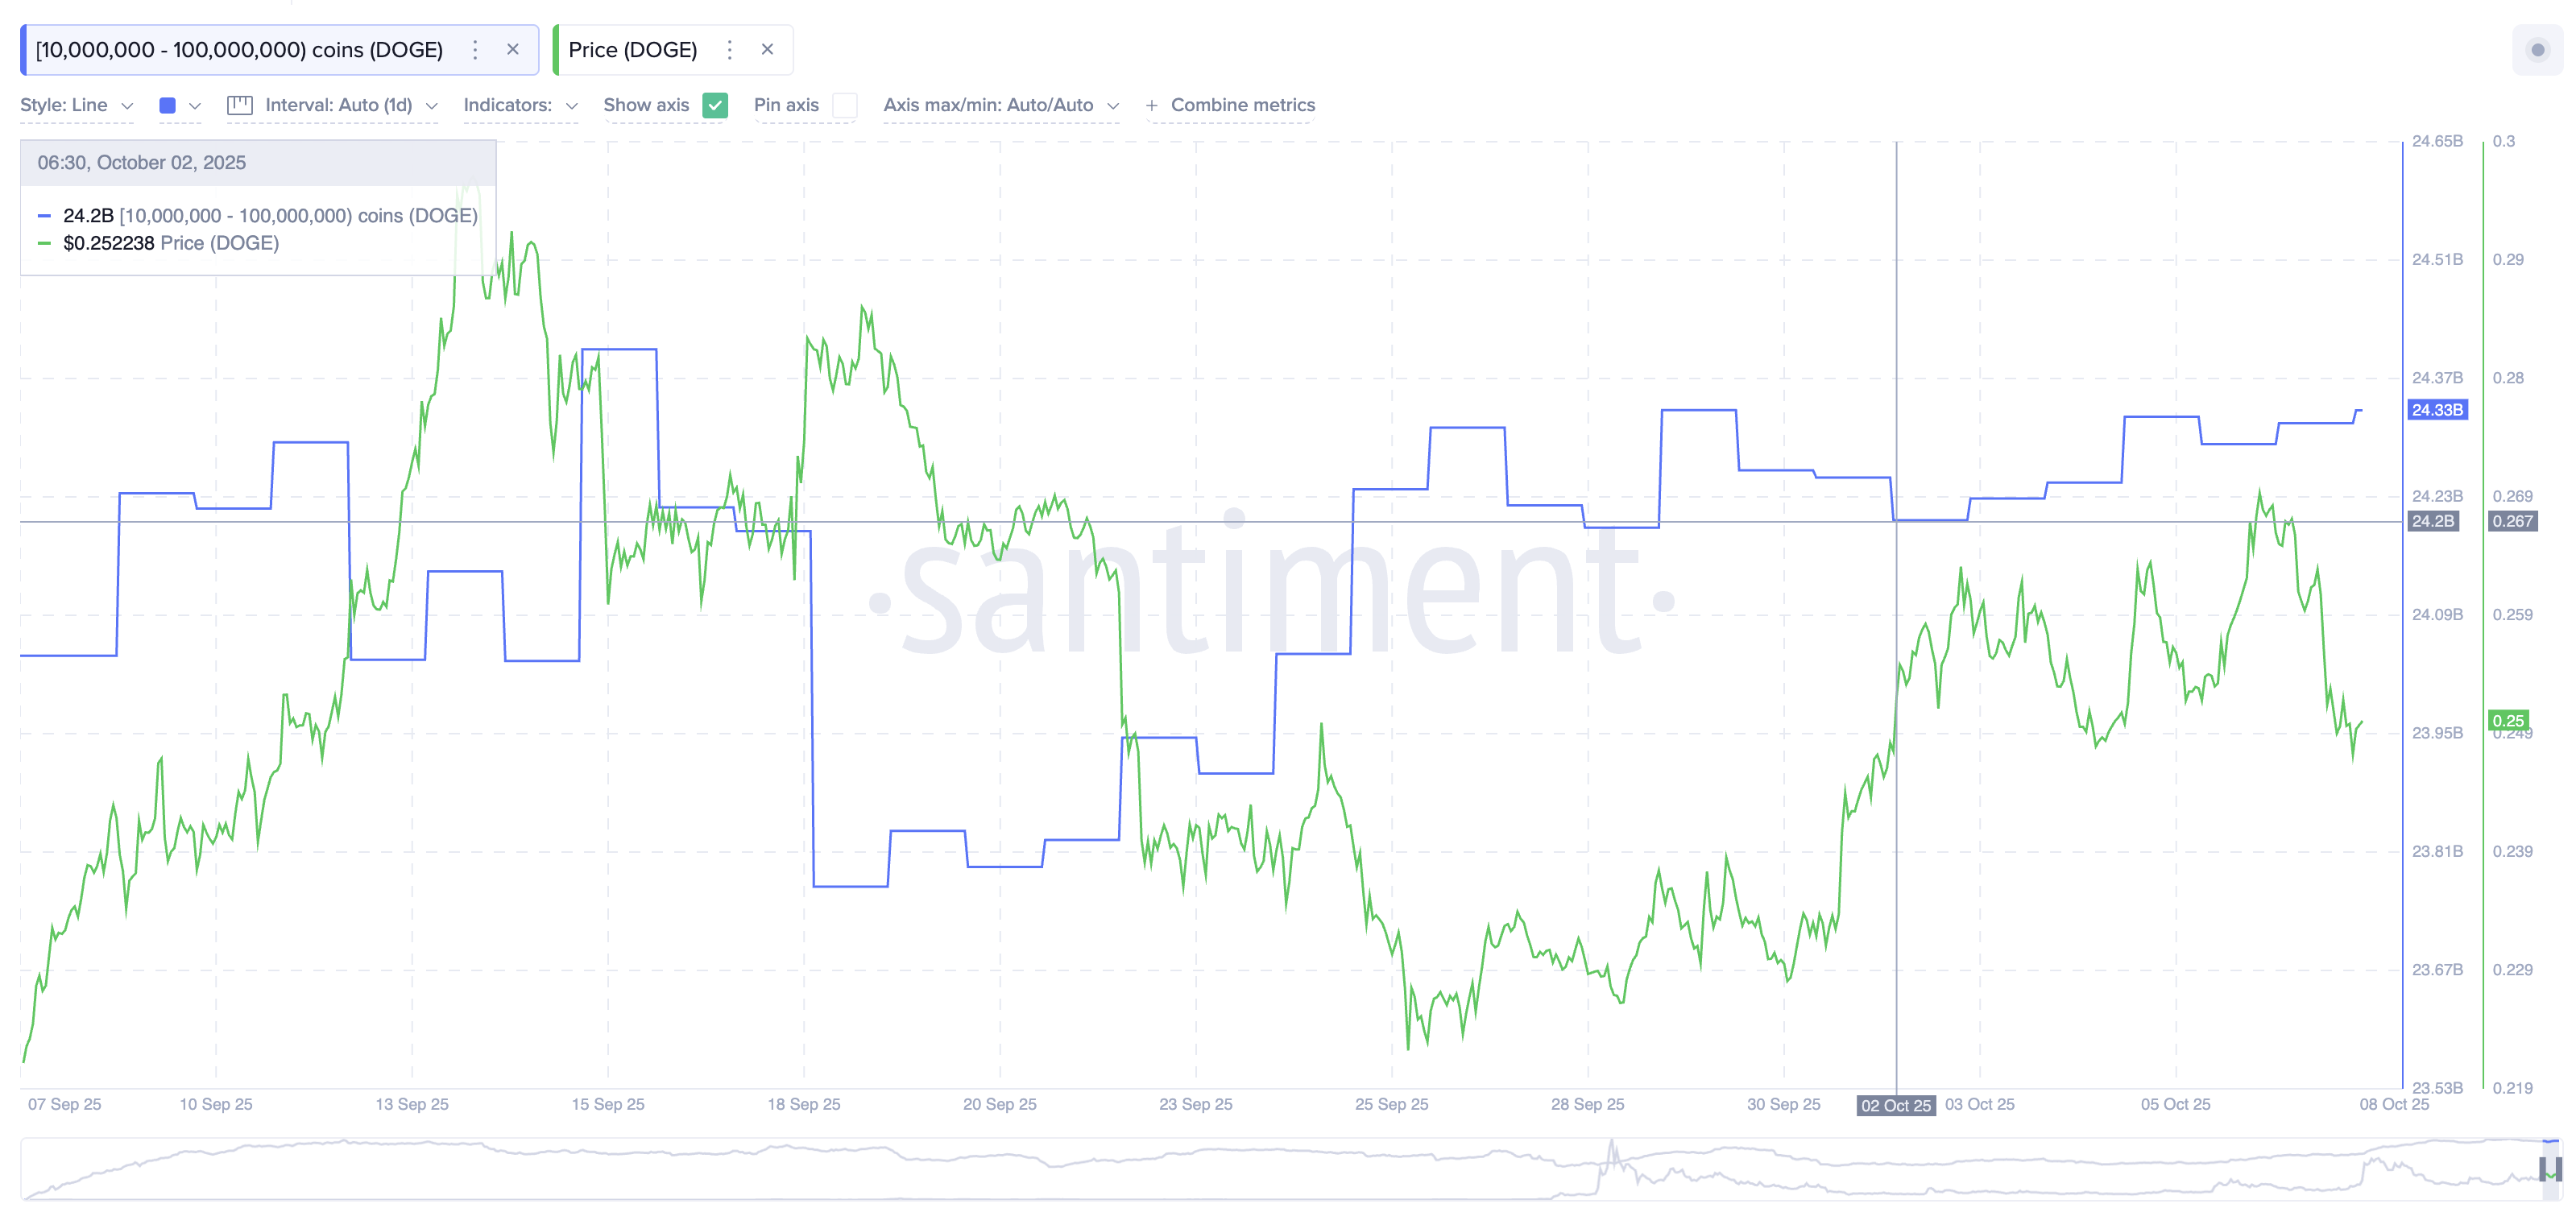
Whales Add DOGE, but Exchange Balances Flash a Warning
Whale activity has quietly turned positive. Wallets holding 10 million to 100 million DOGE have increased their holdings from 24.20 billion DOGE on October 2 to 24.33 billion DOGE — an addition of around 130 million DOGE, roughly $32 million at the current Dogecoin price.
That kind of steady buying from mid-size whales often acts as price support, especially during volatile swings.
But the optimism is checked by one important metric: exchange balances. Data from Glassnode shows the percent balance of DOGE on exchanges sitting at 17.7%, close to the multi-year high reached on September 20.
Want more token insights like this? Sign up for Editor Harsh Notariya’s Daily Crypto Newsletter here.
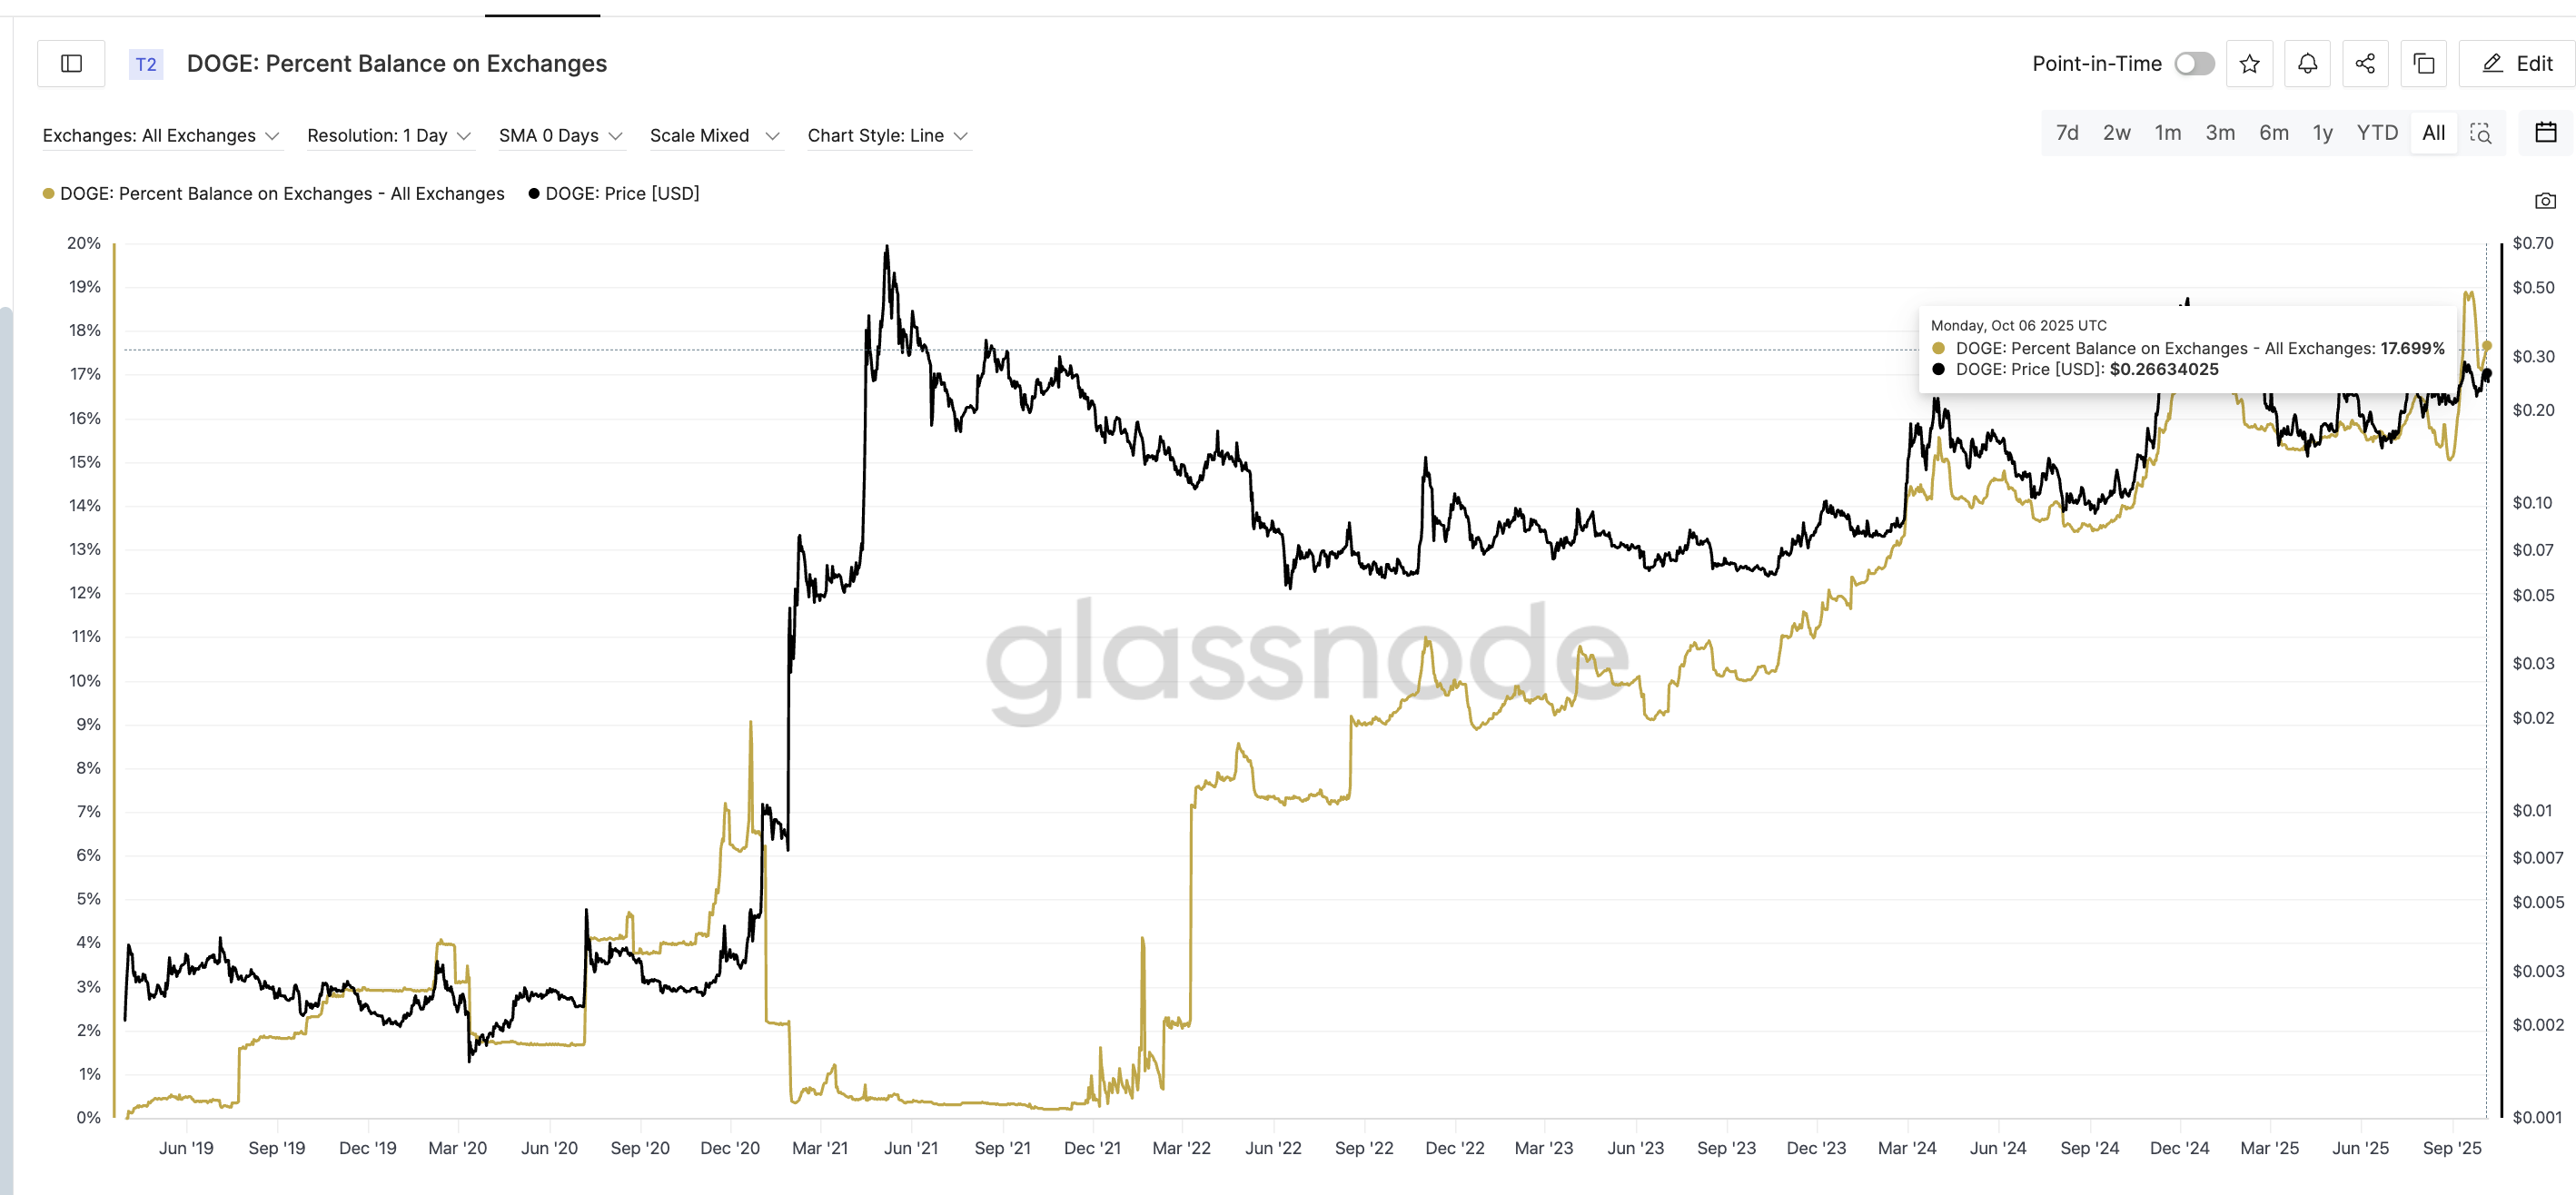
Historically, such peaks in exchange balances have often preceded notable corrections. For example, when exchange balances hit 15.57% on Apr 1, 2024, Dogecoin soon dropped by about 55% in the following months. A similar pattern appeared after the 17.1% high on Dec 9, 2024, which was followed by a roughly 65% decline by Apr 2025.
This level means a larger share of the total supply remains on exchanges — coins that can be easily sold. So while whales are absorbing some of the supply, a portion of the market still seems prepared to take profits or make exits.
The contrast between whale accumulation and elevated exchange balances reflects the push-pull between confidence and caution. It’s this risk that keeps the lower price levels zone in play despite the supposed exhaustion of the pullback.
Dogecoin Price Chart Hints at Pullback Exhaustion
Dogecoin’s 4-hour chart shows the price respecting an ascending support line inside a rising wedge pattern. The recent bounce from $0.246 suggests buyers are defending that trendline.
Between Sept 30 and Oct 7, the Dogecoin price made a higher low, while the Relative Strength Index (RSI) — which tracks momentum — formed a lower low. This hidden bullish divergence often signals that sellers are losing strength and that an uptrend could resume.
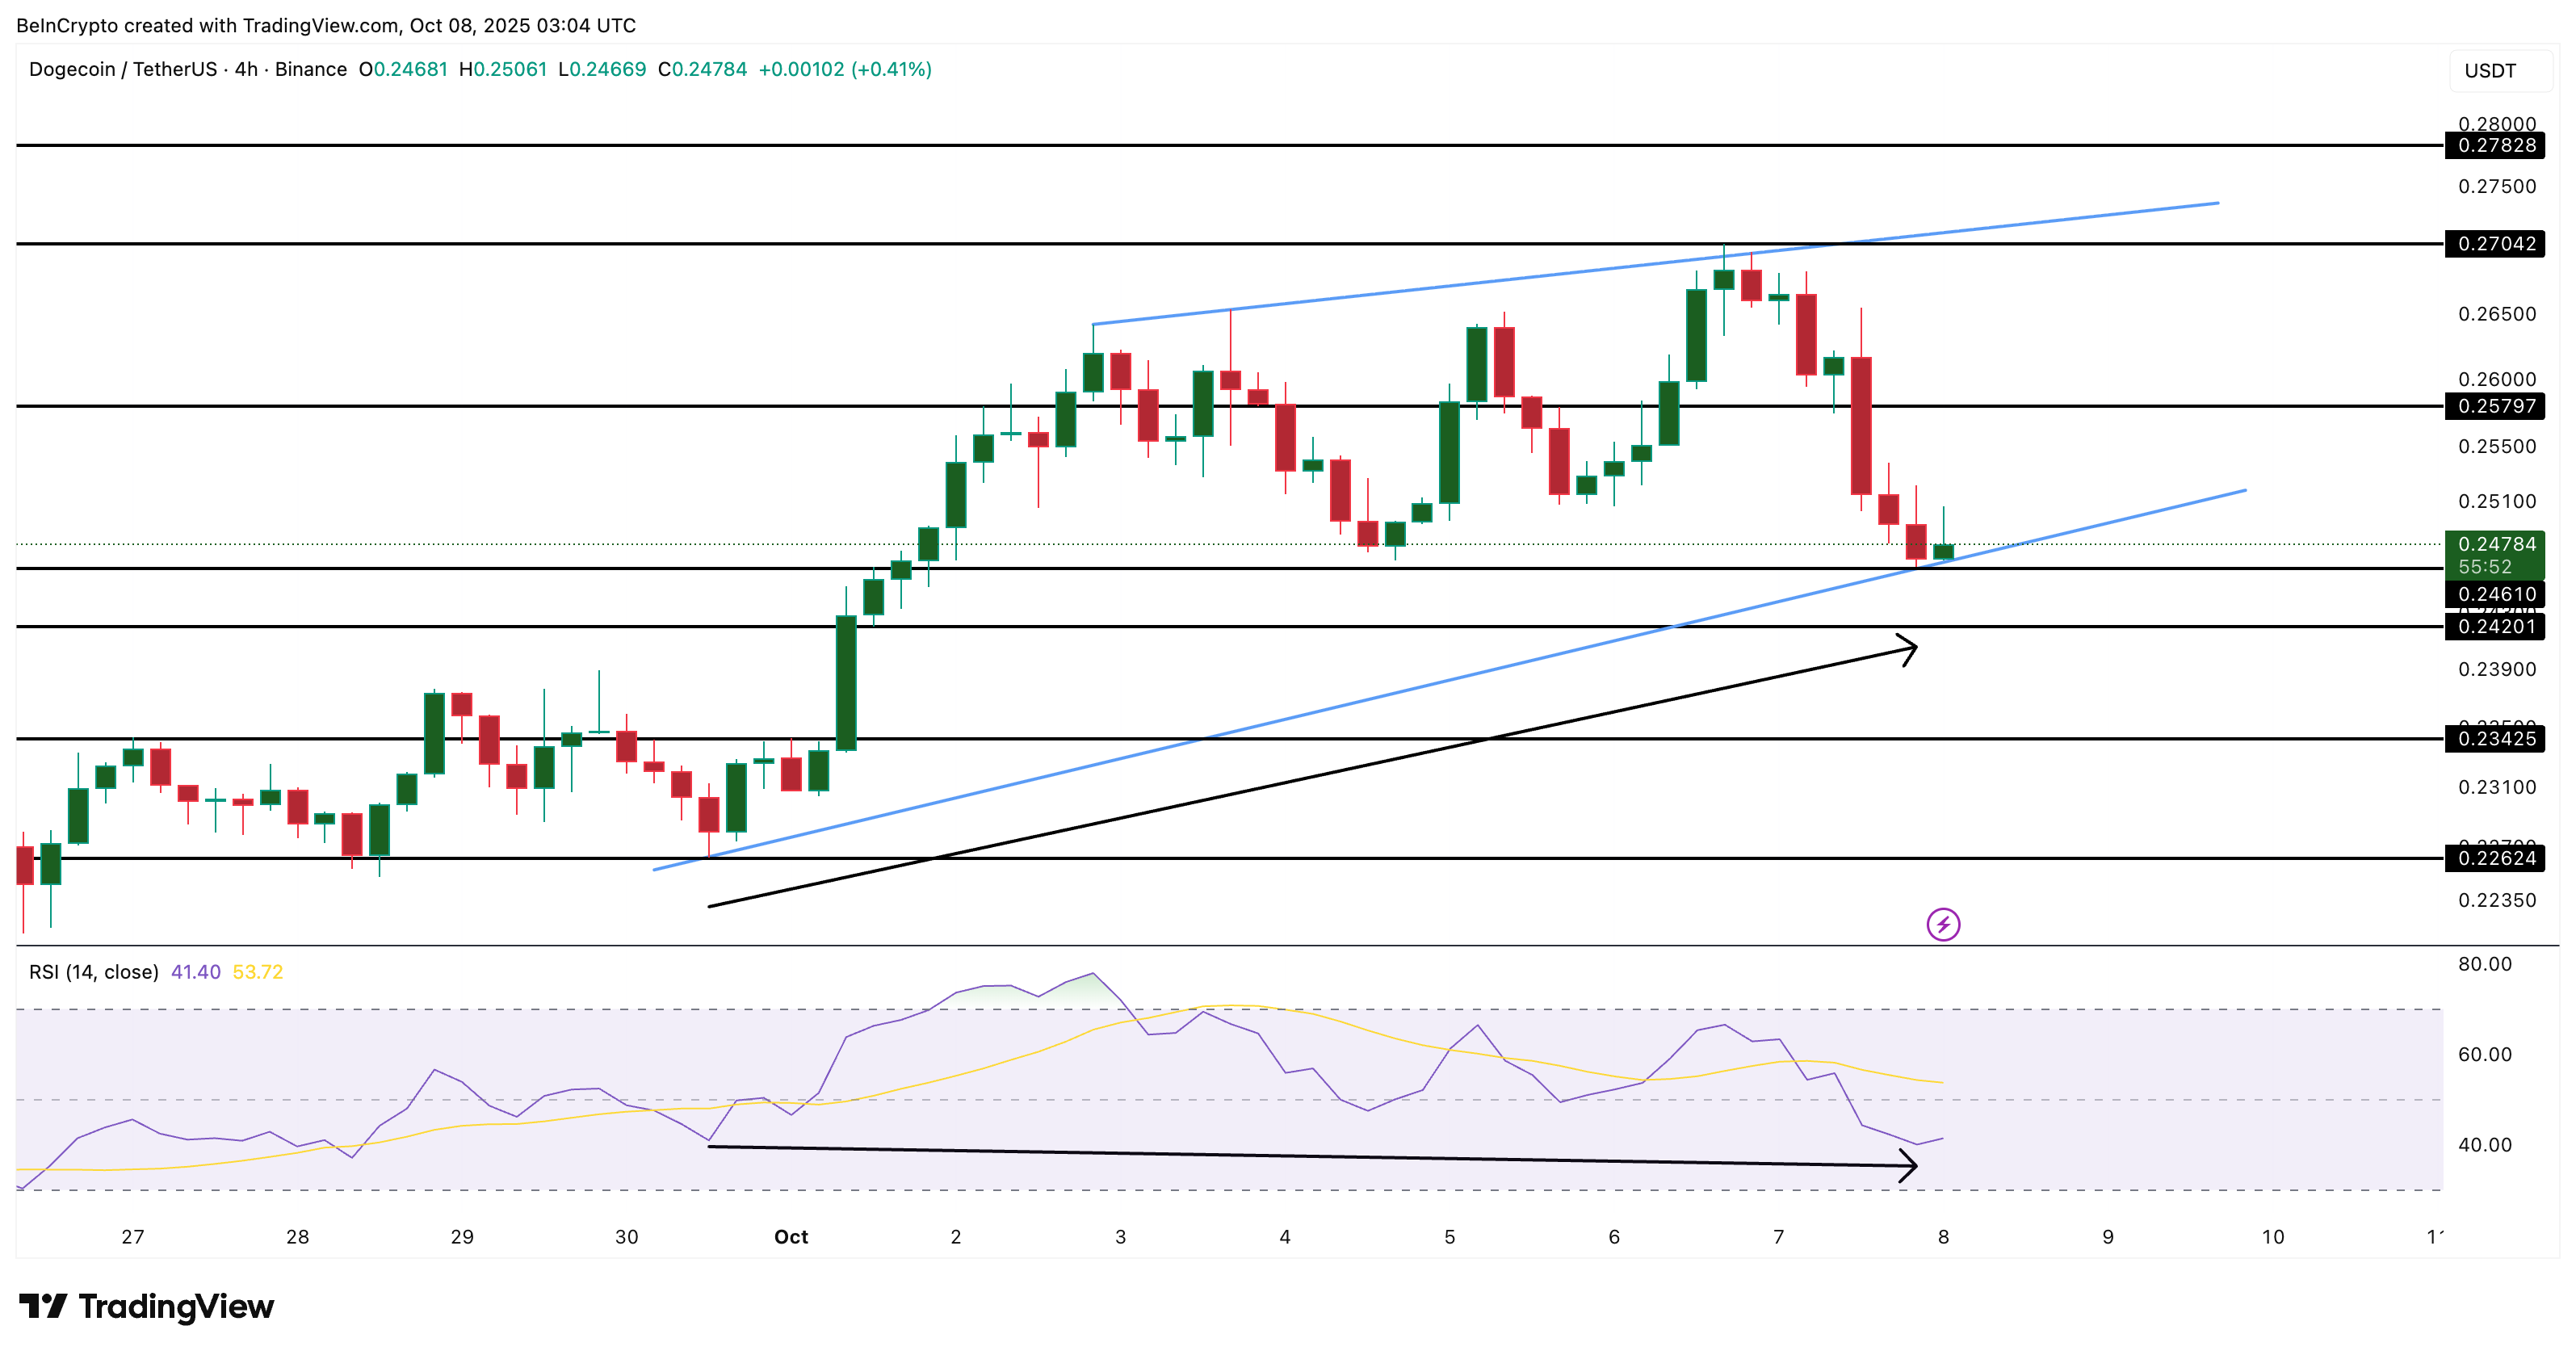
If the support around $0.246 holds, the Dogecoin price could attempt a rebound toward $0.257, $0.270, and $0.278. But if it fails and a 4-hour candle closes under the lower trendline, led by the exchange balance risk playing out, a drop toward $0.234 or even $0.226 can’t be ruled out.
It is worth noting that in the 4-hour timeframe, the Dogecoin price structure still leans bearish. The smallest of negative catalysts could lead to a price drop.
For now, the data points to a market cooling off, not collapsing. Whether the Dogecoin price pullback truly ends depends on how long whales keep buying before retail traders start following their lead.
The post Dogecoin (DOGE) Price Pullback May Be Ending, but One Risk Remains appeared first on BeInCrypto.