
BNB is showing strong momentum across both its ecosystem and technical indicators. Its DEX volume surged 85% in the past week, sharply outperforming chains like Ethereum and Solana.
Technically, BNB is backed by a bullish EMA alignment, a strong DMI reading, and favorable Ichimoku Cloud signals—all pointing to an active uptrend. While short-term consolidation is possible, current indicators suggest the trend remains in favor of the bulls.
BNB DEX Volume Surges 85%, Outpaces Ethereum, Solana, and Arbitrum
The BNB chain’s DEX ecosystem is showing exceptional strength, with decentralized exchange volume surging over 85% in the past seven days to reach $34.85 billion.
In stark contrast, all other top five chains—Solana, Ethereum, Base, and Arbitrum—have seen their DEX volumes decline by at least 13% over the same period.
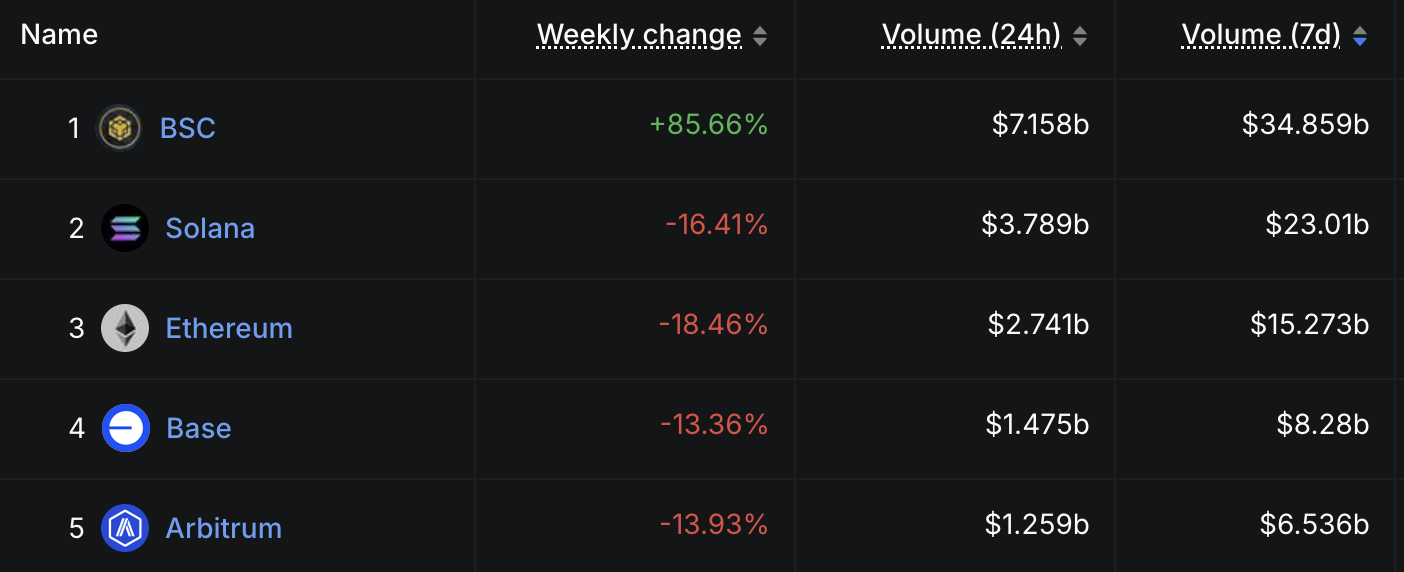
BNB recorded $7.15 billion in DEX volume in the last 24 hours. This shows clear momentum compared to its competitors. PancakeSwap led the activity, processing $8.7 billion in daily volume and $30.84 billion over the past week.
That weekly total is higher than the combined volume of Solana’s top four DEXs—Orca, Meteora, Raydium, and Pump. This highlights BNB’s growing dominance in DeFi.
BNB Enters Strong Trend Zone with Bullish DMI and Ichimoku Alignment
BNB’s Directional Movement Index (DMI) is flashing strong trend signals, with the ADX currently at 33.48—up sharply from 13 just two days ago.
The ADX (Average Directional Index) measures the strength of a trend, regardless of direction. Values below 20 indicate weak or non-trending conditions, while readings above 25–30 confirm a strong trend is in place.
BNB’s surge above 30 suggests the asset has entered a period of high momentum, with traders paying close attention to directional indicators for confirmation.
The +DI, which tracks bullish pressure, currently sits at 33.97—up from 21.3 two days ago but slightly down from 42.41 yesterday. This indicates buyers are still dominant, though momentum may be cooling slightly.
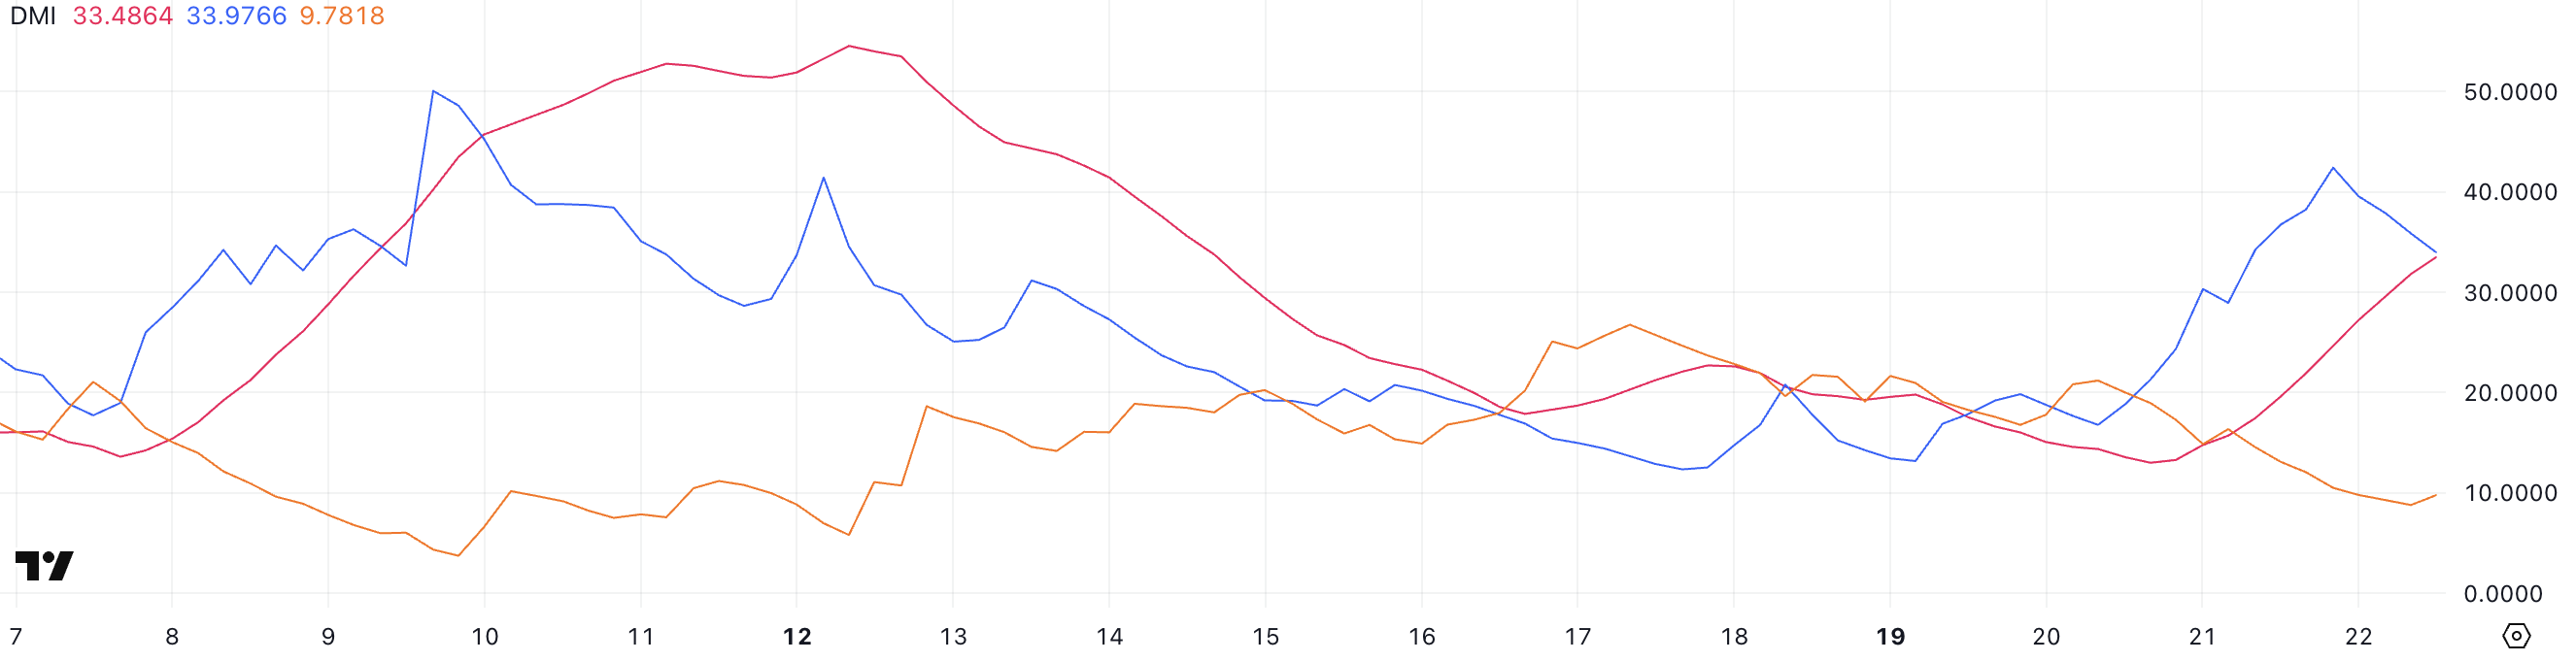
Meanwhile, the -DI, which reflects bearish pressure, has dropped to 9.78 from 16.36, reinforcing the bullish bias.
This setup—a rising ADX, a strong +DI, and a declining -DI—typically signals a sustained uptrend, though the slight dip in +DI suggests that BNB may face some short-term consolidation before continuing higher.
The Ichimoku Cloud chart for BNB shows a strong bullish structure. The price action is clearly above the cloud (Kumo), which indicates an overall bullish trend.
The cloud ahead is thin and starting to turn green, suggesting bullish momentum may continue, although the narrow span signals the trend is not overly strong just yet.
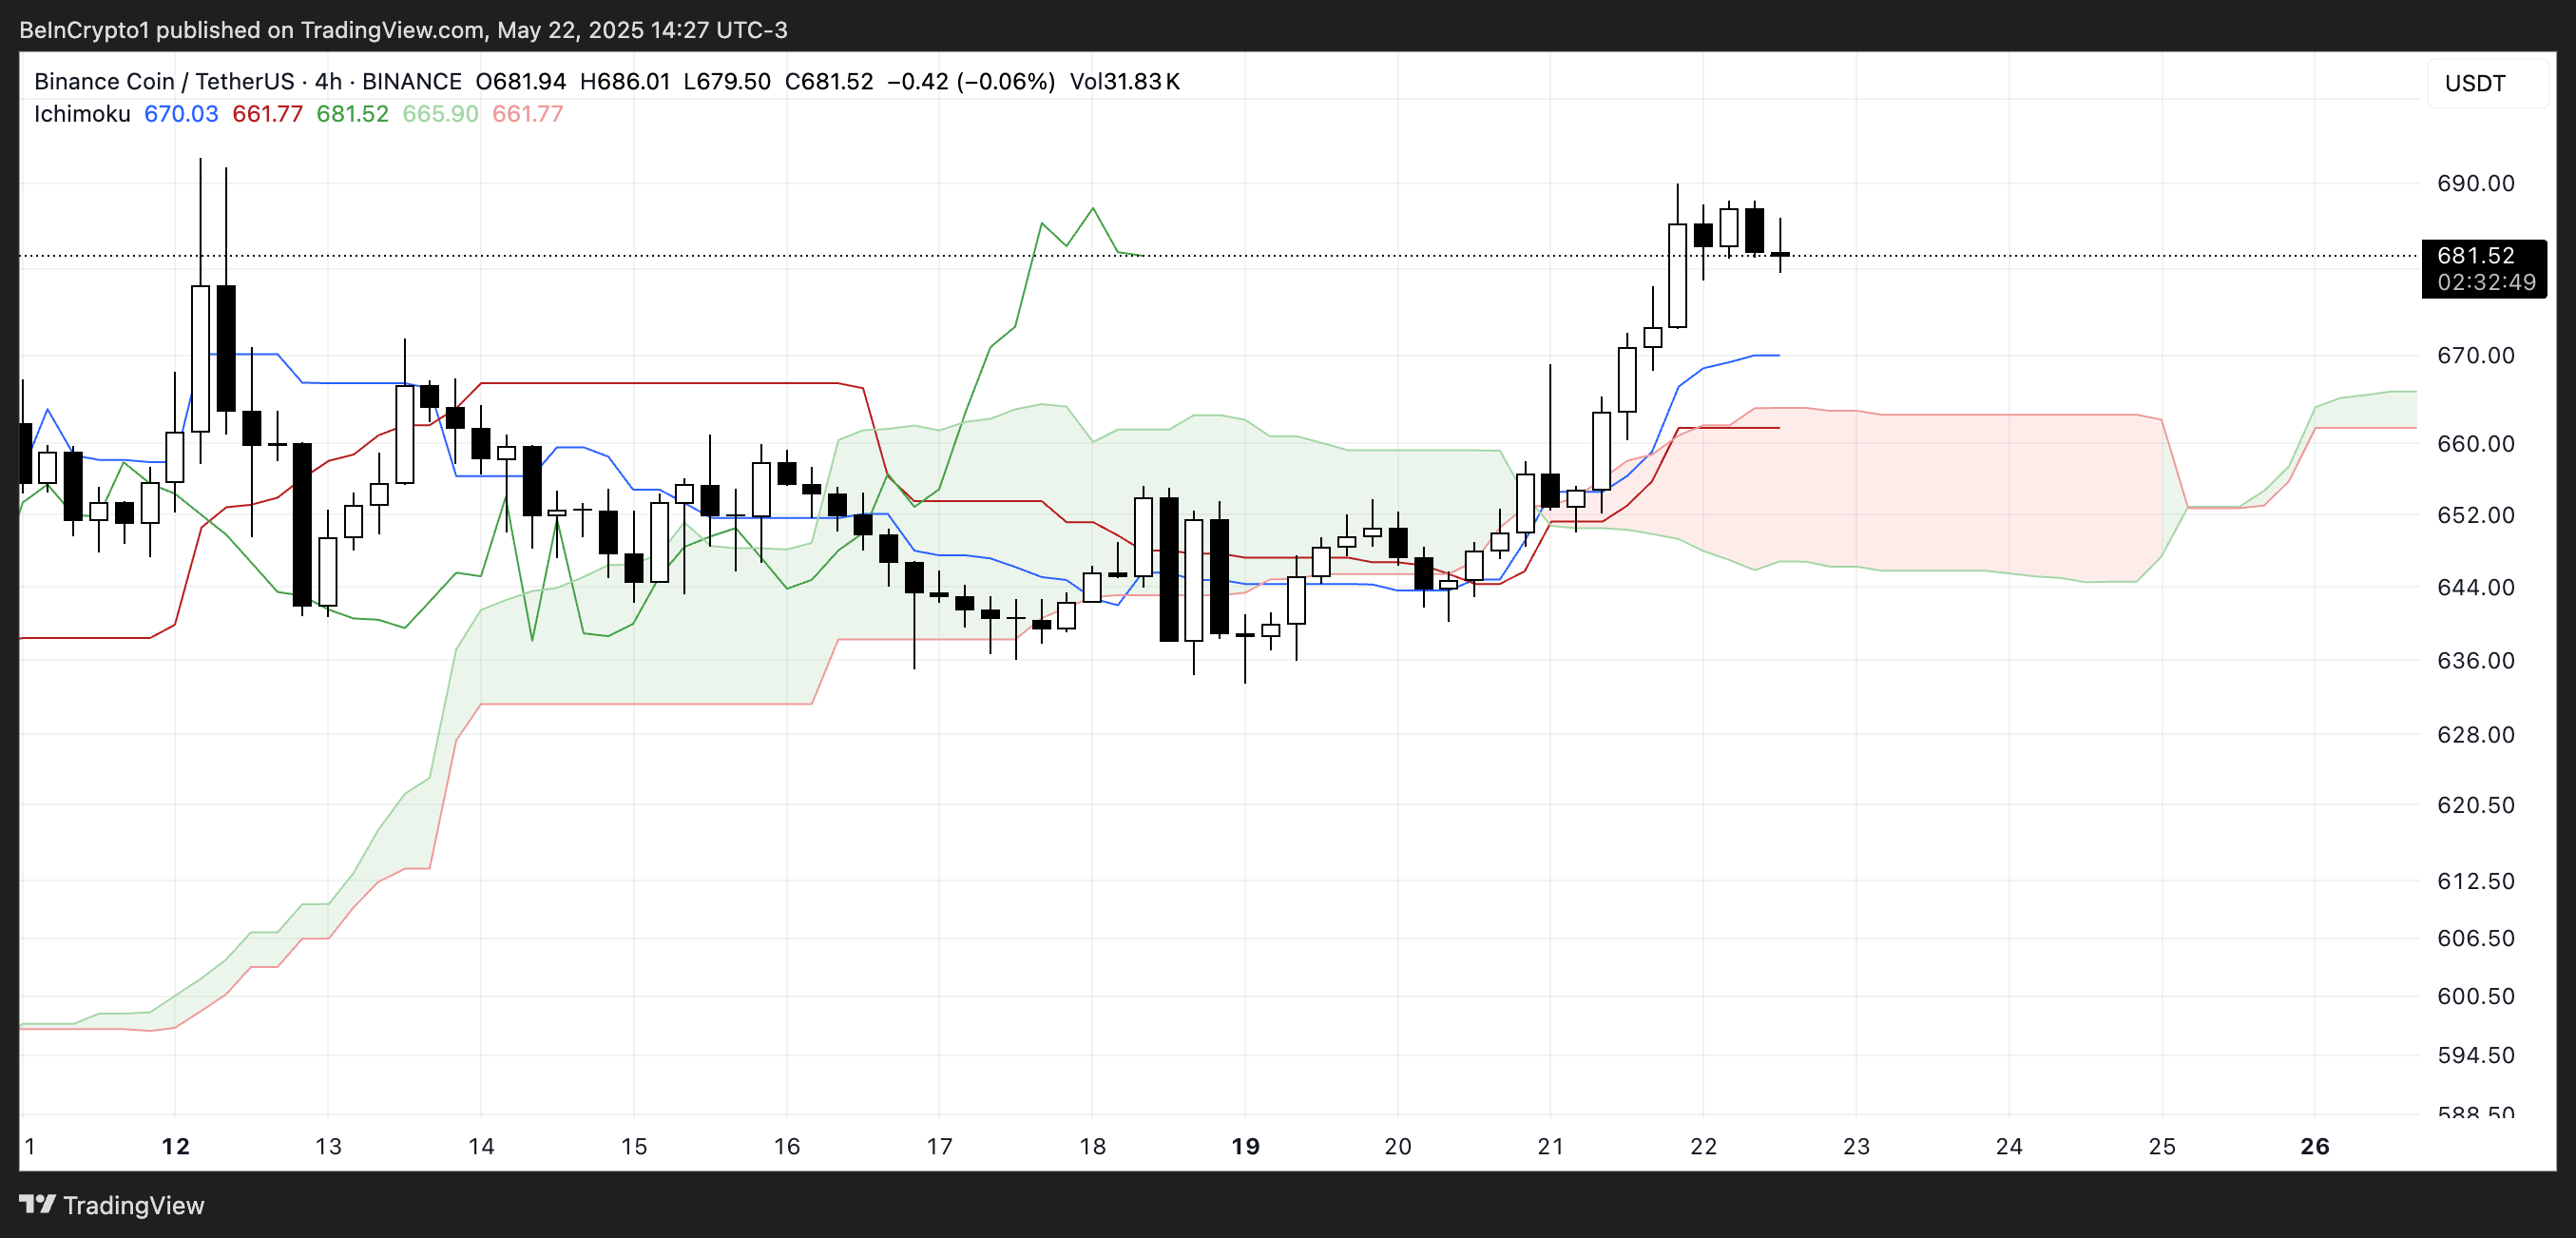
The blue line (Tenkan-sen) is positioned above the red line (Kijun-sen), a classic bullish crossover that reflects short-term strength. Both lines are rising and well below the current price, offering near-term support.
Additionally, the green Lagging Span (Chikou Span) is above both the price and the cloud, confirming the strength of the current trend from a historical perspective.
The chart reflects a bullish setup, but the sideways movement in the last few candles suggests potential short-term consolidation.
BNB Maintains Bullish EMA Structure as Uptrend Holds
BNB’s EMA structure remains firmly bullish, with shorter-term exponential moving averages positioned above the longer-term ones—indicating sustained upward momentum.
The token has climbed 12% over the past 30 days and 2.5% in the last 24 hours, reflecting steady market confidence.
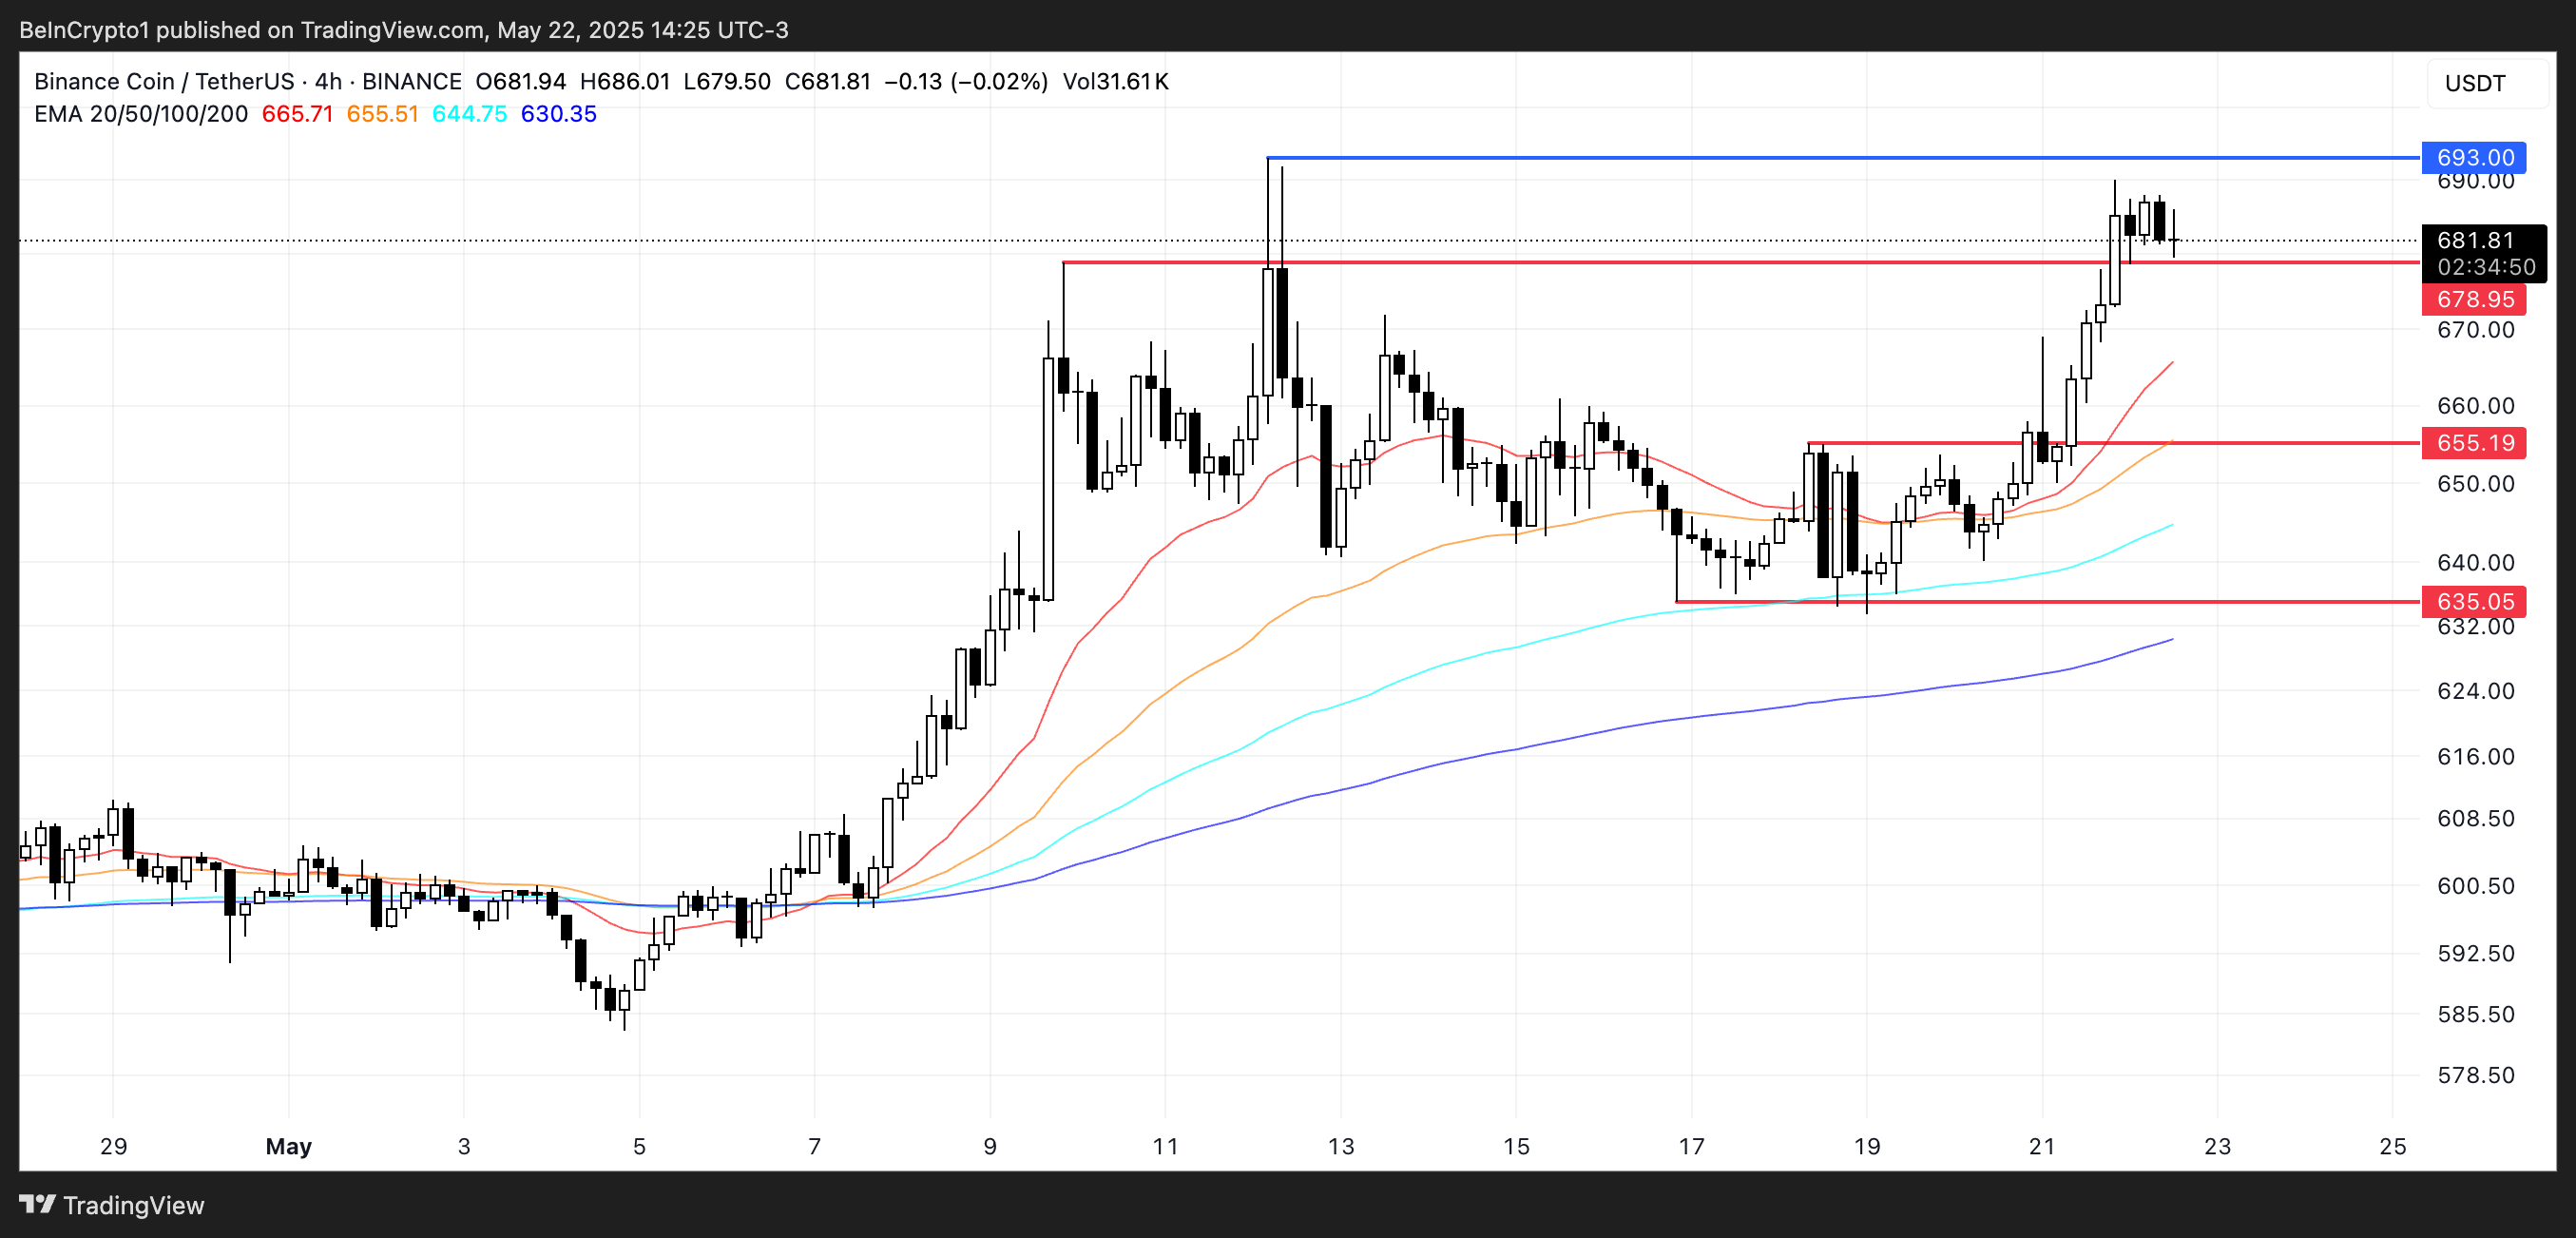
This alignment of EMAs often signals strong trend continuation, particularly when supported by rising price action and volume.
If the current uptrend holds, BNB could push higher to challenge the next resistance level. However, caution is warranted: downside pressure could build if the $678 support breaks, potentially dragging the price down to $655 or even $635 in a more extended correction.
The post BNB Targets Breakout Above $700 as DEX Volume Soars 85% in One Week appeared first on BeInCrypto.