Bitcoin price has surged close to 7% over the past week, a sharp move even for the OG crypto. The rally’s pace is drawing comparisons to the last push before its July 14 all-time high (ATH) at $122,838.
However, a closer look at both on-chain and technical indicators shows that this time, market conditions are noticeably different and potentially more favorable for another leg up.
SOPR Suggests This Rally Has Room to Breathe
The Short-Term Holder Spent Output Profit Ratio (SOPR) measures whether coins moved on-chain are being sold at a profit or a loss. When Short-term SOPR rises too high, it signals aggressive profit-taking, often preceding local tops.
The short-term holder SOPR makes more sense in this analysis, as during aggressive price peaks, the short-term cohort is often the first one to start selling.
For token TA and market updates: Want more token insights like this? Sign up for Editor Harsh Notariya’s Daily Crypto Newsletter here.

During the July 14 peak, SOPR spiked to overheated levels between 1.03 and 1.05, a red flag that the Bitcoin price rally was exhausting itself. Today, SOPR sits at 1.00, showing that profits are being realized less aggressively. This hints at a healthier market structure and a rally that hasn’t reached saturation yet.
Taker Buy/Sell Ratio And RSI Point to Strong Demand
Spot market flows confirm the bullish undertone. The Taker Buy/Sell Ratio, a gauge of whether aggressive market buys or sells dominate, has jumped from a neutral 1.02 on August 10 to 1.14, its highest reading since early July.
This shows buyers are stepping in with conviction, overpowering sellers.

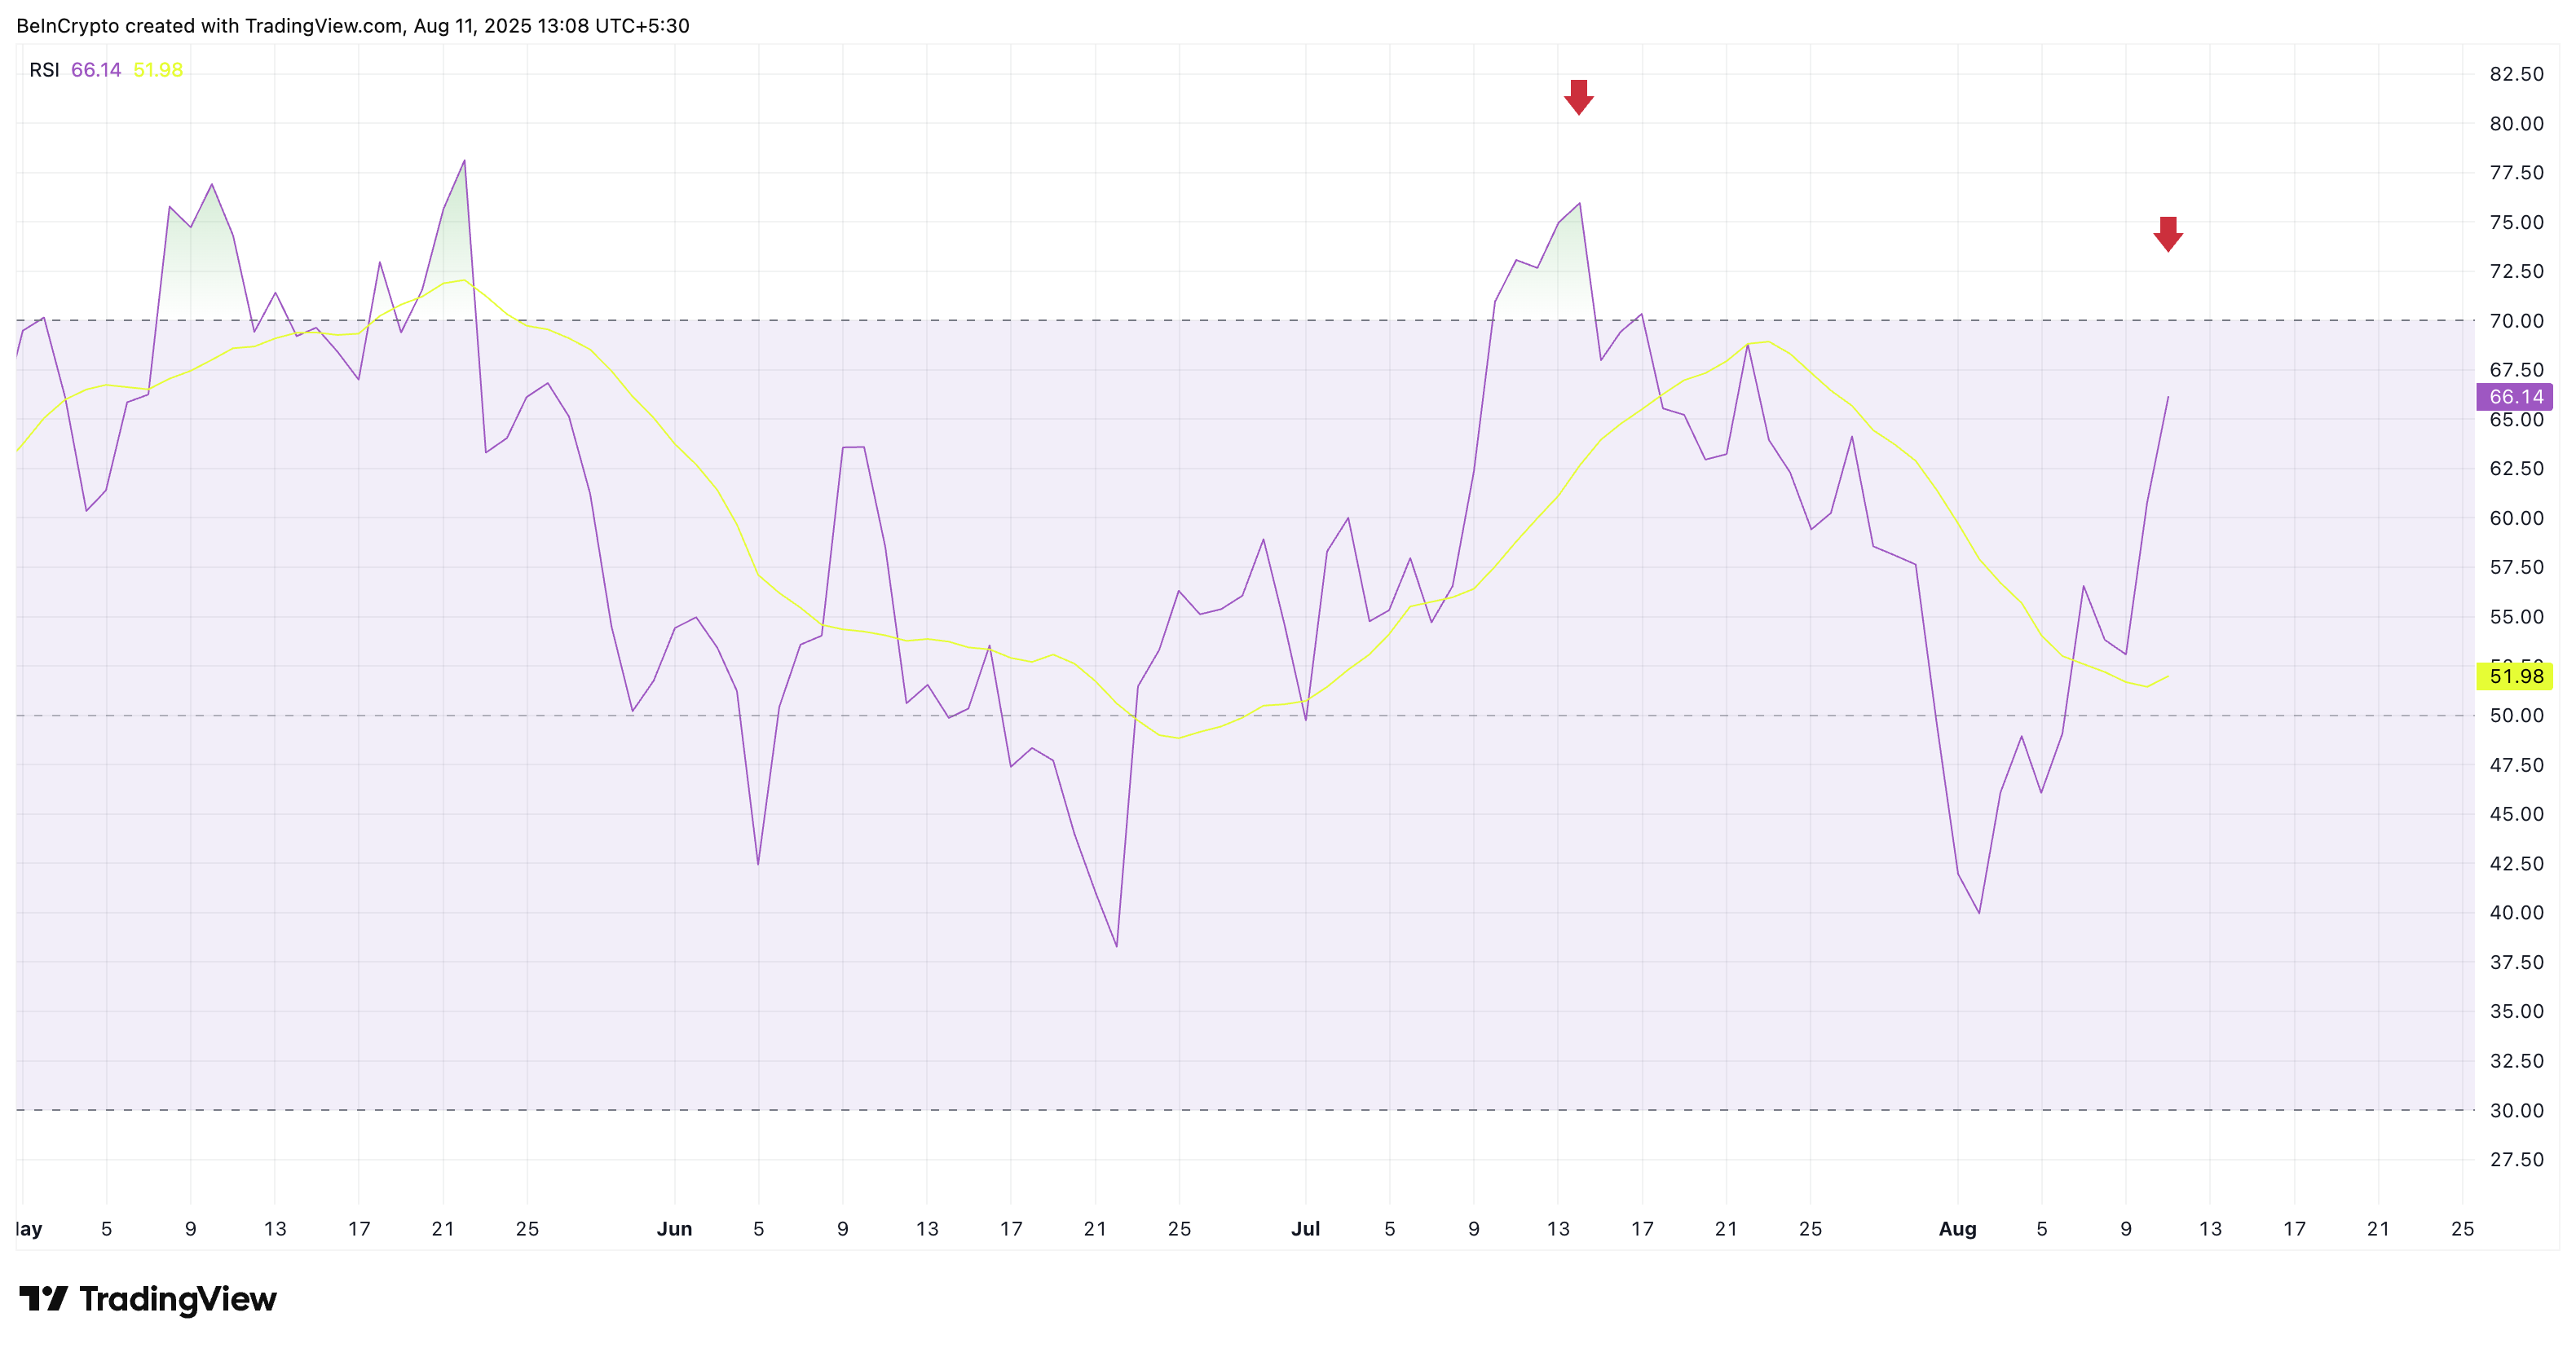
The Relative Strength Index (RSI) backs this up. On July 14, RSI was in the overbought territory above 75, limiting further upside. Now, RSI sits near 66 as the price sits only 0.6% south of the all-time high, well below overbought thresholds, giving the Bitcoin price rally more “legroom” before technical exhaustion.
RSI (Relative Strength Index) is a momentum indicator that measures the speed and size of recent price moves on a 0–100 scale: above 70 can signal overbought, below 30 oversold.
These metrics suggest the rally could extend beyond the current resistance zone. SOPR shows this rally isn’t yet weighed down by heavy profit-taking. The recent jump in the Taker Buy/Sell Ratio, coupled with an RSI that still sits comfortably below overbought territory, suggests buyers have both the intent and the technical space to push the rally further.
Bitcoin Price Action Eyes Breakout Beyond The All-Time High
On the daily chart, Bitcoin is still moving inside a well-defined ascending channel. Price is pressing against the $123,230 Fibonacci 1.0 level; the same area that capped the July 14 rally. A clean breakout here could target the $130,231.
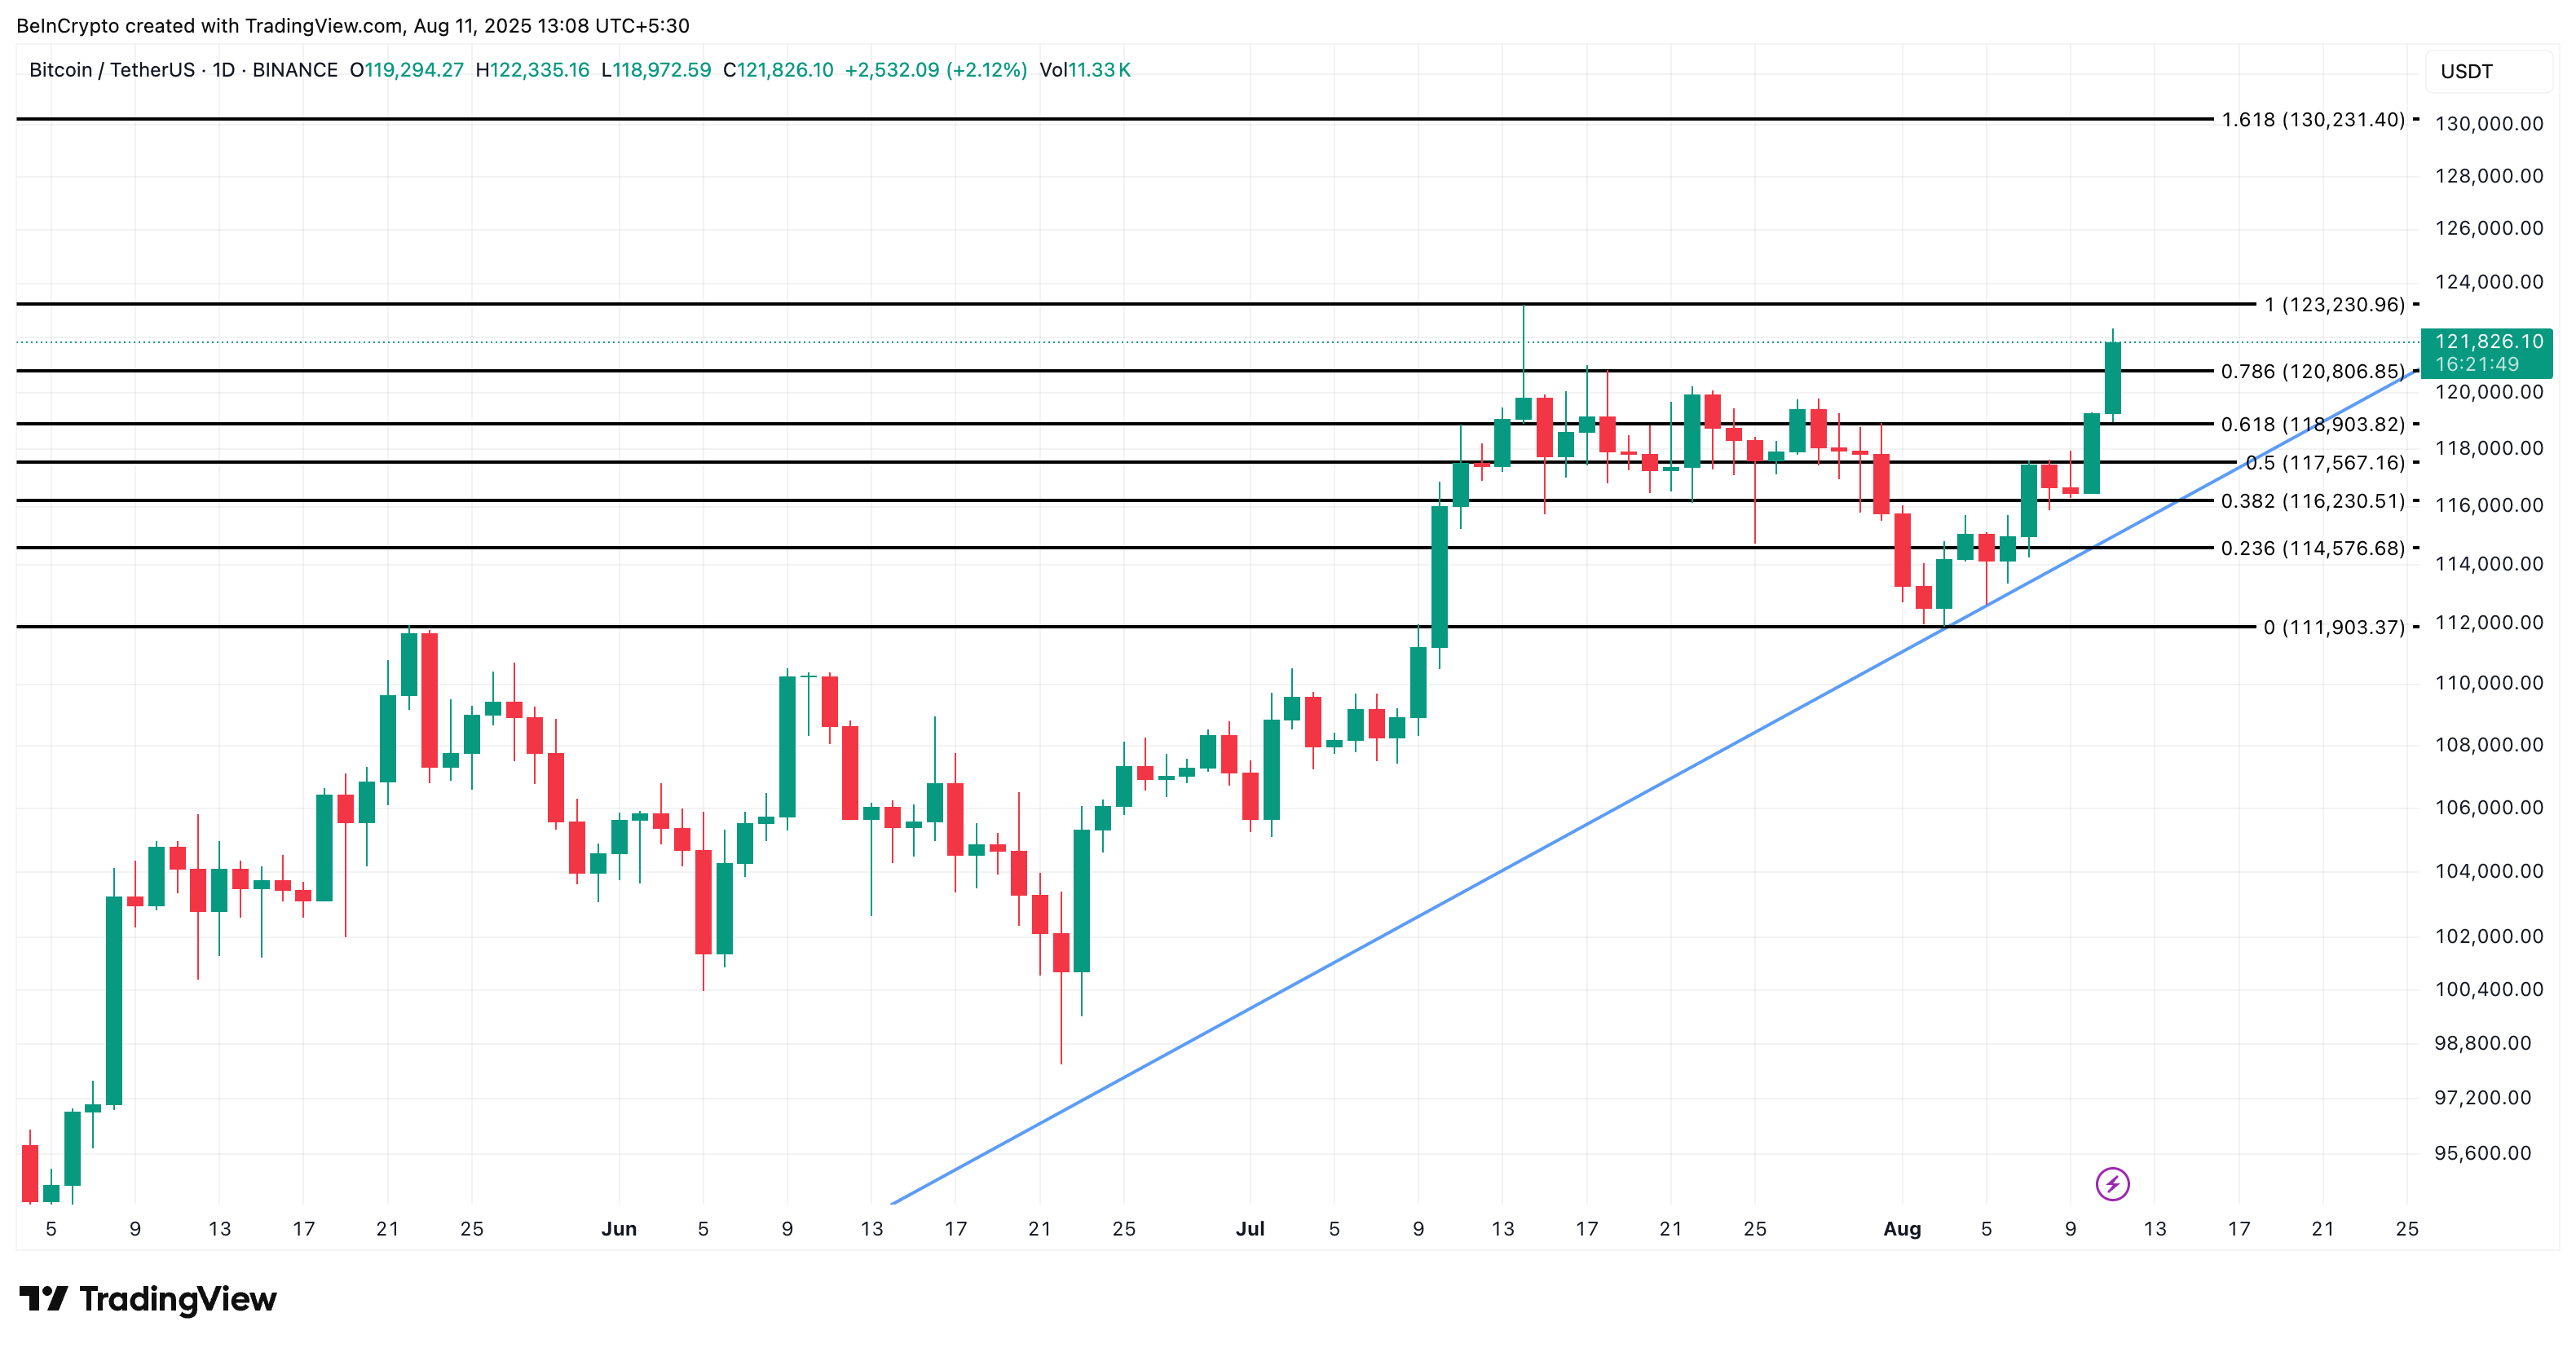
Key supports to watch are $120,806 (Fib 0.786) and $118,903 (Fib 0.618). Holding above these levels would keep the breakout thesis intact, while a close below could stall momentum.
If the bullish metrics hold and the breakout clears $123,200 with volume, traders could see new highs form faster than the last time, possibly higher than what the market is currently pricing in. However, a dip under $118,900 would defeat the short-term bullish trend.
The post Bitcoin’s Next All-Time High Could Be Close—2 Indicators Signal More Upside appeared first on BeInCrypto.