
Bitcoin price has started the new week with a modest rebound after briefly slipping below the $66,000 level. The cryptocurrency quickly recovered from the dip and was trading back above $67,500 at press time, indicating buyers are still defending recent support levels.
Yet the short-term recovery hides a risky technical setup. The four-hour chart is now flashing a bearish structure that points to potential downside risk. At the same time, collapsing derivatives leverage, muted spot selling, and inactive whales suggest that if the drop does occur, it may unfold gradually rather than through a sudden crash.
Bitcoin Head-and-Shoulders Pattern Puts 10% Drop Risk on the Table
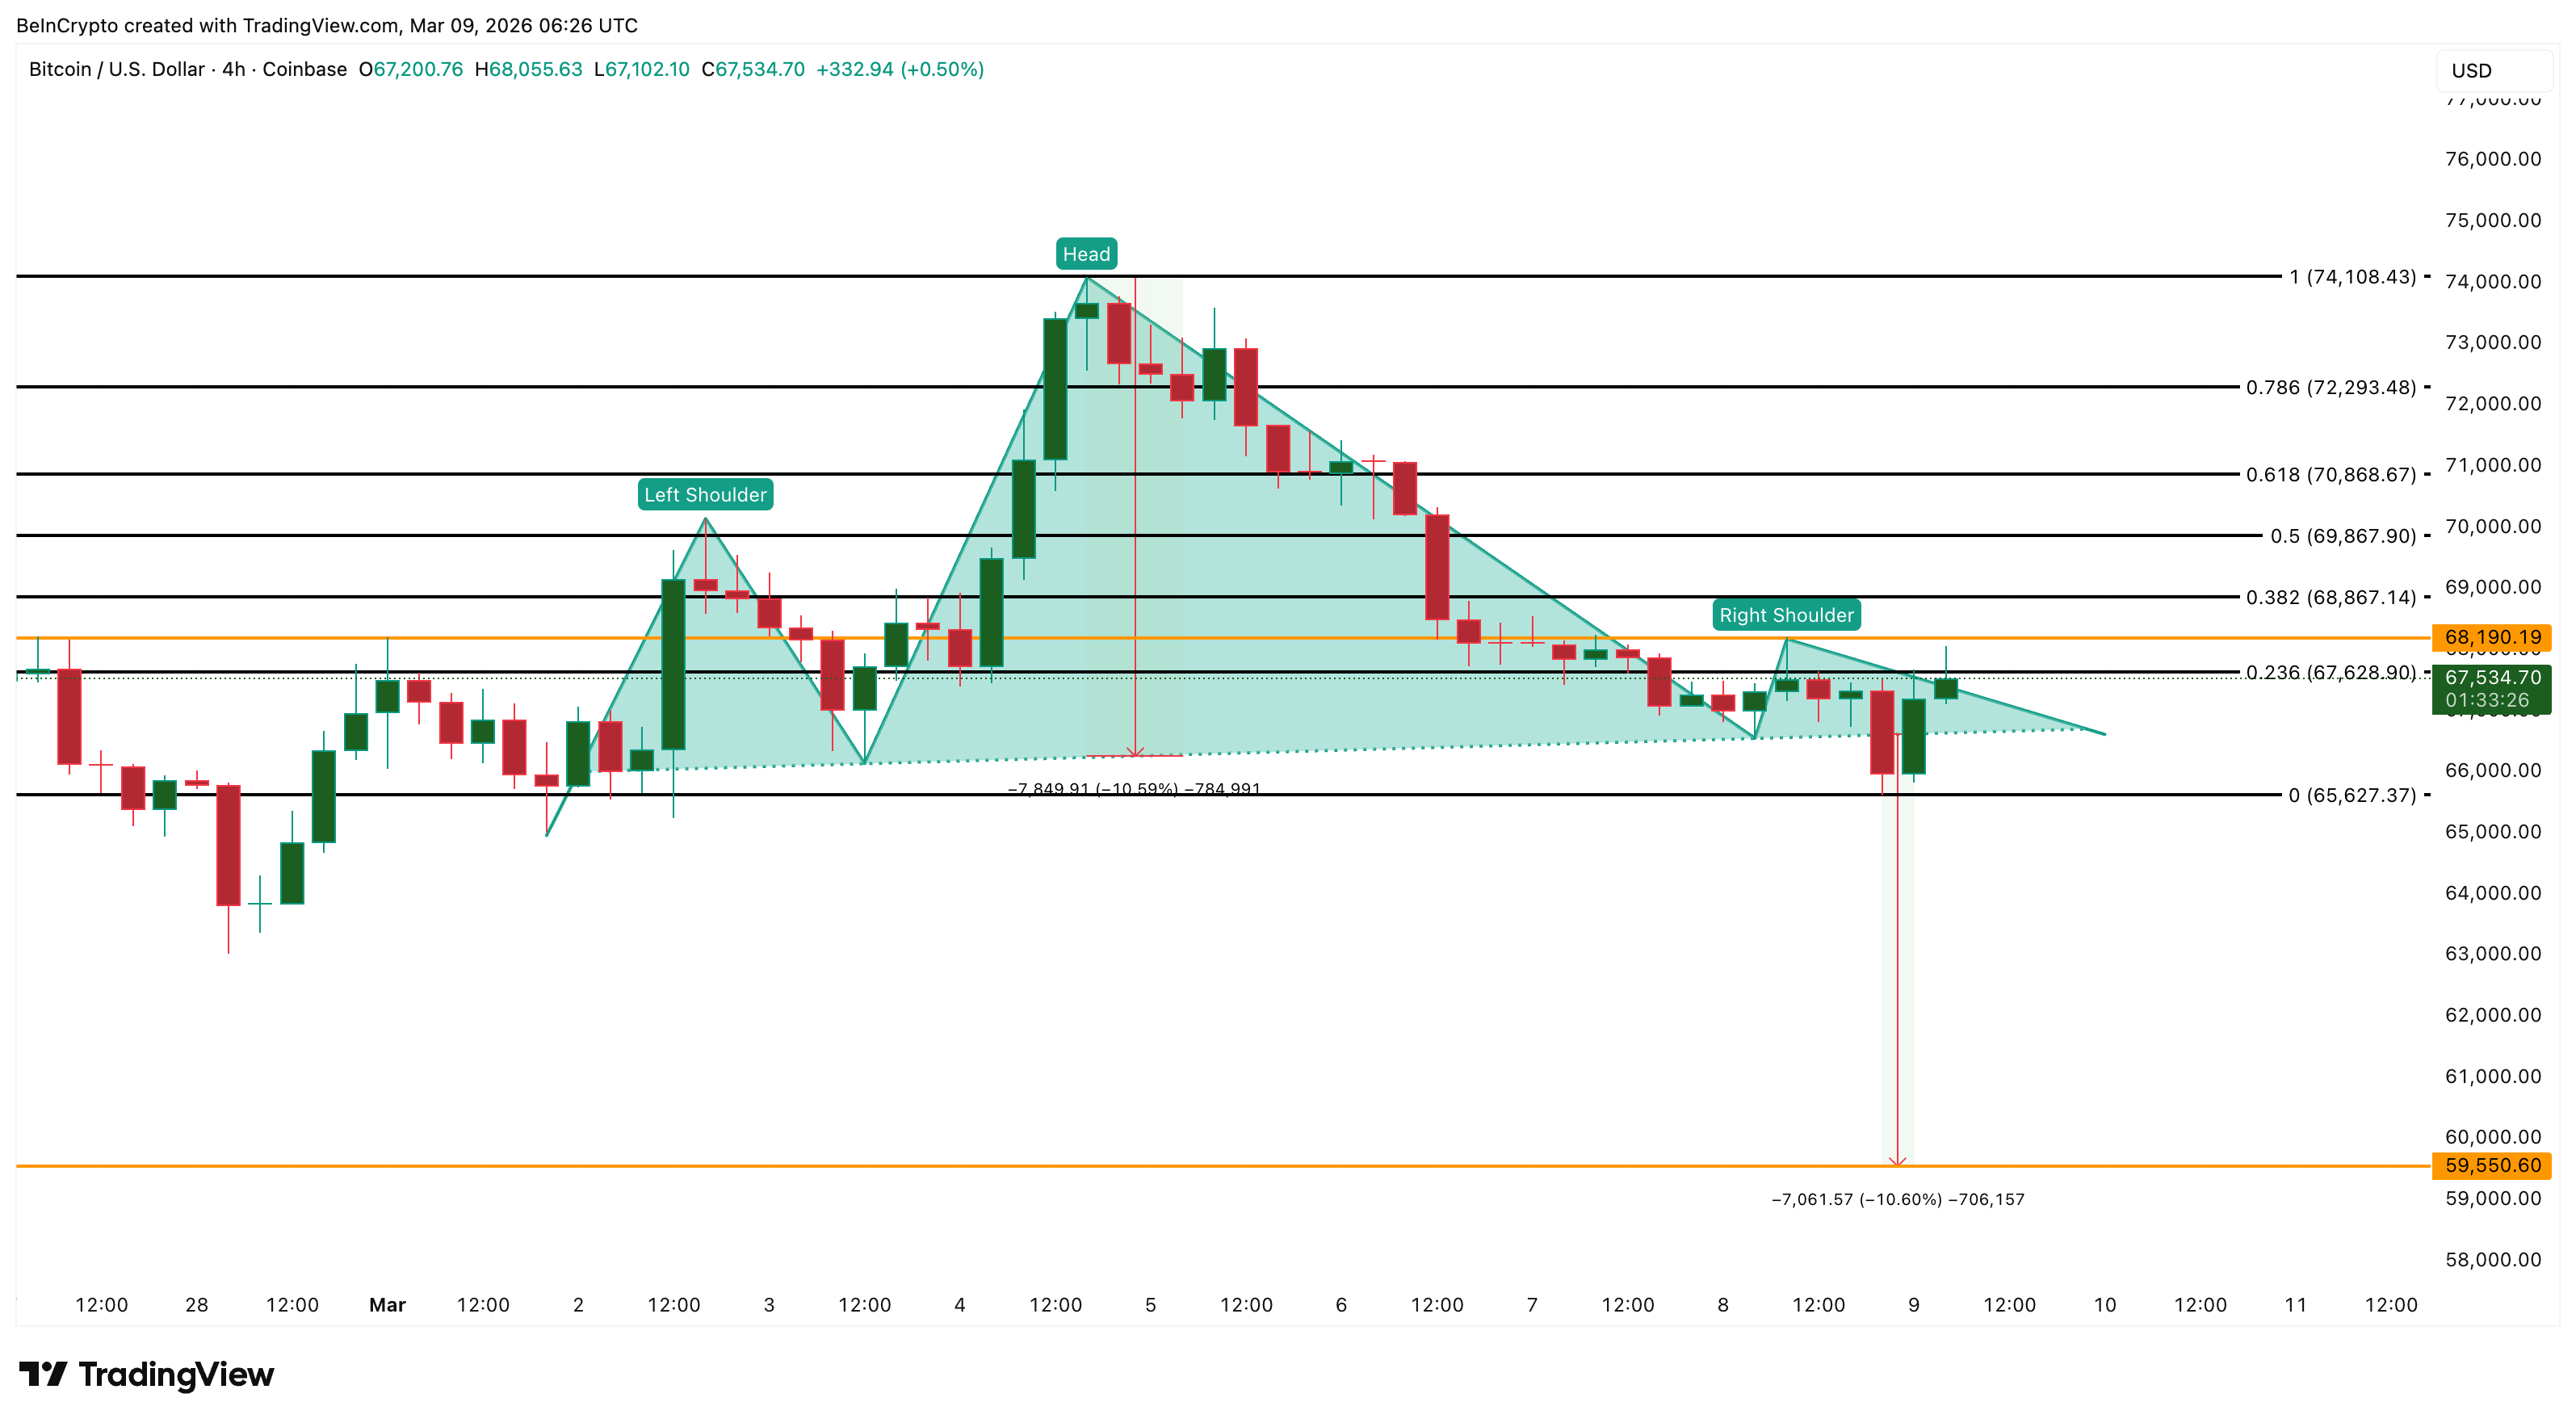
A closer look at the four-hour chart shows Bitcoin forming a classic head-and-shoulders pattern, a technical structure that often signals weakening bullish momentum. On March 8, the Bitcoin price briefly broke below the neckline of the pattern, then quickly reclaimed it.
That reclaim prevented an immediate breakdown, but the pattern itself remains technically valid. If the neckline fails again, the measured move of the formation points toward roughly $59,500, representing a decline of about 10% from current levels.
Want more token insights like this? Sign up for Editor Harsh Notariya’s Daily Crypto Newsletter here.
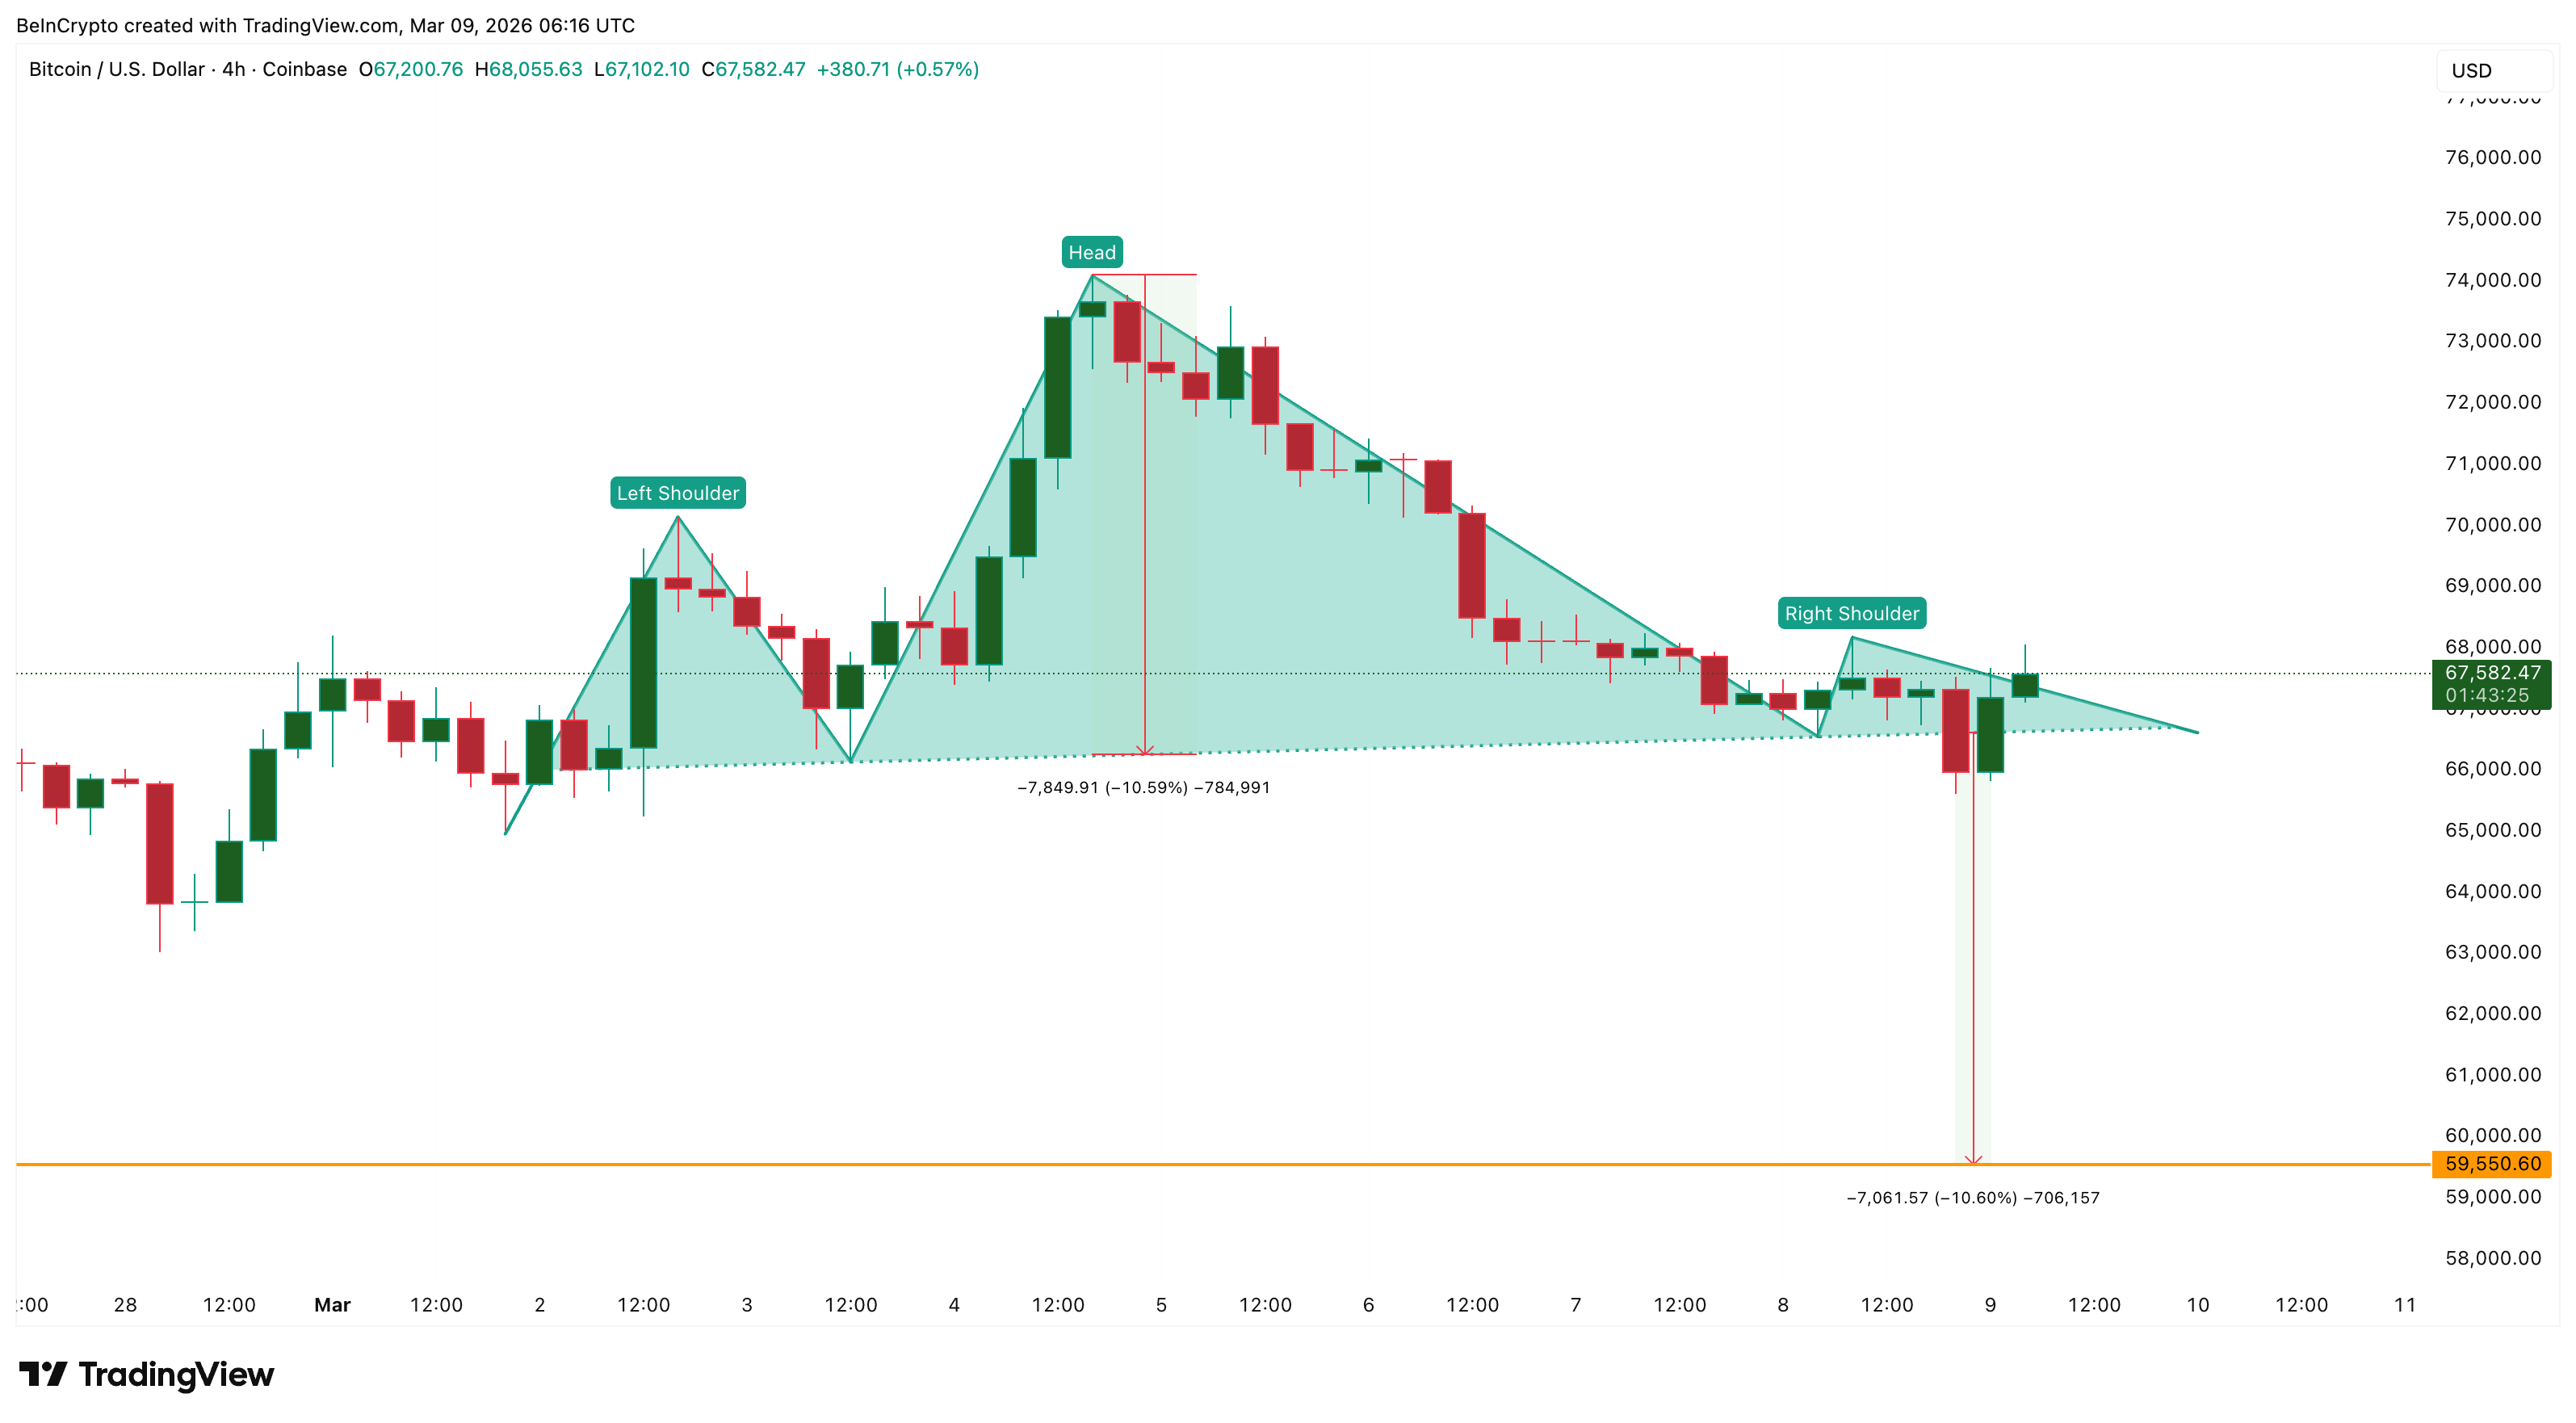
The quick reclaim after the initial break suggests the bearish pressure is not fully in control yet. However, the structure still indicates that the market is vulnerable to renewed downside attempts.
Leverage Collapse and Funding Rates Point to a Slow-Burn Setup
Derivatives sentiment helps explain why any potential decline may not happen abruptly.
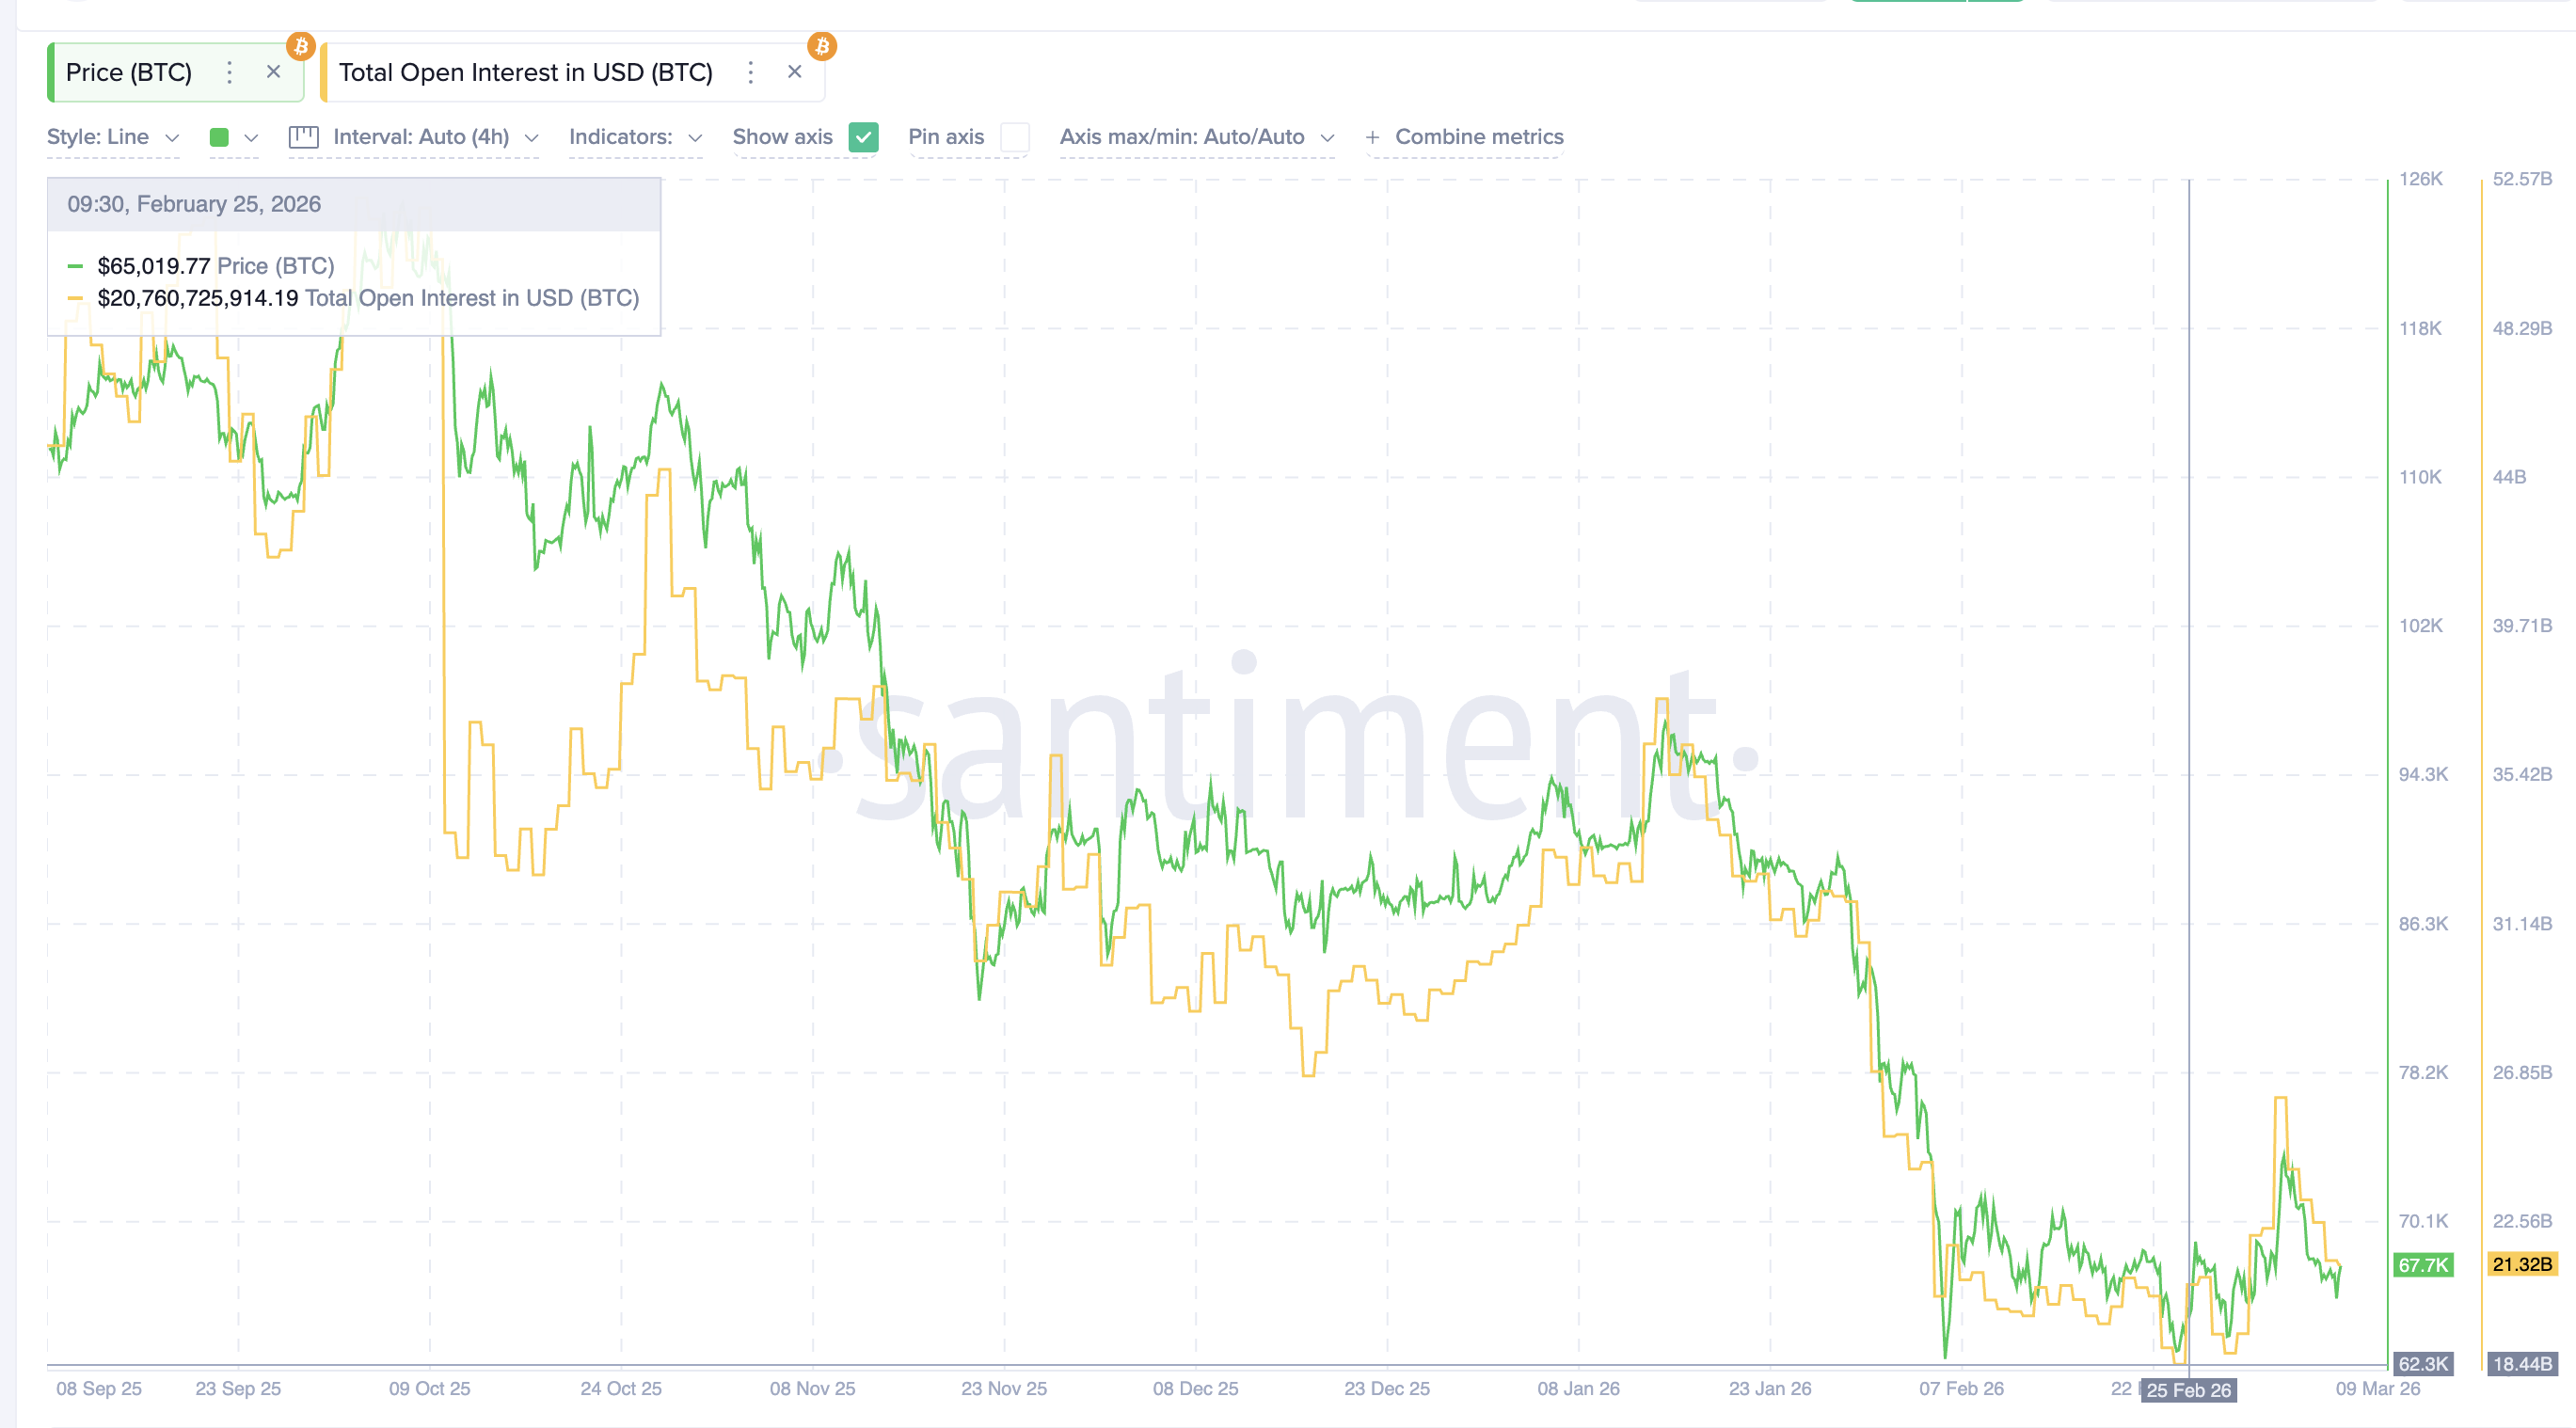
Bitcoin open interest, which tracks the total value of active futures and options positions, has fallen sharply in recent months. From a peak of about $37.67 billion in early January, open interest has dropped to around $21.32 billion, marking a decline of roughly 43%.
The current level also sits close to the six-month low of $18.38 billion recorded on February 24, meaning leveraged participation in the market remains significantly reduced.
Despite this drop in leverage, funding rates have recently moved slightly into positive territory near 0.002%. Positive funding suggests a mild bullish bias after the rebound.
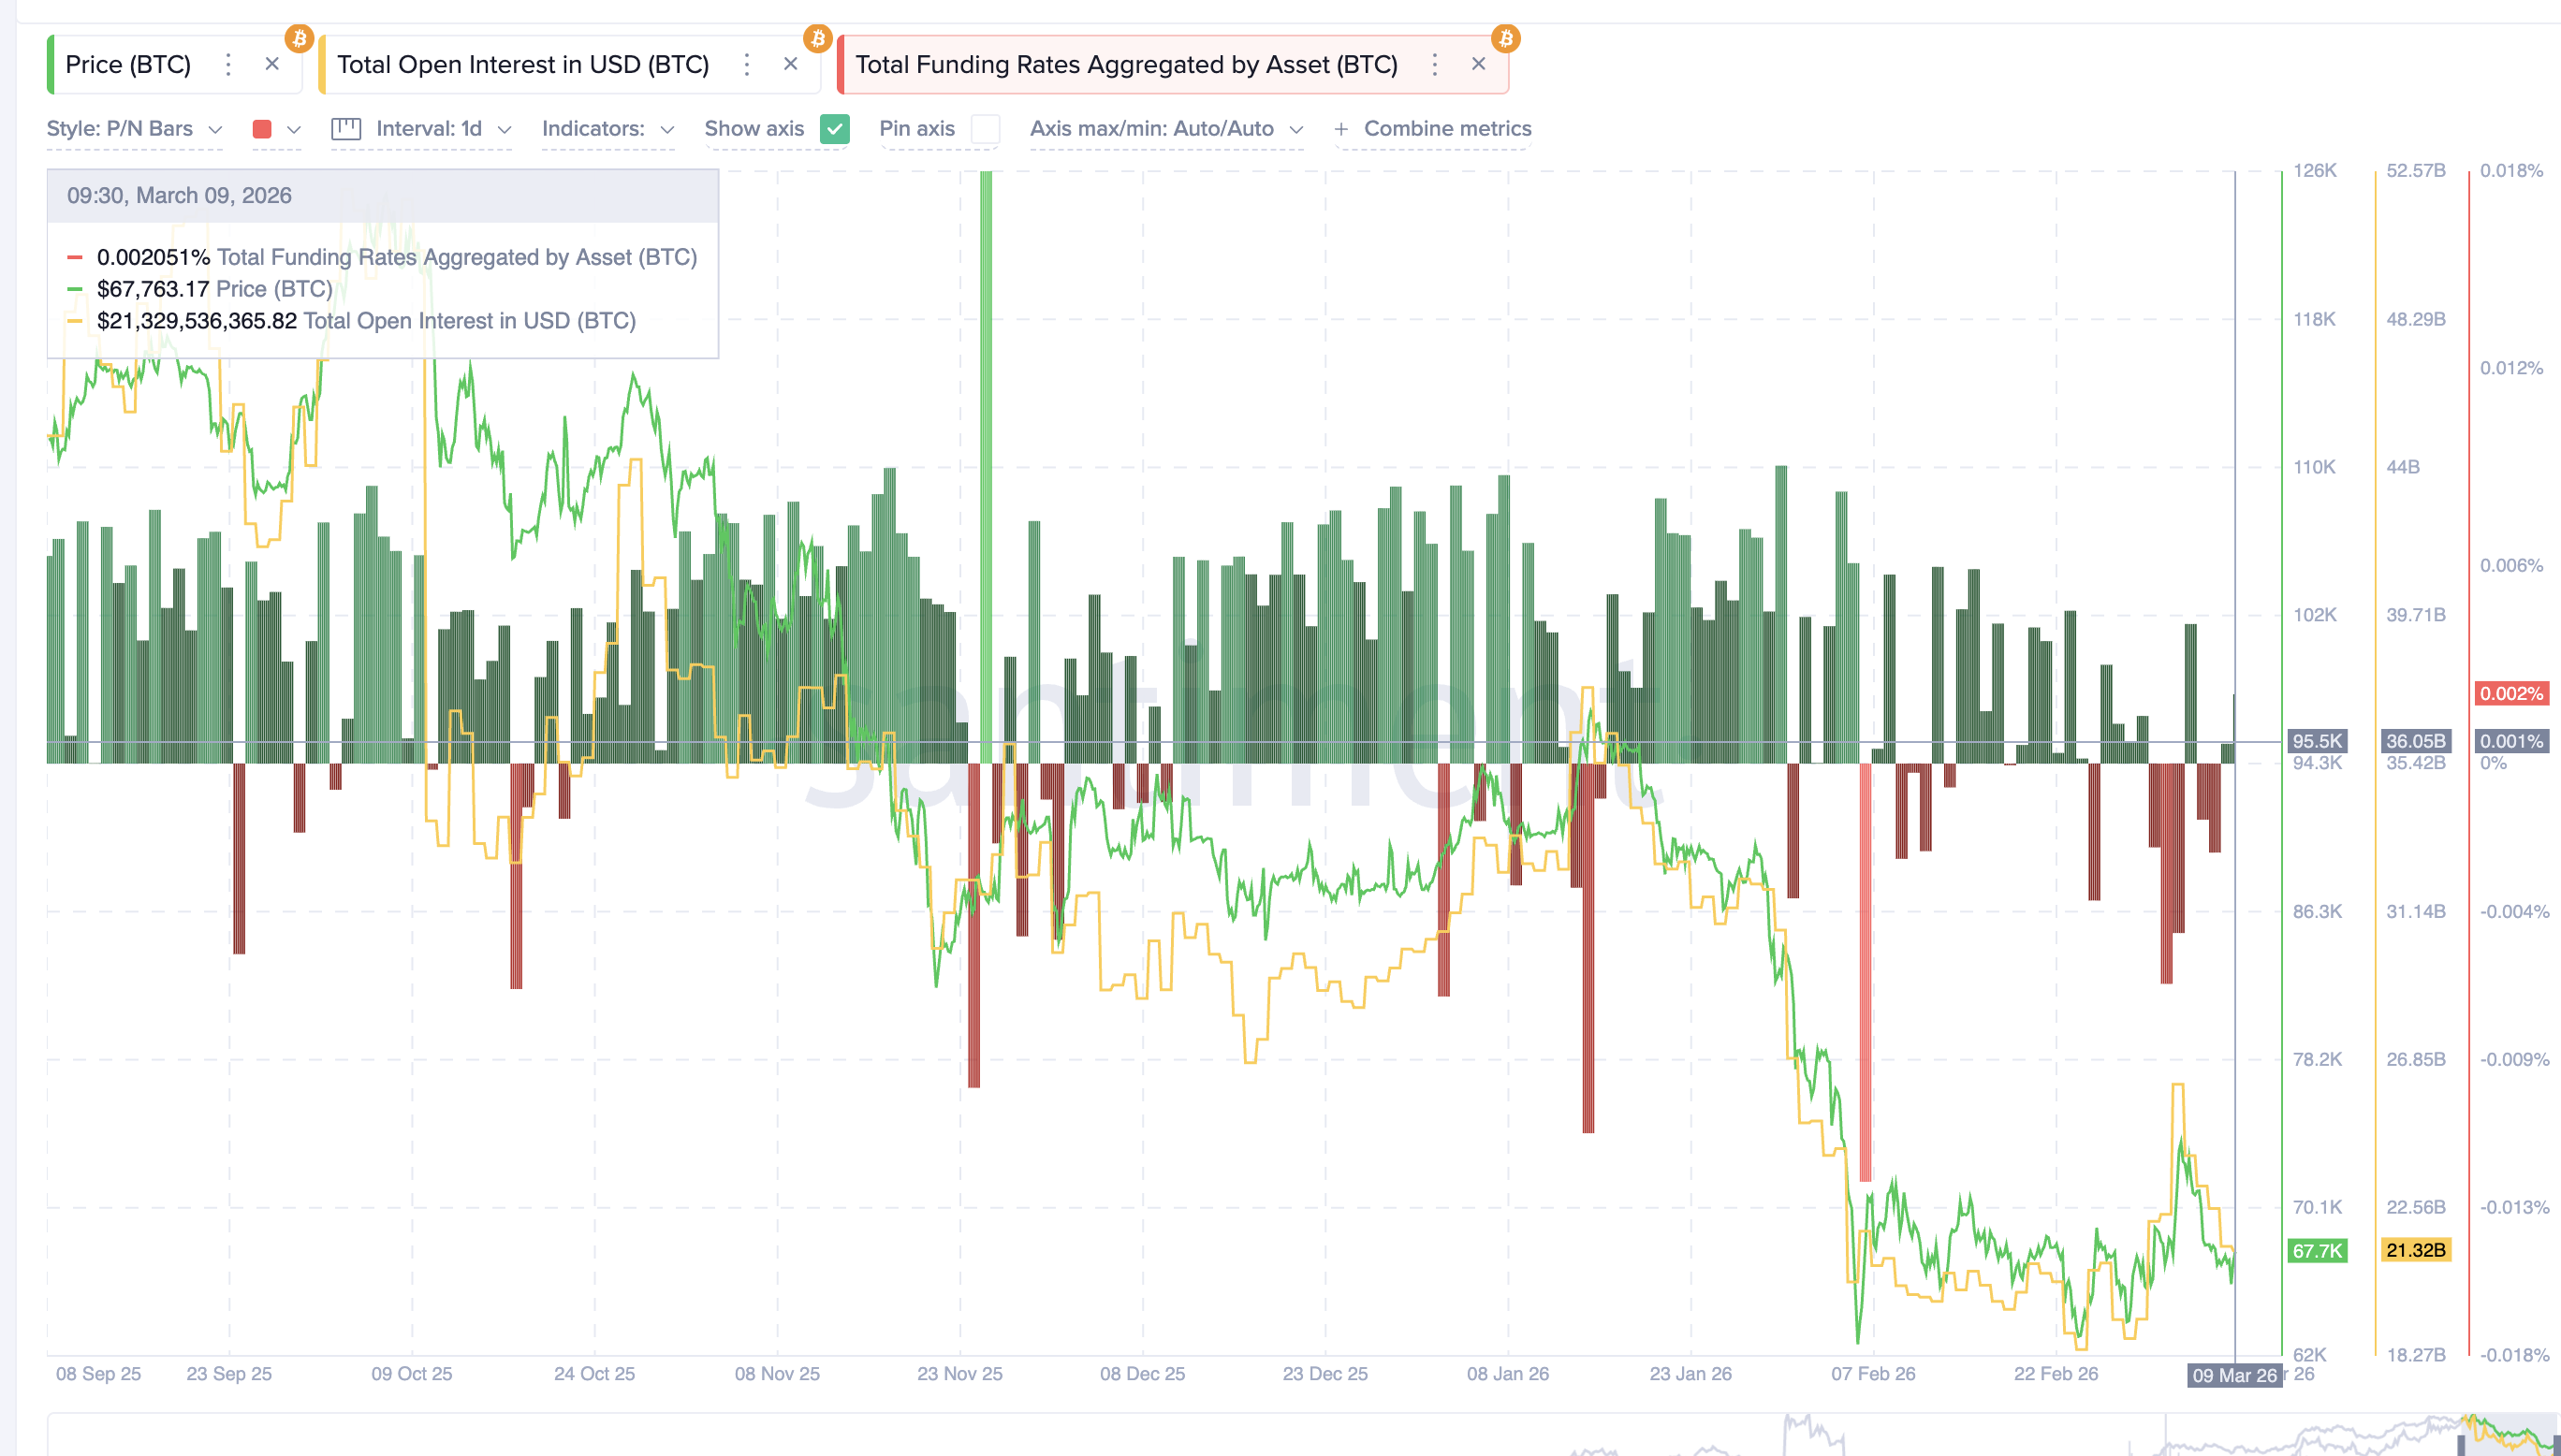
However, because overall leverage remains low, the market lacks the large pools of liquidations that usually accelerate rapid selloffs, courtesy of long squeeze risk. In such environments, price movements tend to unfold more slowly, as there are fewer forced liquidations to amplify the decline.
Spot Selling Has Dropped 95% While Whales Remain on the Sidelines
Spot market activity reinforces the idea that the market is not experiencing aggressive selling pressure.
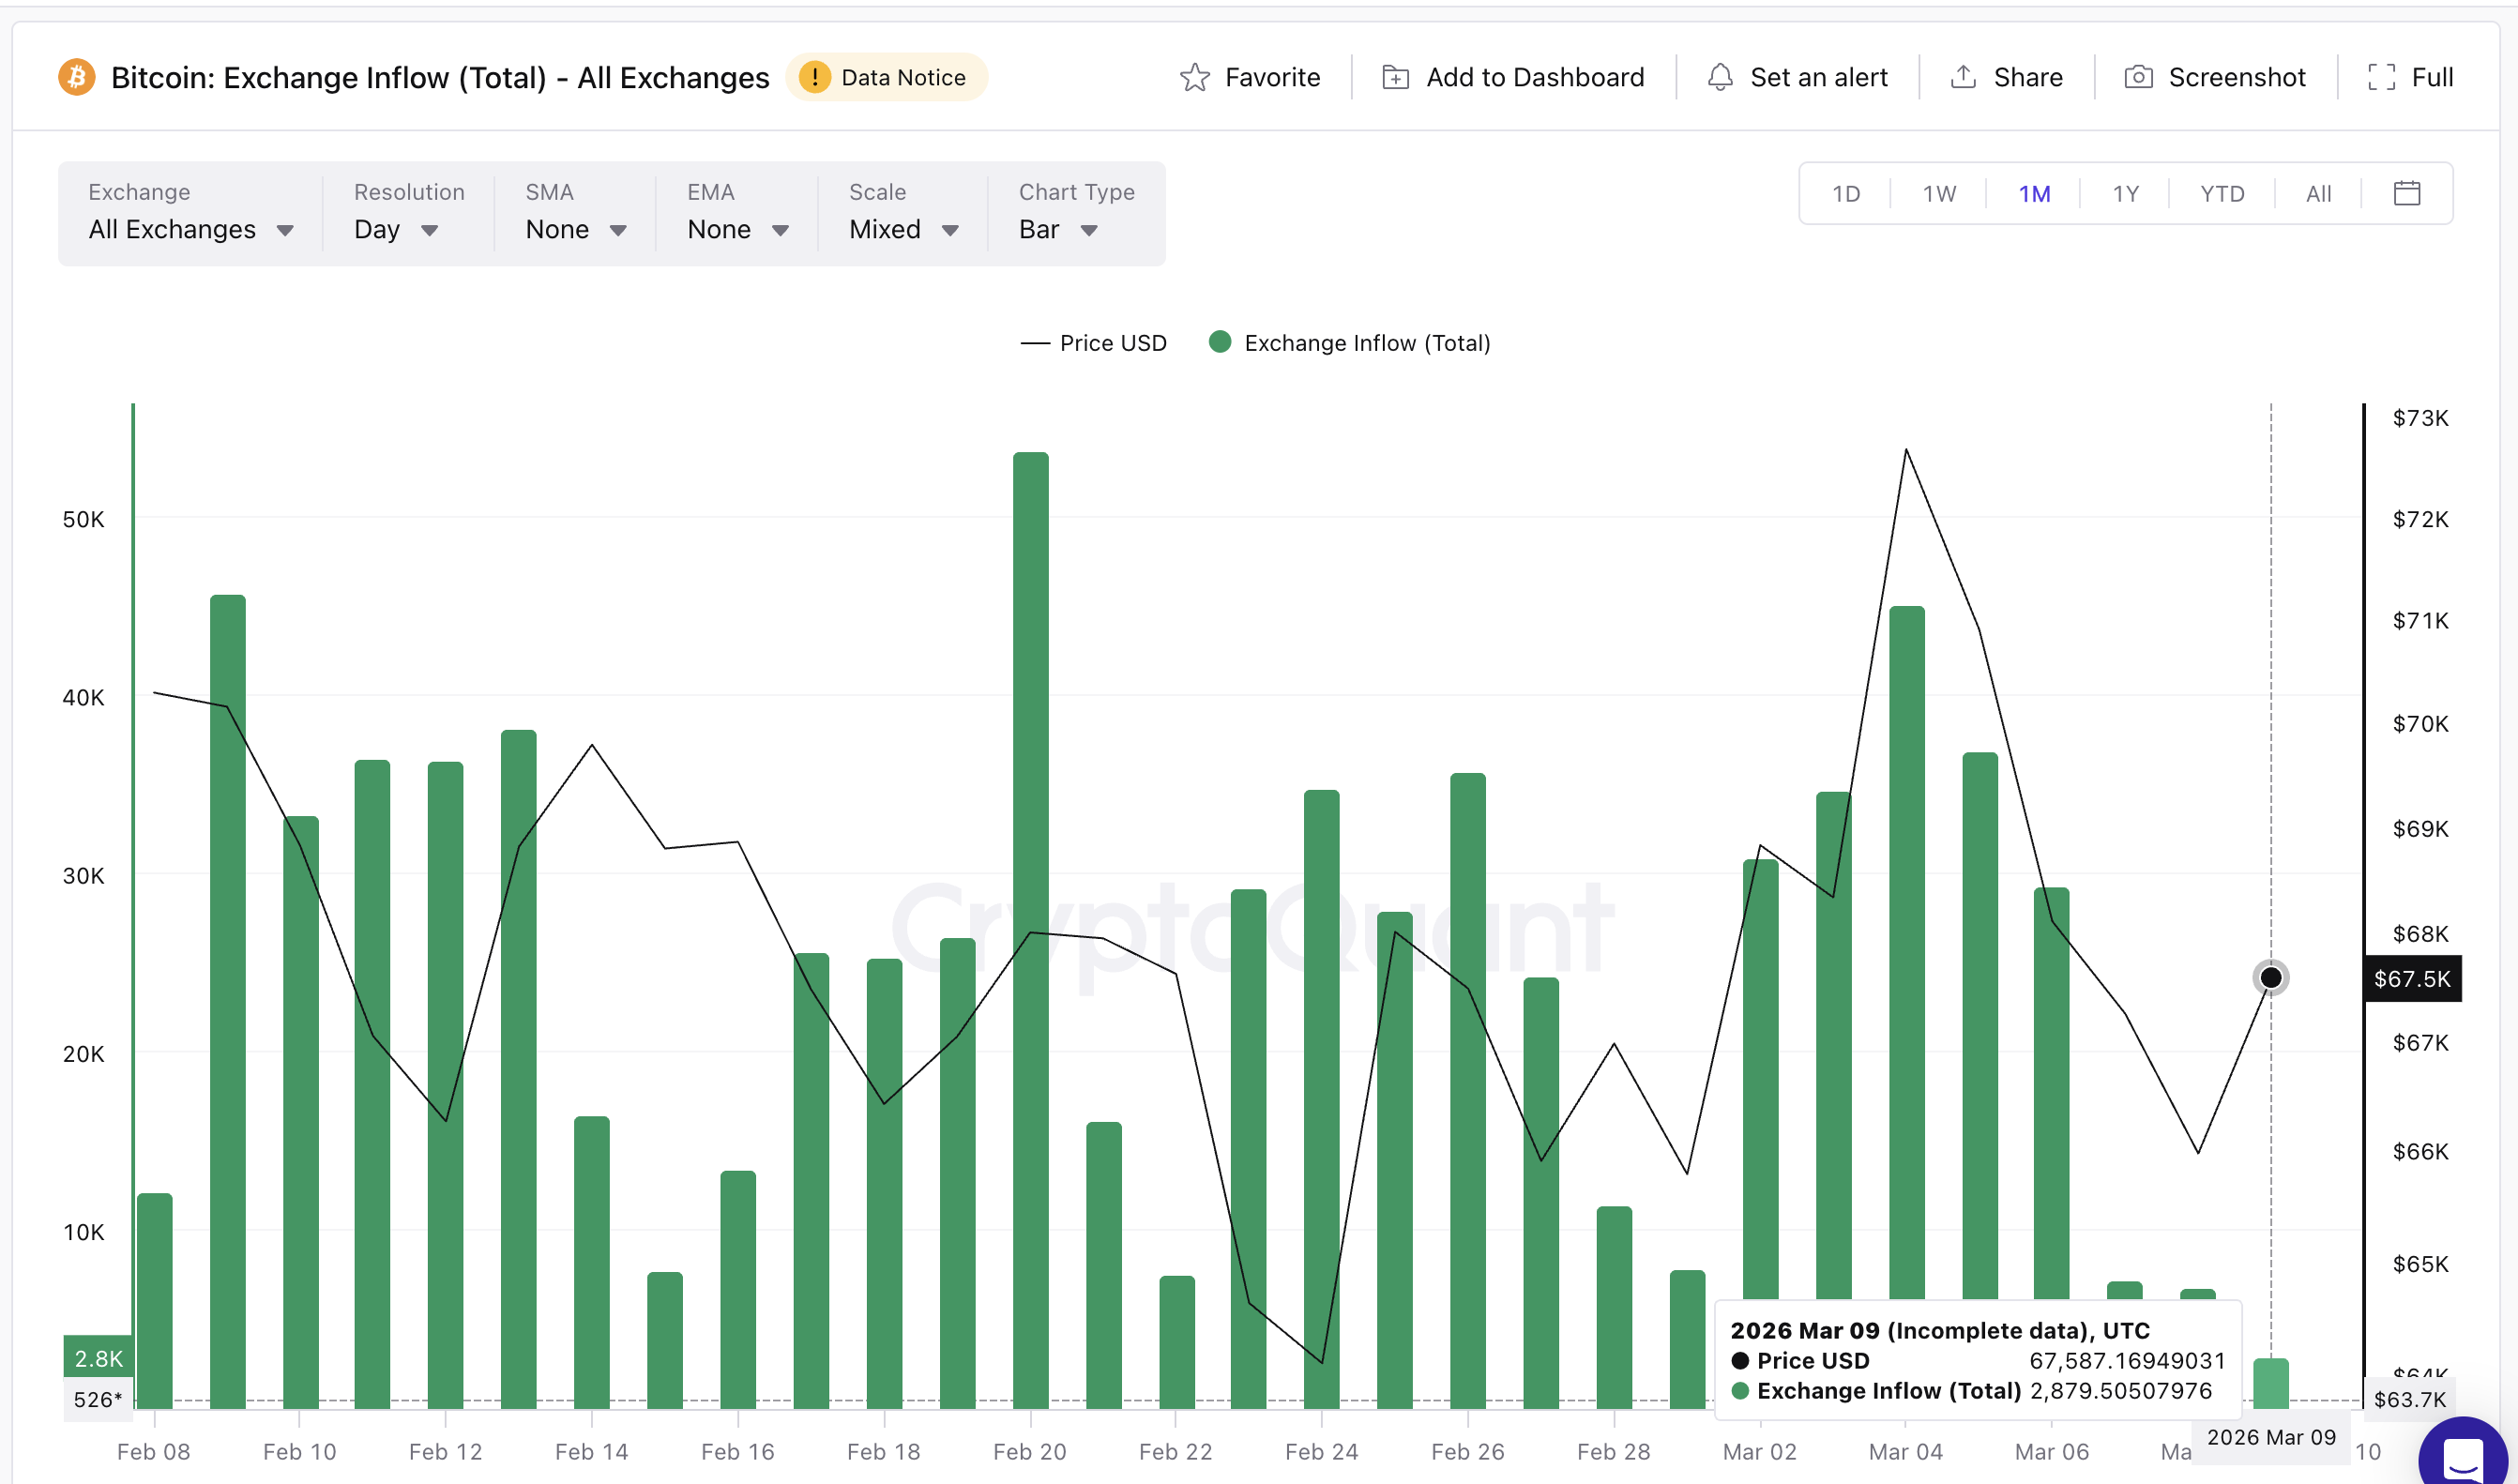
Exchange inflows, which measure how many coins are moving to trading platforms, peaked at around 53,709 BTC on February 20. Since then, inflows have dropped dramatically, falling to roughly 2,879 BTC by March 9.
This represents about a 95% decline in exchange inflows, marking the lowest levels seen in roughly a month. Lower inflows generally indicate fewer coins being transferred to exchanges for potential sale, suggesting that large holders are not rushing to exit their positions.
At the same time, BTC whale behavior shows a similar lack of urgency. Wallets holding between 1,000 BTC and 1,000,000 BTC have shown almost no significant balance changes since March 5.
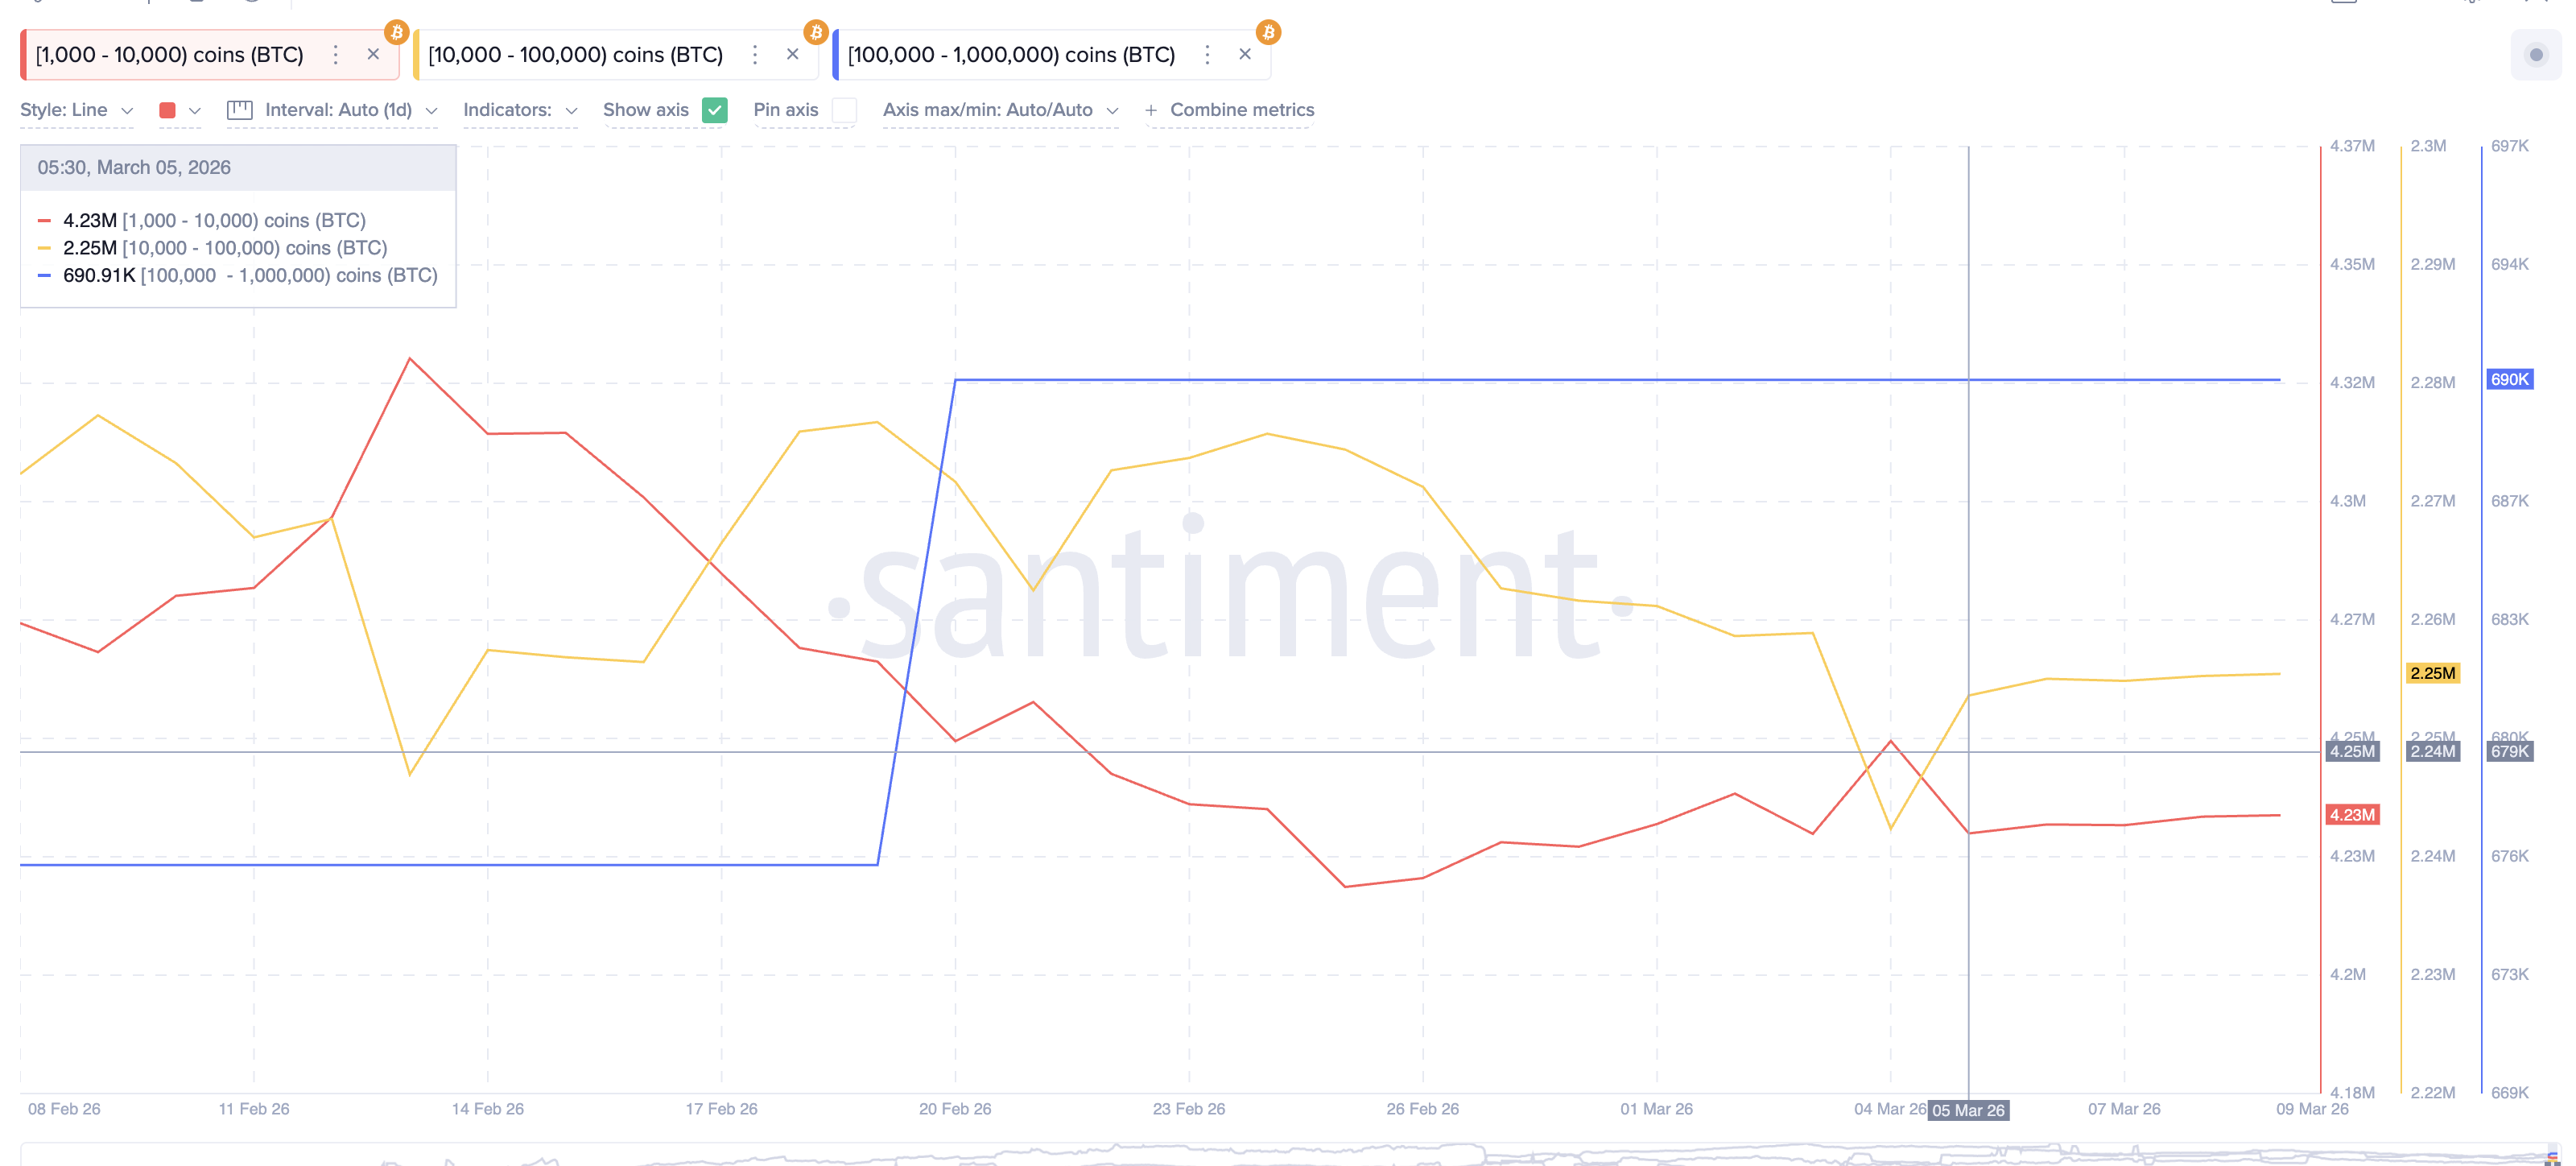
The absence of strong accumulation or distribution suggests that large market participants are largely waiting for a clearer direction before making their next move.
Bitcoin Price Levels to Watch This Week
Bitcoin’s short-term structure now places the market within a key trading range. Immediate resistance remains near $67,600, a level the market recently failed to reclaim decisively. If buyers push above that area, the next resistance zones appear near $68,800 and $70,800, with the latter aligning with an important Fibonacci retracement level.
A stronger breakout above $70,800 could reopen the path toward the $74,100 region.
On the downside, the most important support sits near $65,600. A decisive break below that level would likely reactivate the head-and-shoulders projection, potentially sending Bitcoin toward the $59,500 region.
For now, the combination of low leverage, muted spot selling, and inactive whales suggests Bitcoin may remain trapped between roughly $65,600 and $70,800 as the slow-burn scenario unfolds.
The post Bitcoin Enters New Week With a 10% Warning, But Leverage Collapse Teases a Slow Burn appeared first on BeInCrypto.